Review
. 2024 Jul 2;14(10):4127-4146.
doi: 10.7150/thno.97768. eCollection 2024.

Biomarker-driven molecular imaging probes in radiotherapy

Affiliations
Review

Biomarker-driven molecular imaging probes in radiotherapy

Haonan Li et al. Theranostics. .

Abstract

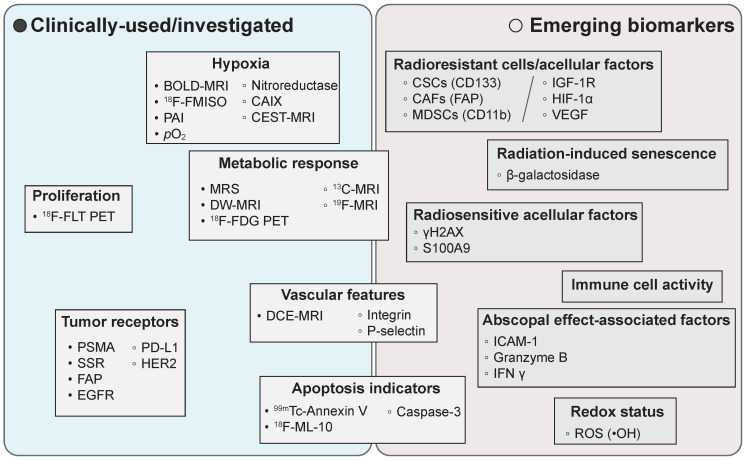
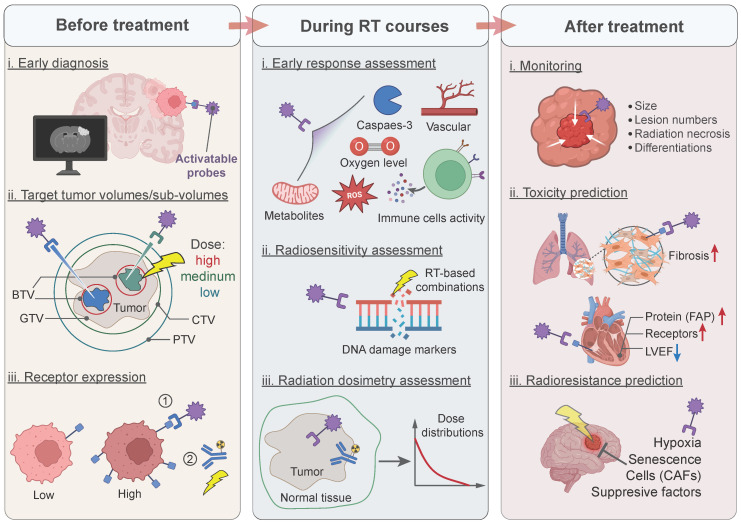
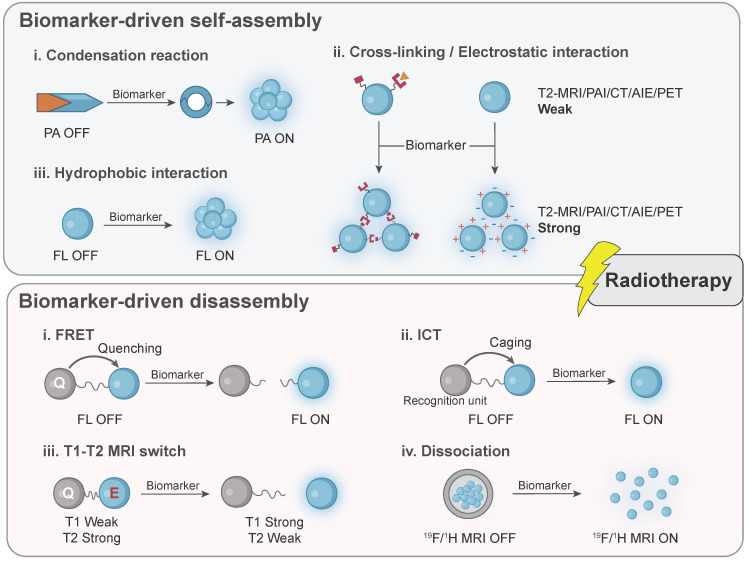
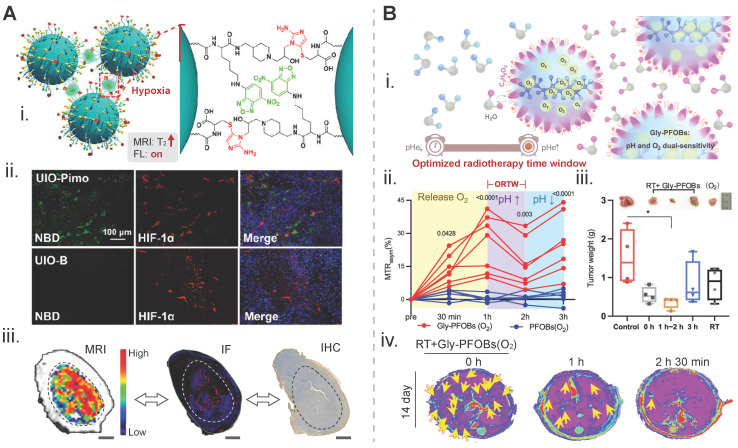
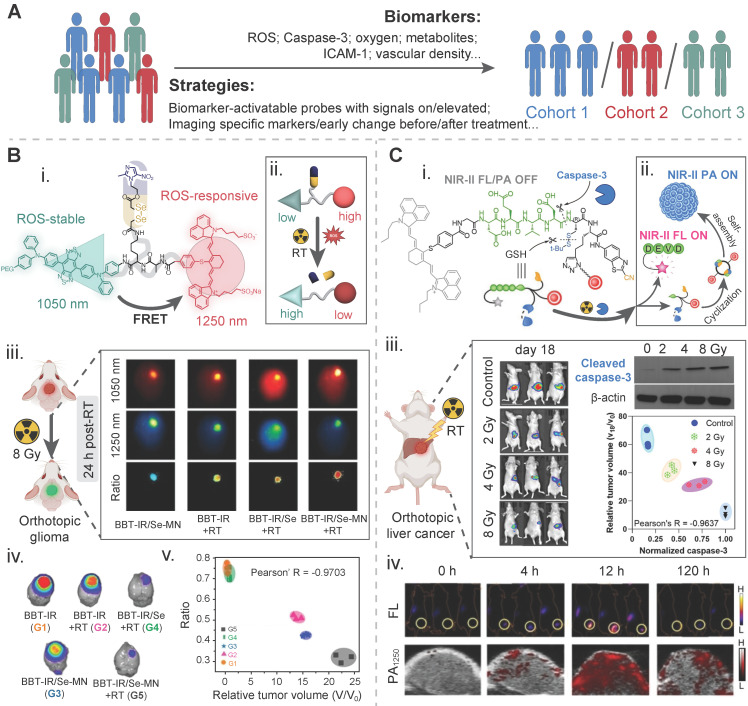
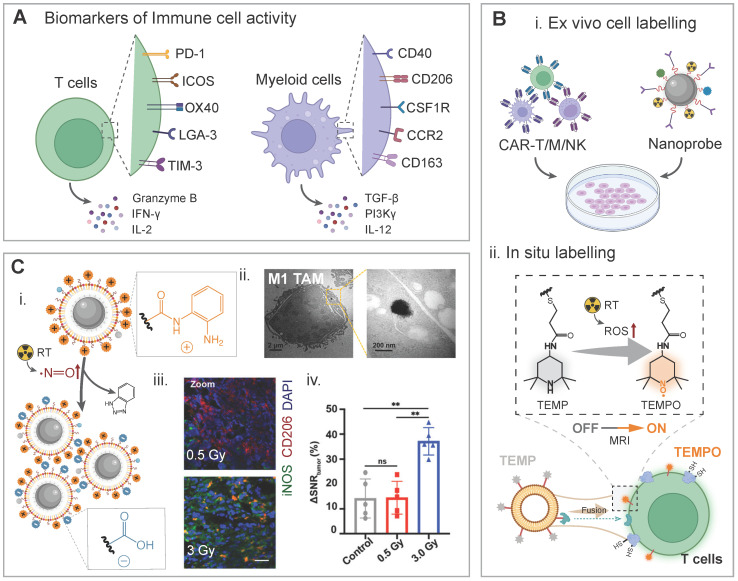
Background: Biomarker-driven molecular imaging has emerged as an integral part of cancer precision radiotherapy. The use of molecular imaging probes, including nanoprobes, have been explored in radiotherapy imaging to precisely and noninvasively monitor spatiotemporal distribution of biomarkers, potentially revealing tumor-killing mechanisms and therapy-induced adverse effects during radiation treatment. Methods: We summarized literature reports from preclinical studies and clinical trials, which cover two main parts: 1) Clinically-investigated and emerging imaging biomarkers associated with radiotherapy, and 2) instrumental roles, functions, and activatable mechanisms of molecular imaging probes in the radiotherapy workflow. In addition, reflection and future perspectives are proposed. Results: Numerous imaging biomarkers have been continuously explored in decades, while few of them have been successfully validated for their correlation with radiotherapeutic outcomes and/or radiation-induced toxicities. Meanwhile, activatable molecular imaging probes towards the emerging biomarkers have exhibited to be promising in animal or small-scale human studies for precision radiotherapy. Conclusion: Biomarker-driven molecular imaging probes are essential for precision radiotherapy. Despite very inspiring preliminary results, validation of imaging biomarkers and rational design strategies of probes await robust and extensive investigations. Especially, the correlation between imaging biomarkers and radiotherapeutic outcomes/toxicities should be established through multi-center collaboration involving a large cohort of patients.

Keywords: biomarker; imaging probe; molecular imaging; nanoparticle; radiotherapy.


Conflict of interest statement

Competing Interests: The authors have declared that no competing interest exists.

Figures

Figure 1
Figure 1
Representative clinically-used/investigated and emerging imaging biomarkers in radiation oncology. BOLD: blood oxygen level dependent; MRI: magnetic resonance imaging; FMISO: fluoromisonidazole; PAI: photoacoustic imaging; CAIX: carbonic anhydrase IX; CEST: chemical exchange saturation transfer; 18F-FLT: 3′-deoxy-3′-([18F]Fluoro)-fluorothymidine; PET: positron emission tomography; MRS: magnetic resonance spectroscopy; DW-MRI: diffusion-weighted MRI; 18F-FDG: 2-[18F]fluoro-2-deoxy-D-glucose; PSMA: prostate-specific membrane antigen; SSR: somatostatin receptor; FAP: fibroblast activation protein; EGFR: epidermal growth factor receptor; PD-L1: programmed death-ligand 1; HER2: human epidermal growth factor receptor 2; DCE: dynamic contrast-enhanced; CSCs: cancer stem cells; CAFs: cancer-associated fibroblasts; MDSCs: myeloid-derived suppressor cells; IGF-1R: insulin-like growth factor 1 receptor; VEGF: vascular endothelial growth factor; ICAM-1: intercellular cell adhesion molecule-1; IFNγ: interferon-γ; ROS: reactive oxygen species.
Figure 2
Figure 2
Application of activatable imaging probes in radiotherapy workflow. Before treatment: (i) diagnosing early-stage lesions; (ii) imaging different tumor sub-volumes for dose-escalation; (iii) monitoring the receptor expression for the selection of treatment methods. During radiotherapy courses: (i) assessing early tumor response; (ii) measuring the radiosensitivity index of radiotherapy; (iii) determining radiation dosimetry for optimizing treatment regimes. After treatment: (i) monitoring tumor progression and differentiating imaging results; (ii) predicting radiotherapy-induced toxicity for early interventions; (iii) predicting radioresistance for re-scheduling or changing treatment methods. BTV: biological target volume; GTV: gross tumor target volume; CTV: clinical target volume; PTV: planning target volume; FAP: fibroblast activation protein; LVEF: left ventricular ejection fraction; CAFs: cancer-associated fibroblasts.
Figure 3
Figure 3
Activatable mechanisms of biomarker-driven imaging probes are divided into two major types: biomarker-driven self-assembly and biomarker-driven disassembly. In situ modification of probes is not illustrated in this scheme. PAI: photoacoustic imaging; MRI: magnetic resonance imaging; CT: computed tomography; AIE: aggregation-induced emission; PET: positron emission tomography; FL: fluorescence; FRET: fluorescence resonance energy transfer; ICT: intramolecular charge transfer.
Figure 4
Figure 4
Biomarker-driven imaging probes for radiotherapy planning. A) Hypoxia-triggered self-assembly of an iron-oxide-based MRI/FL dual-mode nanoprobe, termed as UIO-Pimo, for delineation of the targeted tumor area: (i) design principles for imaging signal amplification; (ii) fluorescent images of tumor tissue slices. Red signal from HIF-1α indicates the hypoxia degree and the green signal from NBD represents the fluorescence of the activatable UIO-Pimo nanoprobe and a non-activatable UIO-B nanoprobe; (iii) the distribution of hypoxic areas within a tumor displayed via the nanoprobe-participated MRI difference value method. IF from HIF-1α, and IHC from commercial hypoxia indicator pimonidazole. Adapted with permission . Copyright 2021 American Chemical Society. B) A pH/oxygen-activatable 19F/1H dual-mode nanoprobe for determining an optimal radiotherapeutic window: (i) scheme for the design of the nanoprobe; (ii) dynamic CEST signal changes in a NCI-H460 lung tumor area after injection of Gly-PFOB(O2) or PFOB(O2); (iii) tumor weights of each group on day 14 post-treatment. The time on the x axis indicats the duration of radiation treatment after injection of Gly-PFOB (O2); (iv) T2WI MRI images of the liver in each treatment group, i.e., Gly-PFOB(O2) + RT, Gly-PFOB(O2) + RT at 1 h post injection of nanoprobe, and Gly-PFOB(O2) + RT at 2 h 30 min post injection on day 14 post-treatment. Yellow arrows indicate liver metastasis. Adapted with permission . Copyright 2023. Springer Nature. CC BY 4.0 (https://creativecommons.org/licenses/by/4.0/). MRI: magnetic resonance imaging; FL: fluorescence; HIF-1α: hypoxia-inducible factor-1 alpha; IF: immunofluorescence; IHC: immunohistochemistry.
Figure 5
Figure 5
Biomarker-driven imaging probes for patient stratification. A) Illustration of strategies and biomarkers for radiotherapy stratification. B) A tumor reactive oxygen species (ROS)-activatable ratiometric fluorescent probe for reporting the ROS level during radiosensitizer-enhanced radiotherapy: (i) chemical structure and (ii) activatable mechanism of this nanoprobe; (iii) NIR-II FL images of orthotopic glioma-bearing mice in different treatment groups at 24 h post radiotherapy; (iv) bioluminescence images of the brain in the tumor model in different treatment groups on day 16 post radiotherapy. The intensity is an indicator of the tumor mass; (v) correlation between the ratiometric intensity and the relative tumor volume of these above groups on day 15 post radiotherapy. Adapted with permission . Copyright 2023 WILEY-VCH GmbH. C) A caspase-3-activatable organic-inorganic hybrid nanoprobe for reporting the caspase-3 level during radiosensitizer-enhanced radiotherapy: (i) chemical structure and (ii) activatable mechanism of this nanoprobe. The red dot for a nanogapped gold nanoparticle; (iii) bioluminescence images of an orthotopic liver cancer model for measuring the tumor mass via the fluorescence intensity, western blotting images of activated caspase-3 in the tumor tissue, and the correlation between the caspase-3 level and the tumor mass in four treatment groups, i.e., the control (0 Gy), 2 Gy, 4 Gy, and 8 Gy; (iv) fluorescence images and photoacoustic images of ectopic xenograft HepG2 tumors under 8 Gy radiation at different time points after injection of the nanoprobe. Adapted with permission . Copyright 2022 WILEY-VCH GmbH.
Figure 6
Figure 6
Biomarker-driven imaging probes for immune cells and their activities. A) Schematic illustration of biomarkers for immune cell activities during radiotherapy, including up/down-regulated surface receptors and secreted cytokines. B) Imaging of immune cells can be realized by ex vivo cell labelling and in situ labelling. Imaging-visible nanoprobes were ex vivo labelled with CAR-T/M/NK cells for real-time monitoring of their biodistribution, and T cell-directed liposomes were fused with T cell for in-situ labelling and they were activated when encountering radiation-induced ROS. C) Nitric oxide-triggered self-assembly of the USPIO@OMG nanoprobe for evaluating macrophage polarization during radiotherapy: (i) chemical principle for aggregation of the nanoprobe; (ii) TEM images to confirm the aggregation status of the nanoprobe in M1 macrophages; (iii) CLSM images of tumor slices from two radiation dose-treated groups, red CD206 signal indicates M2 macrophages while the green iNOS signal represents M1 macrophages; (iv) The T2 MRI signal changes in different groups. Adapted with permission . Copyright 2023 American Chemical Society.

Similar articles

Cited by

References

    1. Olin AB, Hansen AE, Rasmussen JH, Ladefoged CN, Berthelsen AK, Håkansson K. et al. Feasibility of multiparametric positron emission tomography/magnetic resonance imaging as a one-stop shop for radiation therapy planning for patients with head and neck cancer. Int J Radiat Oncol Biol Phys. 2020;108:1329–38. - PubMed
    1. Vitzthum LK, Surucu M, Gensheimer MF, Kovalchuk N, Han B, Pham D. et al. BIOGUIDE-X: a first-in-human study of the performance of positron emission tomography-guided radiation therapy. Int J Radiat Oncol Biol Phys. 2024;118:1172–80. - PubMed
    1. Michaelis LC, Ratain MJ. Measuring response in a post-RECIST world: from black and white to shades of grey. Nat Rev Cancer. 2006;6:409–14. - PubMed
    1. Gafita A, Djaileb L, Rauscher I, Fendler WP, Hadaschik B, Rowe SP. et al. Response Evaluation Criteria in PSMA PET/CT (RECIP 1.0) in metastatic castration-resistant prostate cancer. Radiology. 2023;308:222148. - PMC - PubMed
    1. Li H, Luo Q, Zhang H, Ma X, Gu Z, Gong Q, Luo K. Nanomedicine embraces cancer radio-immunotherapy: mechanism, design, recent advances, and clinical translation. Chem Soc Rev. 2023;52:47–96. - PubMed

Publication types