. 2024 Jul 1;14(10):4058-4075.
doi: 10.7150/thno.96890. eCollection 2024.

Microglial circ-UBE2K exacerbates depression by regulating parental gene UBE2K via targeting HNRNPU

Affiliations

Microglial circ-UBE2K exacerbates depression by regulating parental gene UBE2K via targeting HNRNPU

Yujie Cai et al. Theranostics. .

Abstract

Background: Knowledge about the pathogenesis of depression and treatments for this disease are lacking. Epigenetics-related circRNAs are likely involved in the mechanism of depression and have great potential as treatment targets, but their mechanism of action is still unclear. Methods: Circular RNA UBE2K (circ-UBE2K) was screened from peripheral blood of patients with major depressive disorder (MDD) and brain of depression model mice through high-throughput sequencing. Microinjection of circ-UBE2K overexpression lentivirus and adeno-associated virus for interfering with microglial circ-UBE2K into the mouse hippocampus was used to observe the role of circ-UBE2K in MDD. Sucrose preference, forced swim, tail suspension and open filed tests were performed to evaluate the depressive-like behaviors of mice. Immunofluorescence and Western blotting analysis of the effects of circ-UBE2K on microglial activation and immune inflammation. Pull-down-mass spectrometry assay, RNA immunoprecipitation (RIP) test and fluorescence in situ hybridization (FISH) were used to identify downstream targets of circ-UBE2K/ HNRNPU (heterogeneous nuclear ribonucleoprotein U) axis. Results: In this study, through high-throughput sequencing and large-scale screening, we found that circ-UBE2K levels were significantly elevated both in the peripheral blood of patients with MDD and in the brains of depression model mice. Functionally, circ-UBE2K-overexpressing mice exhibited worsened depression-like symptoms, elevated brain inflammatory factor levels, and abnormal microglial activation. Knocking down circ-UBE2K mitigated these changes. Mechanistically, we found that circ-UBE2K binds to heterogeneous nuclear ribonucleoprotein U (HNRNPU) to form a complex that upregulates the expression of the parental gene ubiquitin conjugating enzyme E2 K (UBE2K), leading to abnormal microglial activation and neuroinflammation and promoting the occurrence and development of depression. Conclusions: The findings of the present study revealed that the expression of circUBE2K, which combines with HNRNPU to form the circUBE2K/HNRNPU complex, is increased in microglia after external stress, thus regulating the expression of the parental gene UBE2K and mediating the abnormal activation of microglia to induce neuroinflammation, promoting the development of MDD. These results indicate that circ-UBE2K plays a newly discovered role in the pathogenesis of depression.

Keywords: circular RNA UBE2K (circ-UBE2K); heterogeneous nuclear ribonucleoprotein U (HNRNPU); major depressive disorder (MDD); microglial activation; neuroinflammation.


Conflict of interest statement

Competing Interests: The authors have declared that no competing interest exists.

Figures

Figure 1
Figure 1
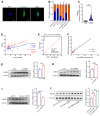
Circ-UBE2K was significantly upregulated in MDD patients and depression model mice. (A) qPCR analysis of circ-UBE2K expression levels in the peripheral blood of MDD patients (n=29) and healthy control subjects (n=16). (B) Correlations between circ-UBE2K expression and HAMD-17 scores according to Pearson's correlation coefficient. (C) Correlations between circ-UBE2K expression and HAMD-24 scores were determined using Pearson's correlation coefficient. (D) ROC curve for circ-UBE2K expression levels in patients with MDD and healthy control subjects. (E) qPCR analysis of circ-UBE2K expression levels in the brain tissues of CUMS model mice (n =7) and control mice (n =8). (F) qPCR analysis of circ-UBE2K expression levels in the whole blood of CUMS model mice (n =10) and control mice (n =10). (G-H) Images of circ-UBE2K (G) and quantification of circ-UBE2K levels (H) in brain tissues from CUMS model mice and control mice. Green, FITC-labeled probes specific for circ-UBE2K; blue, DAPI (nuclei); the merged image shows overlap of the fluorescent signals. Scale bar, 50 µm. The data are presented as the mean ± SEM. *P < 0.05 and **P < 0.01.
Figure 2
Figure 2
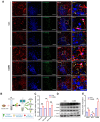
Expression and distribution of circ-UBE2K in mouse brain tissues. (A) Distribution of circ-UBE2K in different cell types in the mouse brain CA3 region. The white triangular arrow points to the co-localization of circ-UBE2K with astrocytes, microglia and neurons. Scale bar, 50 µm (overview) and 20 µm (overview). (B) Schematic diagram of the magnetic bead method used to isolate neurons, astrocytes, and microglia in the mouse brain. (C) qPCR analysis of circ-UBE2K expression in neurons, astrocytes, and microglia from CUMS model mice (n=4) and control mice (n=4), which were separated by magnetic beads. (D-E) Western blot analysis of Iba-1, iNOS and CD68 expression levels in CUMS model mice (n=3) and control mice (n=3). All the data are presented as the mean ± SEM. One-way ANOVA followed by Tukey's post hoc test. ns, not significant, *P < 0.05 and **P < 0.01.
Figure 3
Figure 3
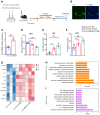
Overexpression of circ-UBE2K aggravated depression-like behavior and inflammation. (A) Illustration of bilateral stereotactic injection of lentivirus into CUM-induced depression model mice and timeline of the experimental procedure. Six-week-old mice were injected with lentivirus into the hippocampus. (B) The success of the injection was assessed by assessing GFP expression 4 weeks after microinjection. (C) Circ-UBE2K levels were measured 4 weeks after microinjection. n =5/group. (D-F) Effects of microinjection of a circ-UBE2K-overexpressing lentivirus on depression-like behavior in CUMS model mice. Performance in the SPT (D), TST (E) and FST (F) was evaluated 4 weeks after CUMS exposure. n =6/group. (G) Heatmaps of differentially expressed immune and inflammatory cytokines identified by a semiquantitative cytokine array (Quantibody® Mouse Inflammation Array 1). n = 3 mice/group. The color indicates the degree of upregulation (red tones) or downregulation (magenta tones) in the circ-Con-NC group, circ-Con-CUMS group and circ-UBE2K-CUMS group. (H-I) GO enrichment analysis and KEGG enrichment analysis of the DEPs. All the data are presented as the mean ± SEM. *P < 0.05, **P < 0.01 and ***P < 0.001. Unpaired Student's t-test for C, One-way ANOVA followed by Tukey's post hoc test for D-F.
Figure 4
Figure 4
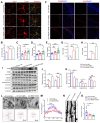
Circ-UBE2K overexpression promote glial activation and neuronal damage. (A) Immunofluorescence staining of Iba1-positive cells in the hippocampus in the different groups. Scale bars, 50 μm. Magnified images are shown in the middle column, and skeletal diagrams of Iba1-positive cells are shown on the right of panel A. Scale bars, 10 μm. (B-E) Quantification of the Iba1intensity, soma volume, branch length and feret's diameter of cells. (F-H) Representative images of iNOS and CD68 immunostaining (F) and quantification of iNOS and CD68 levels (G-H) in the hippocampus in the different groups. Scale bars, 50 μm. (I-K) Representative Western blots of the CD68, iNOS, PSD95, synaptophysin and syntaxin1 expression (I) and quantification of these proteins expression levels (J-K) in the different groups. (L) Representative microphotographs of the Golgi-stained hippocampus (up) and skeletonized CA1 pyramidal neurons in the hippocampus (down) in the different groups. Scale bars, 50 μm. (M) Sholl analysis of the dendritic complexity of CA1 pyramidal neurons in the different groups. 10 neurons /group. #P < 0.05 circ-Con-NC vs circ-Con-CUMS, *P < 0.05, **P < 0.01 and ***P <0.001 circ-Con-NC vs circ-UBE2K-CUMS. (N-O) Representative images of neuronal dendrites after Golgi-Cox staining in the different groups (N) and summary data for the spine number/10 μm (O). All the data are presented as the mean ± SEM. ns, not significant, *P < 0.05, **P < 0.01 and ***P < 0.001.
Figure 5
Figure 5
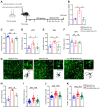
Specific interference with circ-UBE2K expression in microglia mitigates depressive behavior in mice and normalizes microglial activation. (A) Illustration of bilateral stereotactic injection of AAV into LPS-induced depression model mice and timeline of the experiment. Six-week-old mice were injected with AAV into the hippocampus. (B) Circ-UBE2K levels were measured 4 weeks after microinjection and 5 days after LPS treatment. n =3/group. (C-F) Results of the behavioral tests (SPT, FST, TST, and OFT) for the different groups. (G) Representative images of Iba1 (green) immunostaining and 3D reconstruction (black) of microglia in the different groups. Scale bars, 50 μm (overview) and 10 μm (inset and rendering). (H-K) Quantification of the Iba-1 intensity, soma volume, branch length and feret diameter of Iba1-positive cells. All the data are presented as the mean ± SEM. ns, not significant, *P < 0.05, **P < 0.01, ***P < 0.001 and ****P < 0.0001. One-way ANOVA followed by Tukey's post hoc test.
Figure 6
Figure 6
Circ-UBE2K positively regulates its host gene UBE2K expression. (A) The distribution of circ-UBE2K in HMC3 cells determined by FISH. FITC-labeled probes specific for circ-UBE2K. Scale bar, 20 μm. (B) The relative expression of circ-UBE2K was measured by qPCR after isolation of RNA from the cell nucleus and cytoplasm. (C) qPCR analysis of UBE2K mRNA expression levels in the peripheral blood of MDD patients (n=29) and healthy control subjects (n=16). (D) Correlations between UBE2K mRNA expression and HAMD-17 and HAMD-24 scores were determined using Pearson's correlation coefficient. (E) ROC curve for UBE2K mRNA expression levels in patients with MDD and healthy control subjects. (F) Correlations between circ-UBE2K expression and UBE2K mRNA expression were determined using Pearson's correlation coefficient. (G) Western blot analysis of UBE2K expression levels in CUMS model mice (n =3) and control mice (n =3). (H-I) Western blot analysis of UBE2K expression after transfection of cells with the circ-UBE2K overexpression plasmid or siRNAs. (J) Western blot analysis of UBE2K expression in the circ-Con-NC group, circ-Con-CUMS group and circ-UBE2K-CUMS group. All the data are presented as the mean ± SEM. ns, not significant, *P < 0.05, **P < 0.01 and ****P < 0.0001. Unpaired Student's t-test for C, G, H, I. One-way ANOVA followed by Tukey's post hoc test for J.
Figure 7
Figure 7
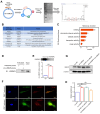
Circ-UBE2K directly interacts with the HNRNPU protein in microglia. (A) A biotin-labeled probe and a control (Ctrl) probe complementary to the circ-UBE2K junction were incubated with HMC3 cells. Circ-UBE2K-interacting proteins were identified by mass spectrometry after pull-down with streptavidin beads. (B) The top 10 proteins identified from the pull-down/mass spectrometry data. (C) GO enrichment analysis of the pulled down proteins. (D) Immunoblot analysis of HNRNPU after the pulldown assay showing its specific association with circ-UBE2K. (E) RIP showing the association of HNRNPU with circ-UBE2K. Top, IP was performed using HMC3 cell lysates and either an IgG (control) antibody or an anti-HNRNPU antibody. IgG antibody served as a control. Bottom, the expression of circ-UBE2K in the pulled down material was measured by qPCR analysis. (F) IF-FISH assay showing that circ-UBE2K colocalized with the HNRNPU protein in HMC3 cells. Green, FITC-labeled probes specific for circ-UBE2K; green, HNRNPU protein; blue, DAPI (nuclei); the merged image shows the overlap of the fluorescent signals. (G-H) Representative Western blot images and relative expression of UBE2K. The data are presented as the means± SEM. from three independent experiments. ns, not significant, **P < 0.01. Unpaired t-test for E, One-way ANOVA followed by Tukey's post hoc test for H.

References

    1. Fava M, Kendler KS. Major depressive disorder. Neuron. 2000;28:335–41. - PubMed
    1. Kupfer DJ, Frank E, Phillips ML. Major depressive disorder: new clinical, neurobiological, and treatment perspectives. Lancet. 2012;379:1045–55. - PMC - PubMed
    1. Charlson F, van Ommeren M, Flaxman A, Cornett J, Whiteford H, Saxena S. New WHO prevalence estimates of mental disorders in conflict settings: a systematic review and meta-analysis. Lancet. 2019;394:240–8. - PMC - PubMed
    1. Flint J, Kendler KS. The genetics of major depression. Neuron. 2014;81:484–503. - PMC - PubMed
    1. Chmielewska N, Szyndler J, Maciejak P, Plaznik A. Epigenetic mechanisms of stress and depression. Psychiatr Pol. 2019;53:1413–28. - PubMed

Publication types

Substances

LinkOut - more resources