. 2024 Jul 1;14(10):4014-4057.
doi: 10.7150/thno.97335. eCollection 2024.

Bioinspired soft-hard combined system with mild photothermal therapeutic activity promotes diabetic bone defect healing via synergetic effects of immune activation and angiogenesis

Affiliations

Bioinspired soft-hard combined system with mild photothermal therapeutic activity promotes diabetic bone defect healing via synergetic effects of immune activation and angiogenesis

Minhao Wu et al. Theranostics. .

Abstract

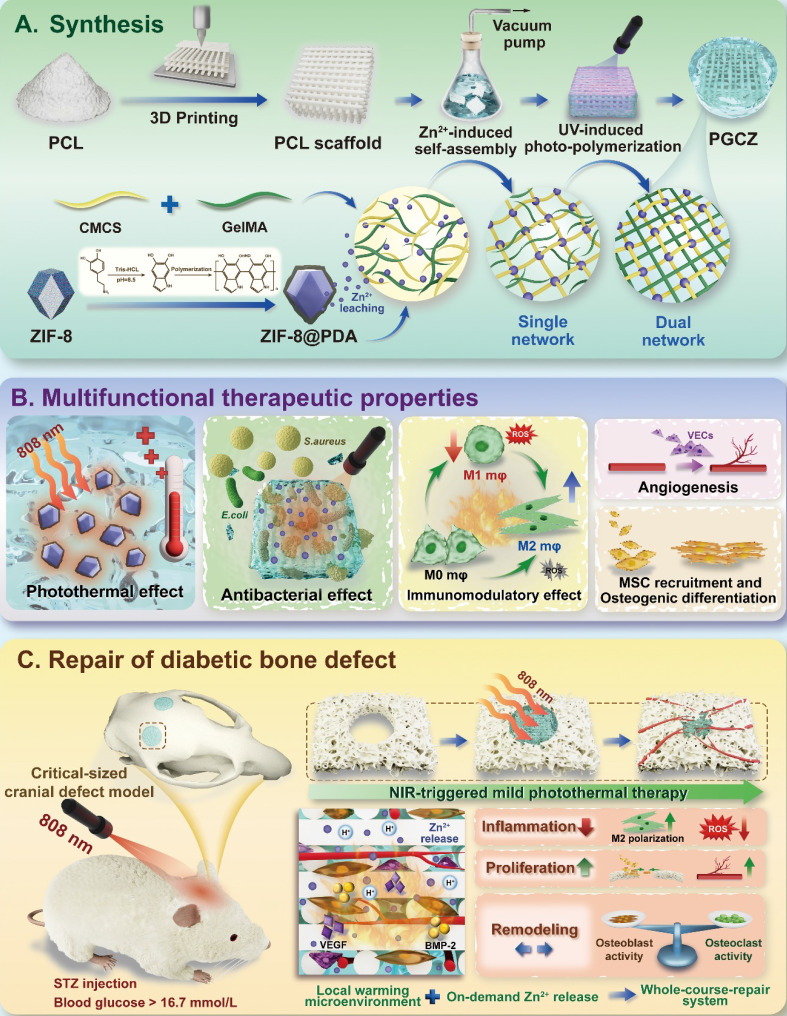
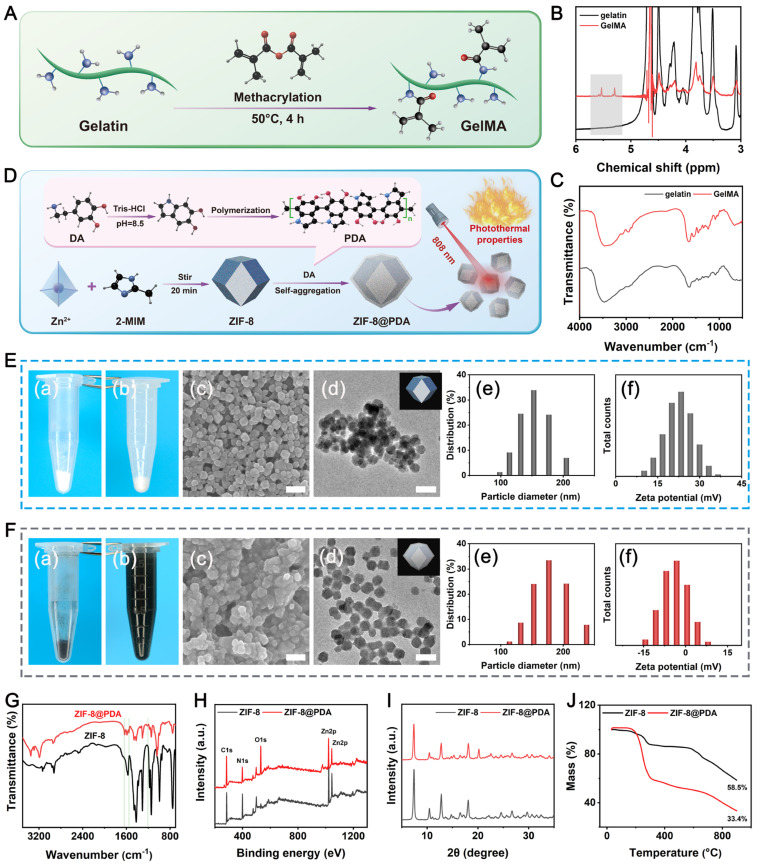
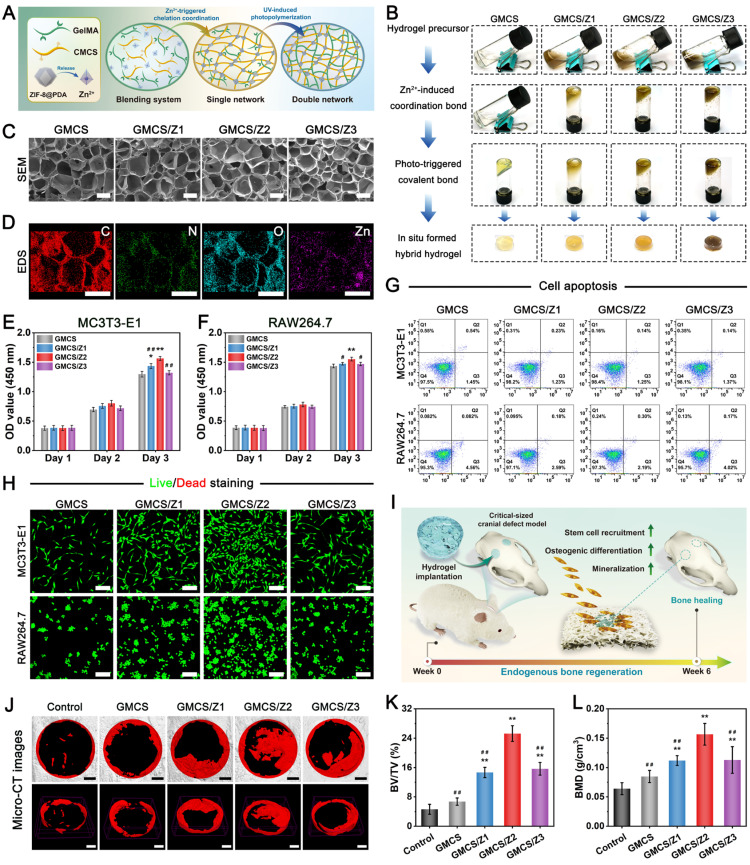
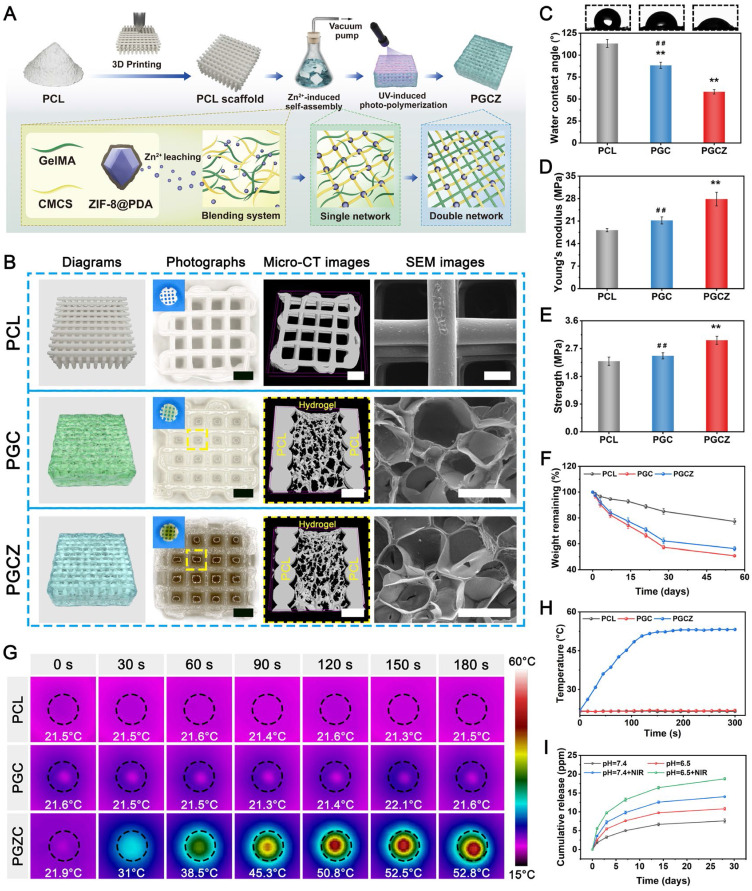
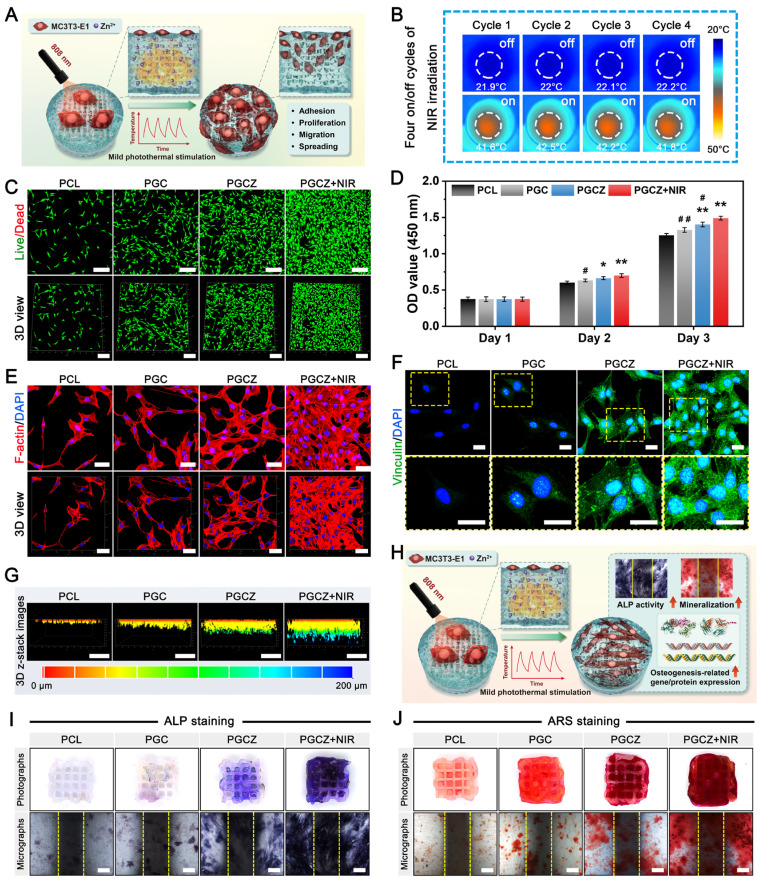
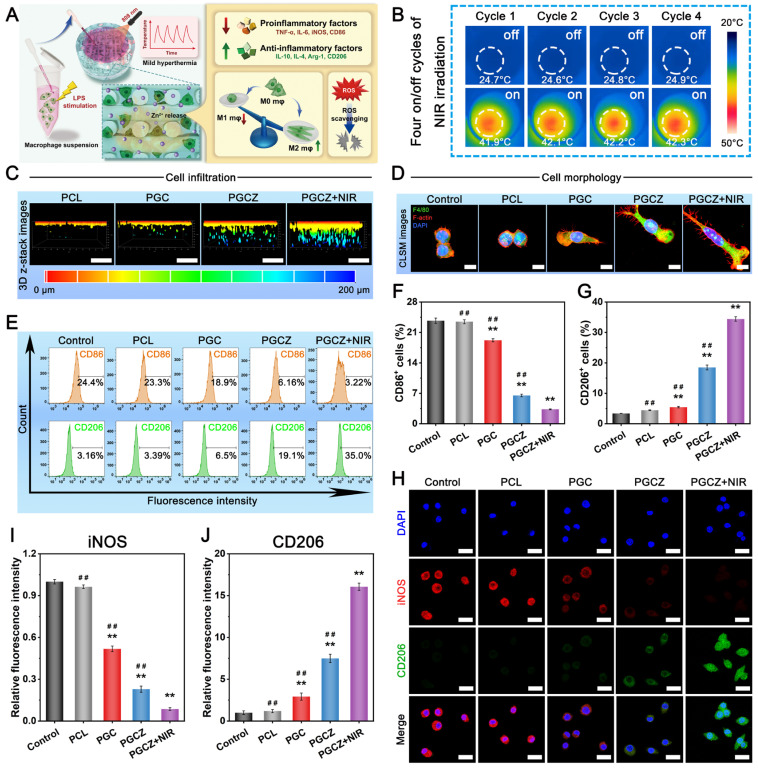
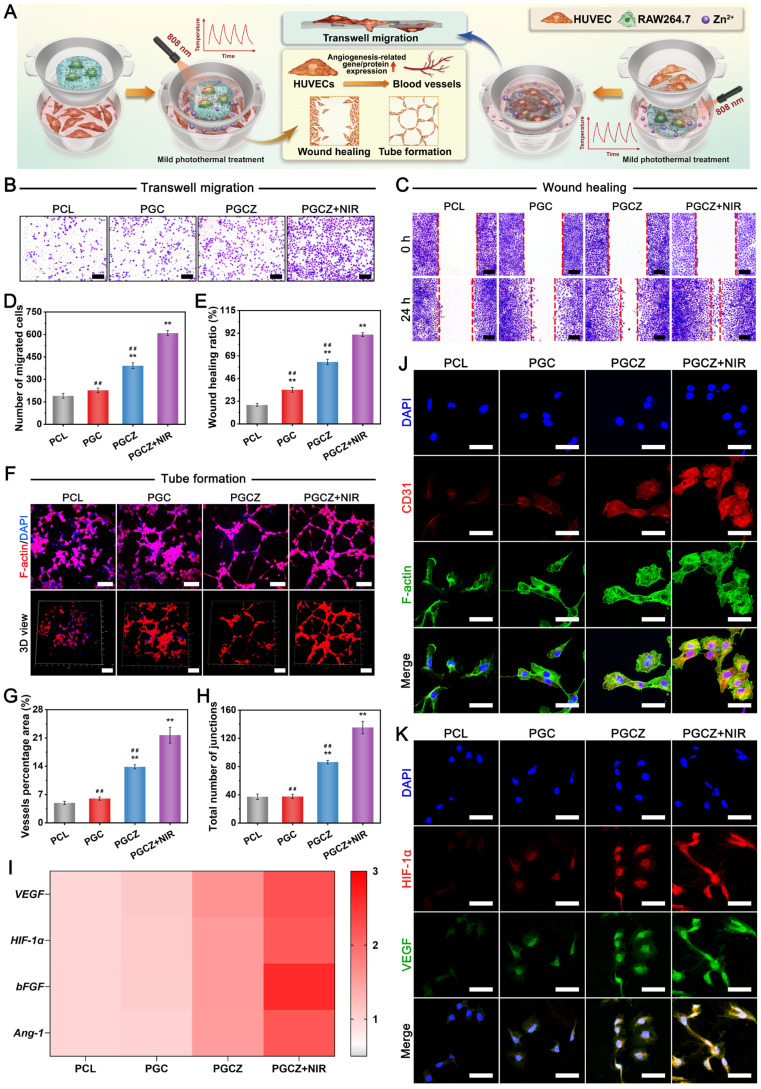
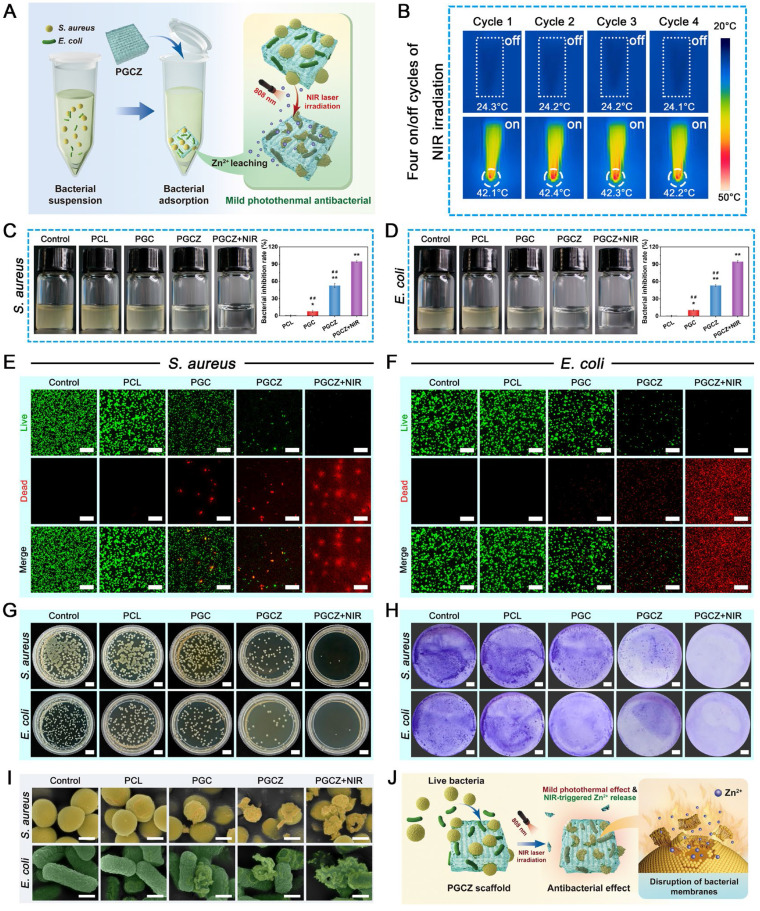
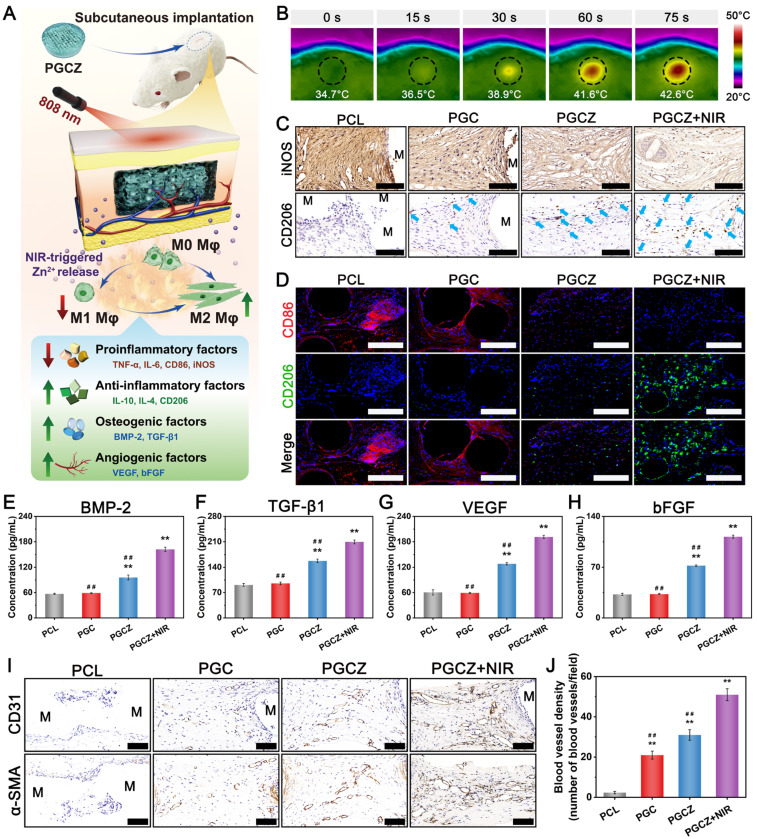
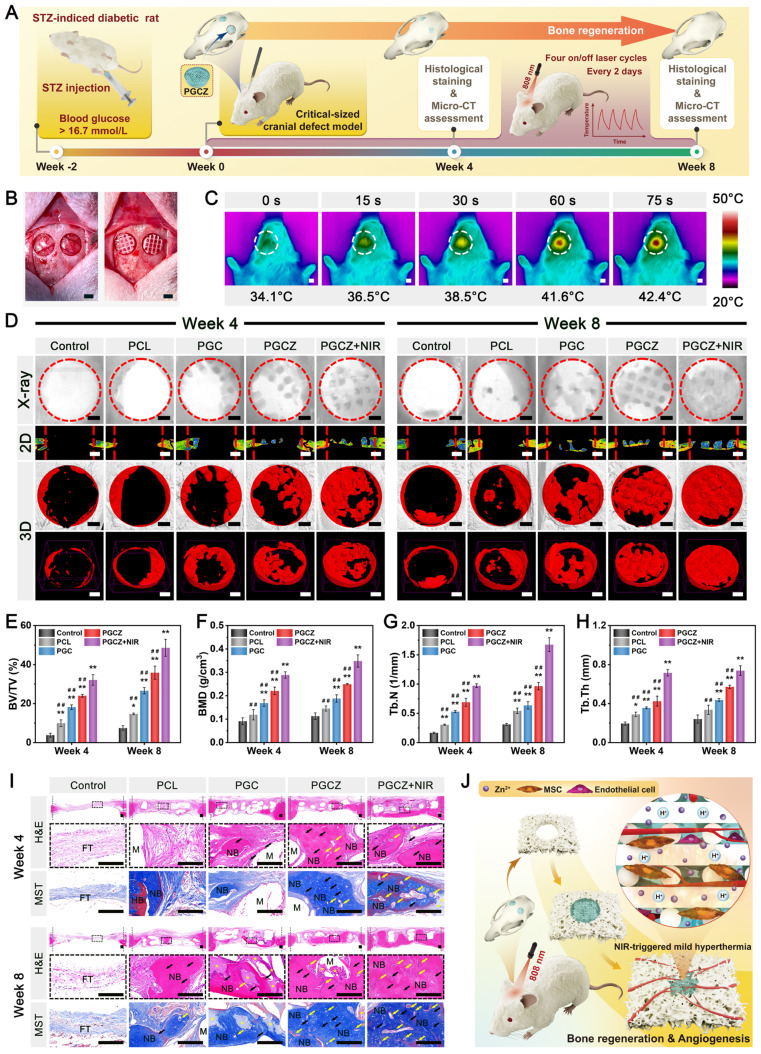
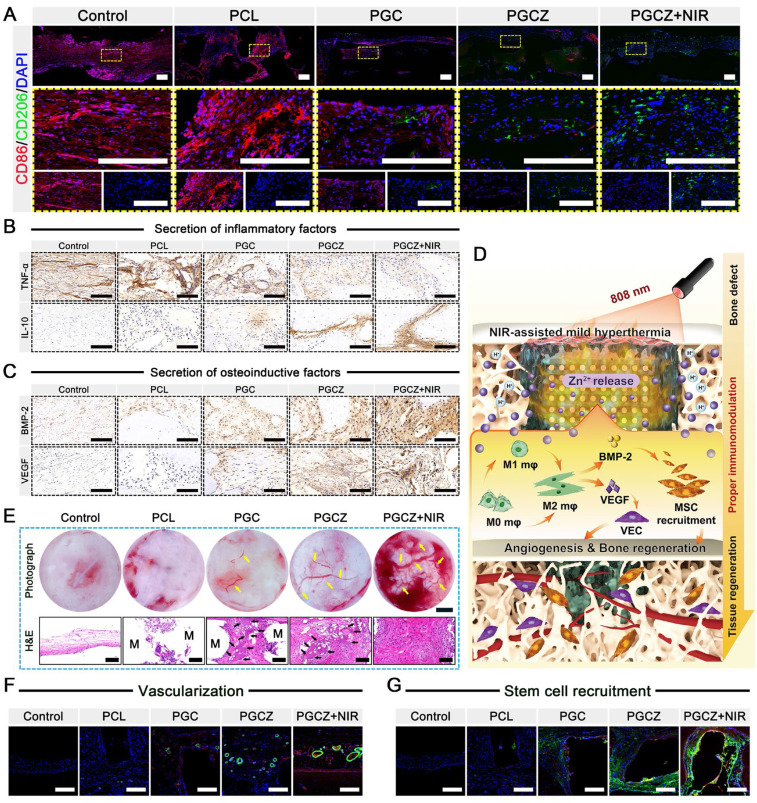
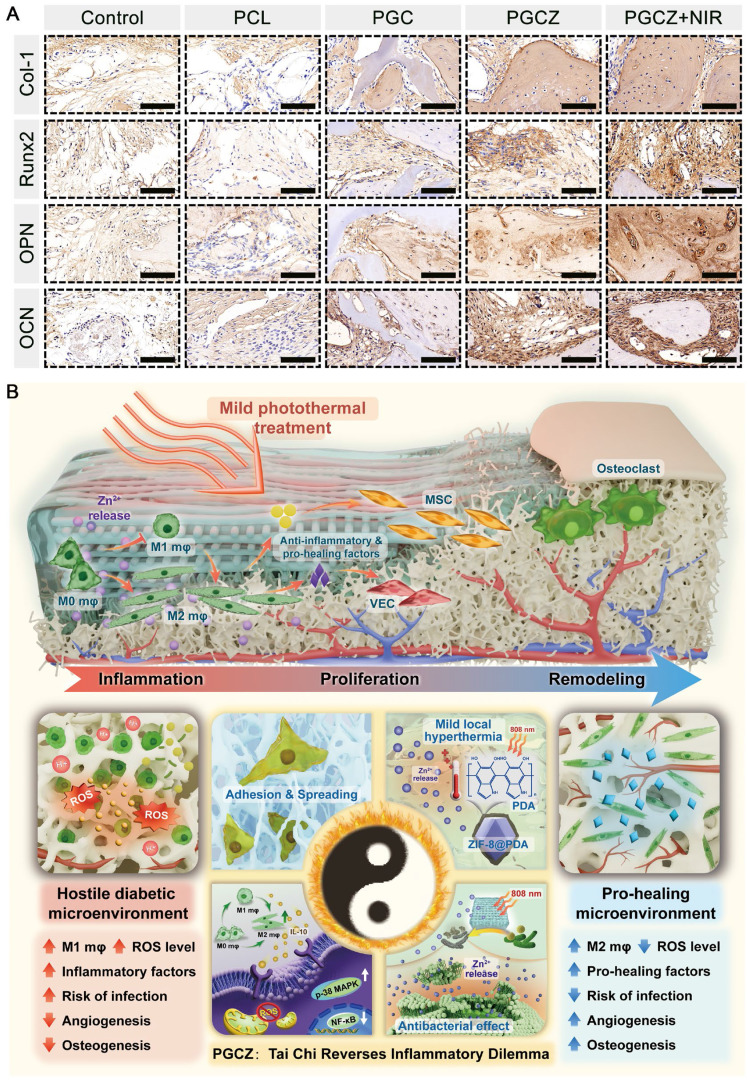
Background: The comprehensive management of diabetic bone defects remains a substantial clinical challenge due to the hostile regenerative microenvironment characterized by aggravated inflammation, excessive reactive oxygen species (ROS), bacterial infection, impaired angiogenesis, and unbalanced bone homeostasis. Thus, an advanced multifunctional therapeutic platform capable of simultaneously achieving immune regulation, bacterial elimination, and tissue regeneration is urgently designed for augmented bone regeneration under diabetic pathological milieu. Methods and Results: Herein, a photoactivated soft-hard combined scaffold system (PGCZ) was engineered by introducing polydopamine-modified zeolitic imidazolate framework-8-loaded double-network hydrogel (soft matrix component) into 3D-printed poly(ε-caprolactone) (PCL) scaffold (hard matrix component). The versatile PGCZ scaffold based on double-network hydrogel and 3D-printed PCL was thus prepared and features highly extracellular matrix-mimicking microstructure, suitable biodegradability and mechanical properties, and excellent photothermal performance, allowing long-term structural stability and mechanical support for bone regeneration. Under periodic near-infrared (NIR) irradiation, the localized photothermal effect of PGCZ triggers the on-demand release of Zn2+, which, together with repeated mild hyperthermia, collectively accelerates the proliferation and osteogenic differentiation of preosteoblasts and potently inhibits bacterial growth and biofilm formation. Additionally, the photoactivated PGCZ system also presents outstanding immunomodulatory and ROS scavenging capacities, which regulate M2 polarization of macrophages and drive functional cytokine secretion, thus leading to a pro-regenerative microenvironment in situ with enhanced vascularization. In vivo experiments further demonstrated that the PGCZ platform in conjunction with mild photothermal therapeutic activity remarkably attenuated the local inflammatory cascade, initiated endogenous stem cell recruitment and neovascularization, and orchestrated the osteoblast/osteoclast balance, ultimately accelerating diabetic bone regeneration. Conclusions: This work highlights the potential application of a photoactivated soft-hard combined system that provides long-term biophysical (mild photothermal stimulation) and biochemical (on-demand ion delivery) cues for accelerated healing of diabetic bone defects.

Keywords: 3D-printed scaffold; angiogenesis; bioactive hydrogel; diabetic bone regeneration; immune microenvironment; mild photothermal stimulation.


Conflict of interest statement

Competing Interests: The authors have declared that no competing interest exists.

Figures

Scheme 1
Scheme 1
Schematic illustration of (A) the synthesis of the PGCZ scaffold with (B) multifunctional properties for (C) potential application in diabetic bone healing and reconstruction through programmed regulation of the regeneration process.
Figure 1
Figure 1
Preparation and characterization of GelMA and ZIF-8@PDA nanoparticles. (A) Schematic illustration of GelMA synthesis. (B) 1H NMR and (C) FTIR of gelatin and GelMA. (D) Schematic illustration of ZIF-8@PDA synthesis and its photothermal properties. (E) Morphological and basic characteristics of the ZIF-8 nanoparticles: Photographs of the nanoparticles (a) before and (b) after dispersion in PBS; (c) SEM image. Scale bar: 300 nm; (d) TEM image. Scale bar: 300 nm; (e) Particle size distribution; (f) Zeta potential. (F) Morphological and basic characteristics of the ZIF-8@PDA nanoparticles: Photographs of the nanoparticles (a) before and (b) after dispersion in PBS; (c) SEM image. Scale bar: 300 nm; (d) TEM image. Scale bar: 300 nm; (e) Particle size distribution; (f) Zeta potential. (G) FTIR spectra, (H) XPS analysis, (I) XRD spectra, and (J) TG diagrams of pure ZIF-8 and ZIF-8@PDA nanoparticles.
Figure 2
Figure 2
Fabrication, characterization, and bioactivity of the prepared GMCS/Z hydrogels. (A) Schematic illustration of the dual-crosslinked polymer network that forms the hybrid hydrogel. (B) Macroscopic view of various hydrogel precursor solutions before and after gelation. (C) SEM images and (D) EDS elemental mapping images of different hydrogels after lyophilization. Scale bar: 200 μm. Cytotoxicity of the GMCS/Z hydrogels in (E) MC3T3-E1 cells and (F) RAW264.7 cells determined by CCK-8 analysis. (G) Apoptosis detection in MC3T3-E1 cells and RAW264.7 cells after different treatments. (H) Live/dead staining images of MC3T3-E1 cells and RAW264.7 cells after different treatments. Scale bar: 100 μm. (I) Schematic diagram of hydrogel implantation for the treatment of critical-sized cranial defects. (J) Micro-CT images of new bone formation in the defect regions at 6 weeks after implantation. Scale bar: 1 mm. Quantitative analysis of (K) BV/TV and (L) BMD based on micro-CT. Data are presented as the mean ± SD (n = 3). *P < 0.05 and **P. < 0.01 indicate significant differences compared with the control group. #P < 0.05 and # #P < 0.01 indicate significant differences compared with the GMCS/Z2 group.
Figure 3
Figure 3
Preparation and characterization of photoactivated PGCZ hybrid scaffolds. (A) Schematic diagram of the PGCZ hybrid scaffold fabrication process. (B) Schematic and morphology of PCL, PGC, and PGCZ hybrid scaffolds. Scale bar: 1 mm (optical images), 1 mm (micro-CT images in PCL), 350 μm (micro-CT images in PGC and PGCZ), and 200 μm (SEM images). (C) Water contact angles of the various scaffolds. (D) Young's modulus, and (E) compressive strength of the various scaffolds. (F) Degradation curves of the various scaffolds. (G) Infrared thermal images and (H) temperature curves of the various scaffolds under NIR laser radiation (808 nm, 1 W/cm2). (I) Release profiles of Zn2+ from the PGCZ scaffold with or without intermittent NIR irradiation (808 nm, 1 W/cm2) at different pH levels. Data are presented as the mean ± SD (n = 3). *P < 0.05 and **P < 0.01 indicate significant differences compared with the PCL group. #P < 0.05 and # #P < 0.01 indicate significant differences compared with the PGCZ group.
Figure 4
Figure 4
In vitro cytocompatibility and osteogenic potential. (A) Schematic illustration of the co-culture system. (B) Infrared thermal images of the cell/scaffold complex during the four on/off cycles of NIR irradiation (1 W/cm2, 808 nm). (C) Live/dead staining images of MC3T3-E1 cells after culturing for 3 days. Scale bar: 200 μm. (D) CCK-8 assay of MC3T3-E1 cells after culturing for 1, 2, and 3 days. (E) Confocal immunofluorescence images of cytoskeleton staining for MC3T3-E1 cells after culturing for 3 days. (green: F4/80; red: F-actin; blue: DAPI). Scale bar: 50 μm. (F) Immunofluorescence staining images of vinculin (green: vinculin; blue: DAPI). Scale bar: 25 μm. (G) 3D reconstructed confocal images of MC3T3-E1 cells after culturing for 3 days. Scale bar: 200 μm. (H) Schematic illustration of the induction of osteogenesis in MC3T3-E1 cells. (I) ALP staining images of different cell/scaffold complexes after 7 days of co-culture. The yellow dotted lines indicate the boundaries of the scaffold struts. Scale bar: 200 μm. (J) ARS staining images of different cell/scaffold complexes after 14 days of co-culture. The yellow dotted lines indicate the boundaries of the scaffold struts. Scale bar: 200 μm. Data are presented as the mean ± SD (n = 3). *P < 0.05 and **P < 0.01 indicate significant differences compared with the PCL group. #P < 0.05 and # #P < 0.01 indicate significant differences compared with the PGCZ+NIR group.
Figure 5
Figure 5
In vitro immunomodulatory performance. (A) Schematic illustration of immunomodulation induced by the photoactivated PGCZ hybrid scaffold. (B) Infrared thermal images of the cell/scaffold complex during the four on/off cycles of NIR irradiation (1 W/cm2, 808 nm). (C) 3D reconstructed confocal images of macrophages after culturing for 3 days. Scale bar: 200 μm. (D) Confocal immunofluorescence images of cytoskeleton staining for macrophages after co-culturing for 3 days. (red: F-actin; blue: DAPI). Scale bar: 5 μm. (E) Flow cytometry analysis and (F-G) corresponding quantification of macrophage phenotypes after co-culturing for 3 days. (H) Immunofluorescence staining images and (I-J) corresponding quantitative analysis of iNOS and CD206 (red: iNOS; green: CD206; blue: DAPI). Scale bar: 20 μm. Data are presented as the mean ± SD (n = 3). *P < 0.05 and **P < 0.01 indicate significant differences compared with the control group. #P < 0.05 and # #P < 0.01 indicate significant differences compared with the PGCZ+NIR group.
Figure 6
Figure 6
In vitro angiogenic potential regulated by macrophage polarization. (A) Schematic illustration of the establishment of in vitro co-culture system and the subsequent induction of vascularization in HUVECs. (B) Crystal violet staining images of HUVECs after treatment and (D) corresponding quantification of migrated cells. Scale bar: 200 μm. (C) Optical images of the scratch wound healing assay for HUVECs after treatment and (E) corresponding quantification of the wound migration rate. Scale bar: 200 μm. (F) Confocal fluorescence images of the tube formation assay for HUVECs and corresponding quantitative analysis, including (G) vessel percentage area and (H) total number of junctions. Scale bar: 200 μm. (I) Relative mRNA expression of angiogenesis-related genes, including VEGF, HIF-1α, bFGF, and Ang-1, in HUVECs. (J) Immunofluorescence staining images of CD31 (red: CD31; green: F-actin; blue: DAPI). Scale bar: 20 μm. (K) Immunofluorescence staining images of HIF-1α and VEGF (red: HIF-1α; green: VEGF; blue: DAPI). Scale bar: 20 μm. Data are presented as the mean ± SD (n = 3). *P < 0.05 and **P < 0.01 indicate significant differences compared with the PCL group. #P < 0.05 and # #P < 0.01 indicate significant differences compared with the PGCZ+NIR group.
Figure 7
Figure 7
In vitro antibacterial activity. (A) Schematic diagram of the antibacterial performance of the photoactivated PGCZ hybrid scaffold. (B) Infrared thermal images of the bacterial/scaffold complex under NIR irradiation (1 W/cm2, 808 nm) for four on/off cycles. Agar plate counting assay of (C) S. aureus and (D) E. coli showing antibacterial potential after different treatments and quantitative analysis of the bacterial inhibition rate. Confocal images of live/dead bacterial staining of (E) S. aureus and (F) E. coli after different treatments. Scale bar: 50 μm. (G) Photographs of S. aureus and E. coli bacterial colonies after different treatments. Scale bar: 1 cm. (H) Crystal violet staining images of S. aureus and E. coli bacterial biofilms after different treatments. Scale bar: 2 mm. (I) SEM images of S. aureus and E. coli after different treatments. Scale bar: 500 nm. (J) Schematic illustration of the antibacterial mechanism of the photoactivated PGCZ scaffold. Data are presented as the mean ± SD (n = 3). *P < 0.05 and **P < 0.01 indicate significant differences compared with the PCL group. #P < 0.05 and # #P < 0.01 indicate significant differences compared with the PGCZ+NIR group.
Figure 8
Figure 8
In vivo immunomodulatory and angiogenic activities in a rat subcutaneous implantation model. (A) Schematic diagram of macrophage polarization and vascularization induced by the photoactivated PGCZ hybrid scaffold. (B) Infrared thermal images of the implantation site under NIR irradiation (1 W/cm2, 808 nm). (C) Immunohistochemical staining images of iNOS and CD206 after 7 days of implantation. The blue arrows indicate CD206-positive cells. Scale bar: 100 μm. (D) Immunofluorescence staining images of CD86 and CD206 (red: CD86; green: CD206; blue: DAPI). Scale bar: 200 μm. (E-H) Secretion of osteogenic (BMP-2 and TGF-β1) and angiogenic (VEGF and bFGF) cytokines induced by the scaffolds in vivo. (I) Immunohistochemical staining images of CD31 and α-SMA and (J) quantitative analysis of the blood vessel density after 2 weeks of implantation. Scale bar: 100 μm. Data are presented as the mean ± SD (n = 3). *P < 0.05 and **P < 0.01 indicate significant differences compared with the PCL group. #P < 0.05 and # #P < 0.01 indicate significant differences compared with the PGCZ+NIR group.
Figure 9
Figure 9
In vivo bone repair in a diabetic rat cranial defect model. (A) Schematic diagram of the in vivo treatment procedure of cranial defect regeneration under diabetic conditions. (B) Establishment of the calvarial defect model in diabetic rats. Scale bar: 2 mm. (C) Infrared thermal images of the implantation site under NIR irradiation (1 W/cm2, 808 nm). Scale bar: 5 mm. (D) X-ray, 2D, and 3D micro-CT images of the newly formed bone in the defect areas at 4 and 8 weeks after implantation. Scale bar: 1 mm. (E-H) Quantitative analysis of bone morphology parameters, including BV/TV, BMD, Tb.N, and Tb.Th. (I) H&E staining and MST staining images of decalcified bone tissue. FT: fibrous tissue. HB: host bone. NB: newly formed bone tissue. M: residual PCL materials. The black arrows represent the bone lacunae. The yellow arrows represent the central canal. The yellow asterisks represent the residual hydrogel materials. Scale bar: 200 μm. (J) Schematic diagram of bone formation and vascularization in the defect areas under diabetic conditions. Data are presented as the mean ± SD (n = 3). *P < 0.05 and **P < 0.01 indicate significant differences compared with the control group. #P < 0.05 and # #P < 0.01 indicate significant differences compared with the PGCZ+NIR group.
Figure 10
Figure 10
In vivo immune regulation, revascularization and endogenous stem cell recruitment during the inflammation and repair stages. (A) Immunofluorescence staining images of CD86 and CD206 (red: CD86; green: CD206; blue: DAPI) after 2 weeks of implantation. Scale bar: 200 μm. (B) Immunohistochemical staining images of TNF-α and IL-10. Scale bar: 100 μm. (C) Immunohistochemical staining images of BMP-2 and VEGF. Scale bar: 100 μm. (D) Schematic illustration of early immunomodulation and tissue regeneration induced by the photoactivated PGCZ hybrid scaffold. (E) H&E staining and macroscopic images of the defect regions after 4 weeks of implantation. Scale bar: 100 μm (H&E staining images) and 1 mm (optical images). The yellow arrows represent the newly formed capillary vessels in the defect areas. The black arrows represent the degradation of the hydrogel phase, accompanied by the infiltration of endogenous cells. (F) Immunofluorescence staining images of CD31 and α-SMA (red: CD31; green: α-SMA; blue: DAPI). Scale bar: 200 μm. (G) Immunofluorescence staining images of CD44 and CD90 (red: CD44; green: CD90; blue: DAPI). Scale bar: 200 μm. Data are presented as the mean ± SD (n = 3). *P < 0.05 and **P < 0.01 indicate significant differences compared with the control group. #P < 0.05 and # #P < 0.01 indicate significant differences compared with the PGCZ+NIR group.
Figure 11
Figure 11
In vivo bone mineralization and resorption during the remodeling stage. (A) Immunohistochemical staining images of Col-1, Runx2, OPN, and OCN. Scale bar: 100 μm. (B) Schematic illustration of the mechanism of the photoactivated PGCZ scaffold for accelerated diabetic bone healing.

Similar articles

Cited by

References

    1. Xiao L, Ma Y, Crawford R, Mendhi J, Zhang Y, Lu H. et al. The interplay between hemostasis and immune response in biomaterial development for osteogenesis. Mater Today (Kidlington) 2022;54:202–24.
    1. Heng BC, Bai Y, Li X, Lim LW, Li W, Ge Z. et al. Electroactive Biomaterials for Facilitating Bone Defect Repair under Pathological Conditions. Adv Sci (Weinh) 2023;10:e2204502. - PMC - PubMed
    1. Wang Y, Lin Q, Zhang H, Wang S, Cui J, Hu Y. et al. M2 macrophage-derived exosomes promote diabetic fracture healing by acting as an immunomodulator. Bioact Mater. 2023;28:273–83. - PMC - PubMed
    1. Lao A, Wu J, Li D, Shen A, Li Y, Zhuang Y. et al. Functionalized Metal-Organic Framework-Modified Hydrogel That Breaks the Vicious Cycle of Inflammation and ROS for Repairing of Diabetic Bone Defects. Small. 2023;19:e2206919. - PubMed
    1. Xu N, Gao Y, Li Z, Chen Y, Liu M, Jia J. et al. Immunoregulatory hydrogel decorated with Tannic acid/Ferric ion accelerates diabetic wound healing via regulating Macrophage polarization. Chem Eng J. 2023;466:143173.

Publication types

LinkOut - more resources