. 2024 May 30;16(11):1-29.
doi: 10.3390/rs16111977.

Expanding the Application of Sentinel-2 Chlorophyll Monitoring across United States Lakes

Affiliations

Expanding the Application of Sentinel-2 Chlorophyll Monitoring across United States Lakes

Wilson B Salls et al. Remote Sens (Basel). .

Abstract

Eutrophication of inland lakes poses various societal and ecological threats, making water quality monitoring crucial. Satellites provide a comprehensive and cost-effective supplement to traditional in situ sampling. The Sentinel-2 MultiSpectral Instrument (S2 MSI) offers unique spectral bands positioned to quantify chlorophyll a, a water-quality and trophic-state indicator, along with fine spatial resolution, enabling the monitoring of small waterbodies. In this study, two algorithms-the Maximum Chlorophyll Index (MCI) and the Normalized Difference Chlorophyll Index (NDCI)-were applied to S2 MSI data. They were calibrated and validated using in situ chlorophyll a measurements for 103 lakes across the contiguous U.S. Both algorithms were tested using top-of-atmosphere reflectances (ρ t), Rayleigh-corrected reflectances (ρ s), and remote sensing reflectances (R rs ). MCI slightly outperformed NDCI across all reflectance products. MCI using ρ t showed the best overall performance, with a mean absolute error factor of 2.08 and a mean bias factor of 1.15. Conversion of derived chlorophyll a to trophic state improved the potential for management applications, with 82% accuracy using a binary classification. We report algorithm-to-chlorophyll-a conversions that show potential for application across the U.S., demonstrating that S2 can serve as a monitoring tool for inland lakes across broad spatial scales.

Keywords: Sentinel-2; chlorophyll a; eutrophication; lakes; remote sensing; water quality monitoring.


Conflict of interest statement

Conflicts of Interest: The authors declare no conflicts of interest. Author N.P. was employed by the company Science Systems and Applications, Inc. Author M.M.C. was employed by the company Global Science & Technology, Inc. The remaining authors declare that the research was conducted in the absence of any commercial or financial relationships that could be construed as a potential conflict of interest. The funders had no role in the design of the study; in the collection, analyses, or interpretation of data; in the writing of the manuscript; or in the decision to publish the results..

Figures

Figure A1.
Figure A1.
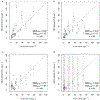
Calibration of MCI using and ρs (a) and RrSΔ (b) and NDCI using ρs (c) and RrSΔ (d), with dotted lines indicating 95% confidence intervals based on bootstrapping distributions.
Figure A2.
Figure A2.
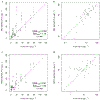
Validation of MCI using ρs (a) and Rrs (b) and NDCI using ρs (c) and Rrs (d), with 95% confidence intervals (extending beyond plot extent in (d)) and dotted line indicating 1:1 relationship.
Figure A3.
Figure A3.
Comparison of in situ chl a values for negative (n = 10) and positive (n = 49) ρt NDCI-derived chl a instances. Dark lines indicate medians, boxes extend from lower to upper quartiles and indicate the interquartile range (IQR), whiskers extend beyond lower and upper quartiles by 1.5 × IQR, and points indicate any values outside 1.5 × IQR.
Figure 1.
Figure 1.
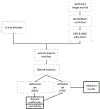
Diagram summarizing process for parameterizing the Sentinel-2 Maximum Chlorophyll Index (MCI) and Normalized Difference Chlorophyll Index (NDCI) and assess their performances.
Figure 2.
Figure 2.
(a) Conceptual depiction of MCI calculation using example relative reflectance. A baseline is established between the baseline bands, a and c, and MCI is measured as the difference between reflectance of the peak band, b, and that baseline. (b) Visual representation of MERIS and S2 bands used to calculate MCI. MCI was originally developed based on MERIS data but is adapted here using the corresponding S2 bands.
Figure 3.
Figure 3.
Map showing locations of calibration (gray) and validation (red) points across CONUS. Points are semi-transparent to show areas of higher density.
Figure 4.
Figure 4.
Calibration of (a) ρt MCI and (b) ρt NDCI, with 95% confidence interval based on bootstrapping distributions.
Figure 5.
Figure 5.
Validation scatterplots showing S2-derived chl a on y-axis and reference in situ chl a on x-axis: (a) ρt MCI in linear space, including 95% confidence intervals and (b) with both axes log-transformed, and (c) ρt NDCI in linear space, including 95% confidence intervals and (d) with both axes log-transformed. Dotted lines indicate 1:1 relationship.
Figure 6.
Figure 6.
Comparison of in situ chl a values for negative (n = 15) and positive (n = 44) ρt MCI-derived chl a instances. Dark lines indicate medians, boxes extend from lower to upper quartiles and indicate the interquartile range (IQR), whiskers extend beyond lower and upper quartiles by 1.5 × IQR, and points indicate any values outside 1.5 × IQR.
Figure 7.
Figure 7.
Map showing direction and magnitude of chl a error (μg L−1) for each point across CONUS, including both calibration and validation matchups. Red indicates overprediction by S2 MCI (positive error); blue indicates underprediction (negative error).
Figure 8.
Figure 8.
Example spectra of MSPM-influenced water (Lake Frederick, Oklahoma), high-chl a water (Dean Lake, Minnesota), and clear water (Lake Saint Croix, Wisconsin). The MSPM-influenced spectral line displays notably higher reflectance in band 4 than in band 6 (negative slope), while the clear and high-chl a waters display nearly uniform reflectance in bands 4 and 6.
Figure 9.
Figure 9.
S2 chl a error (calculated as MCI chl a minus in situ chl a) as a function of MCI baseline slope for ρt. More negative slope values represent a higher likelihood of MSPM contamination, leading to chl a overestimation, and are seen here with increasingly high error. The dotted line at MCI baseline slope = −1.5 × 10⁻⁴ nm−1 indicates the threshold below which samples were removed; points to the left of the dotted line were excluded from all analysis, including calibration and validation.
Figure 10.
Figure 10.
Example applications of the S2 MCI to display chl a (a,b) and trophic state (c,d) in Jordan Lake, NC on 14 May (a,c) and 1 October (b,d), 2018. Pie charts indicate the relative proportions of each trophic state. Data with high MSPM contamination have been removed and are shown as No Data. See Table 2 for chl a ranges equating to each trophic state.

References

    1. Conley DJ; Paerl HW; Howarth RW; Boesch DF; Seitzinger SP; Havens KE; Lancelot C; Likens GE Controlling Eutrophication: Nitrogen and Phosphorus. Science 2009, 323, 1014–1015. - PubMed
    1. Smith VH; Joye SB; Howarth RW Eutrophication of freshwater and marine systems. Limnol. Oceanogr 2006, 51, 351–355.
    1. Mishra P; Naik S; Babu PV; Pradhan U; Begum M; Kaviarasan T; Vashi A; Bandyopadhyay D; Ezhilarasan P; Panda US; et al. Algal bloom, hypoxia, and mass fish kill events in the backwaters of Puducherry, Southeast coast of India. Oceanologia 2022, 64, 396–403.
    1. Sivonen K Cyanobacterial toxins and toxin production. Phycologia 1996, 35, 12–24.
    1. World Health Organization. Guidelines for Safe Recreational Water Environments. Volume 1: Coastal and Fresh Waters; Chapter 8: Algae and Cyanobacteria in Fresh Water; World Health Organization: Geneva, Switzerland, 2003.

LinkOut - more resources