

Identification of disulfidptosis-related clusters and construction of a disulfidptosis-related gene prognostic signature in triple-negative breast cancer
- PMID: 38994057
- PMCID: PMC11238051
- DOI: 10.1016/j.heliyon.2024.e33092
Identification of disulfidptosis-related clusters and construction of a disulfidptosis-related gene prognostic signature in triple-negative breast cancer
Abstract
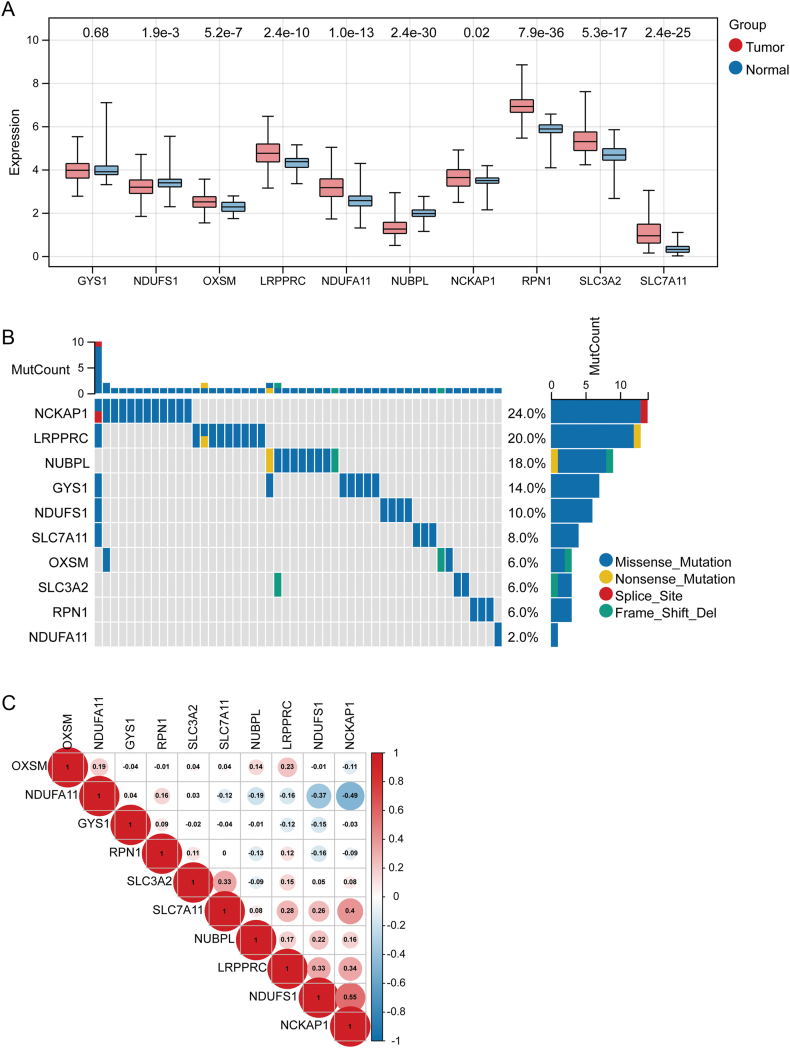
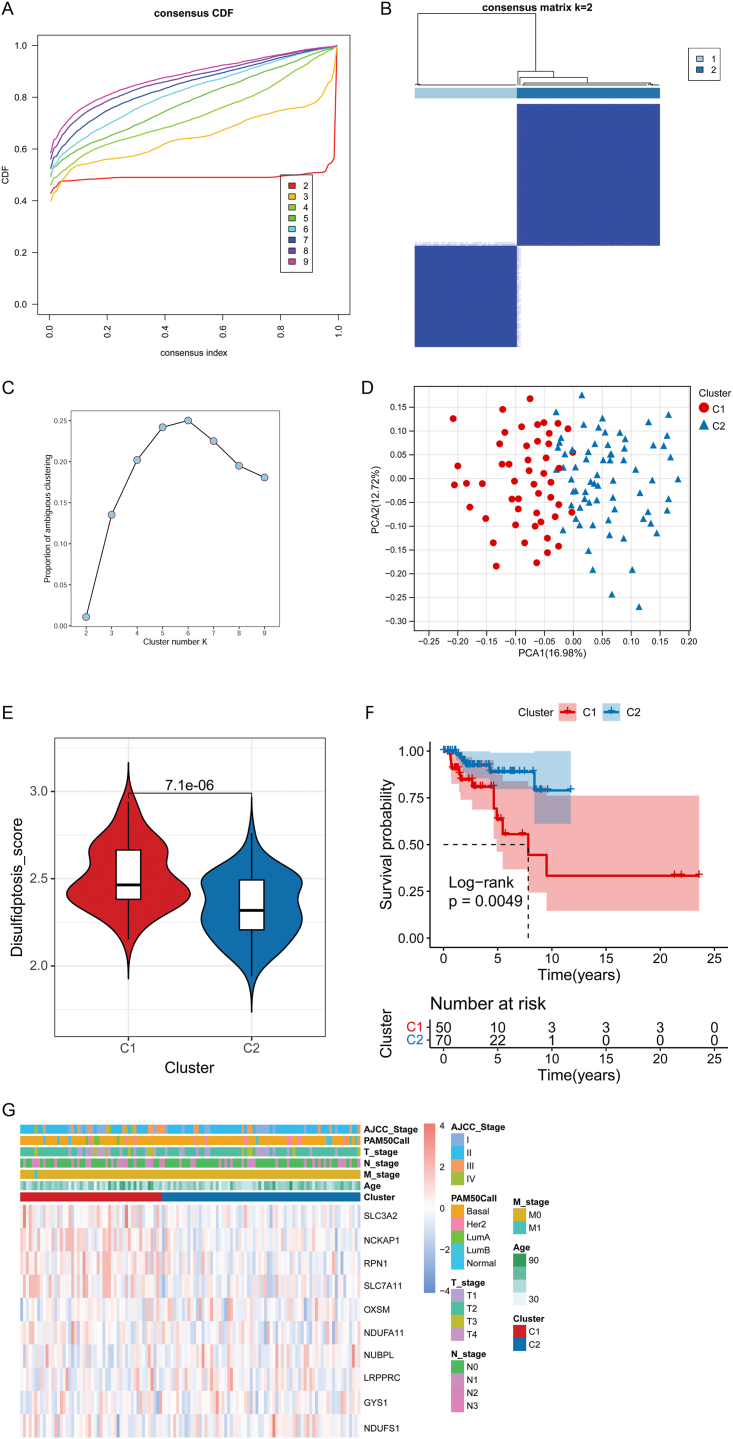
Objective: This study aimed to explore disulfidptosis-related clusters of triple-negative breast cancer (TNBC) and build a reliable disulfidptosis-related gene signature for forecasting TNBC prognosis.
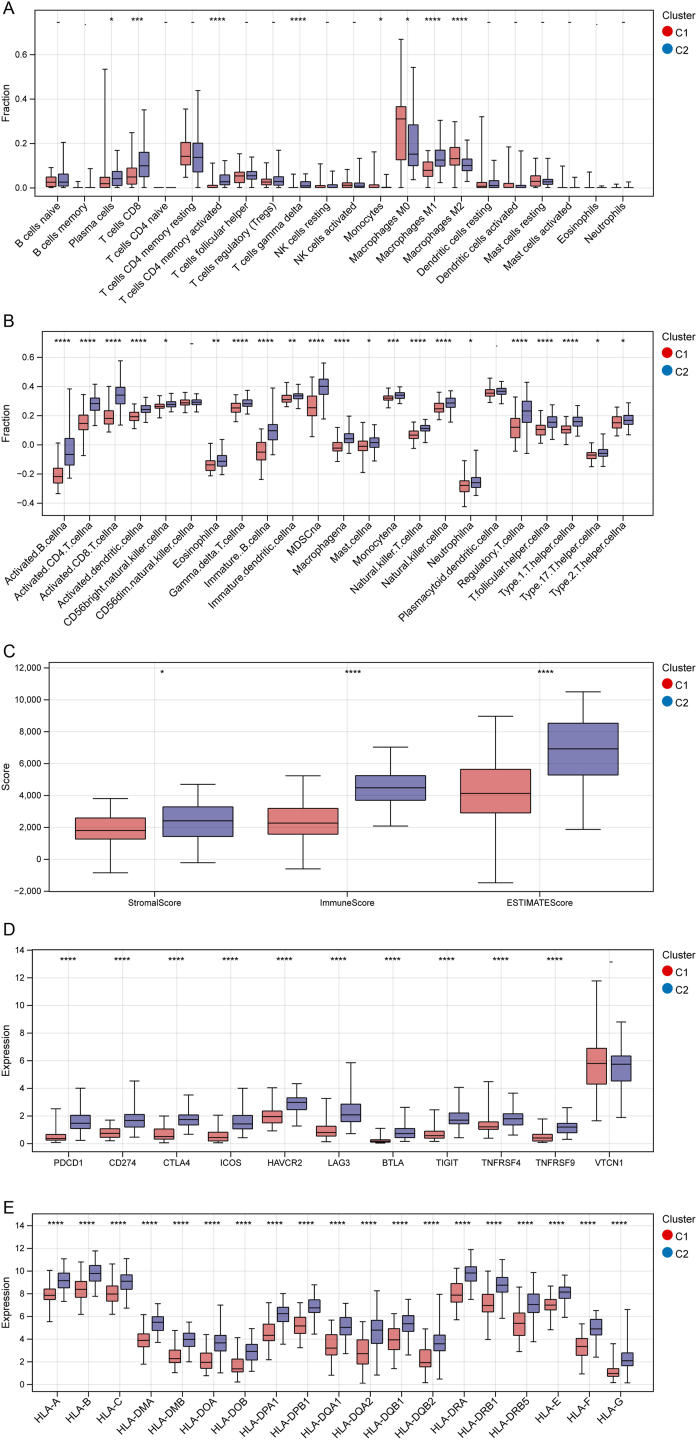
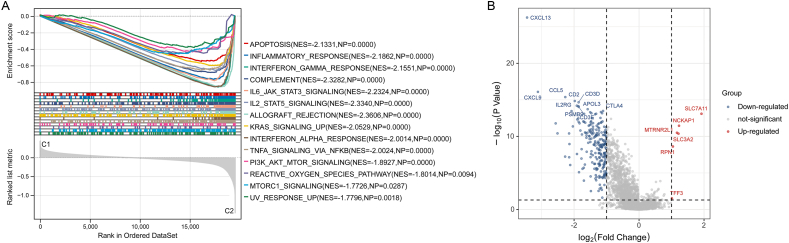
Methods: The disulfidptosis-related clusters of TNBC were identified based on public datasets, and a comparative analysis was conducted to assess their differences in the overall survival (OS) and immune cell infiltration. Morever, the differentially expressed genes (DEGs) between clusters were recognized. Then, the prognostic DEGs were then chosen. A prognostic signature was constructed by the prognostic DEGs, followed by nomogram construction, drug sensitivity, immune correlation, immunotherapy response prediction, and cluster association analyses.
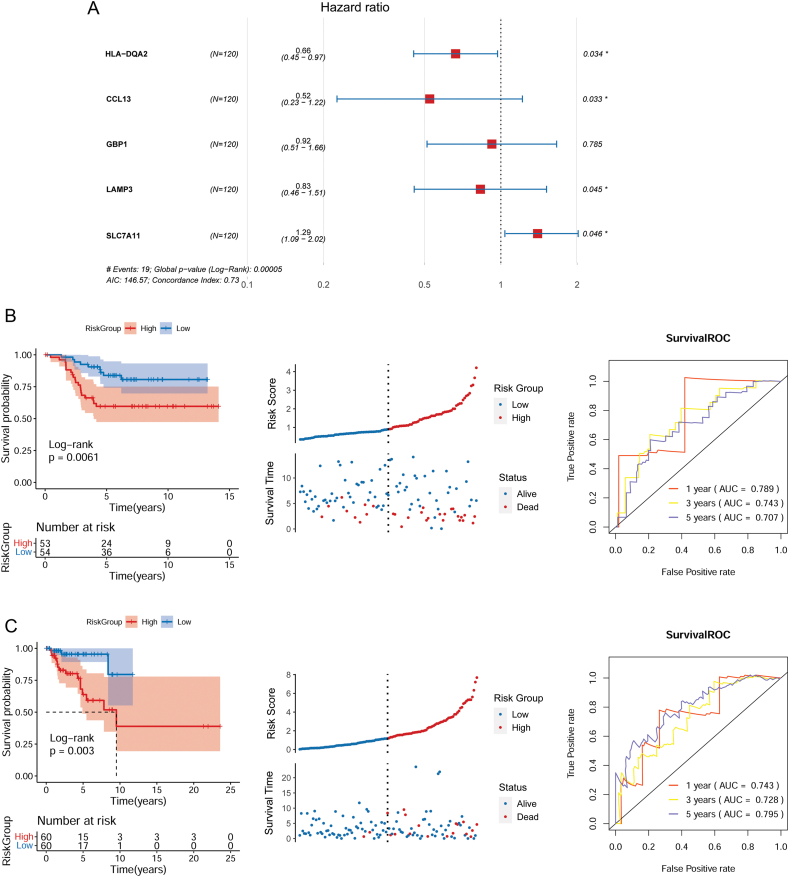
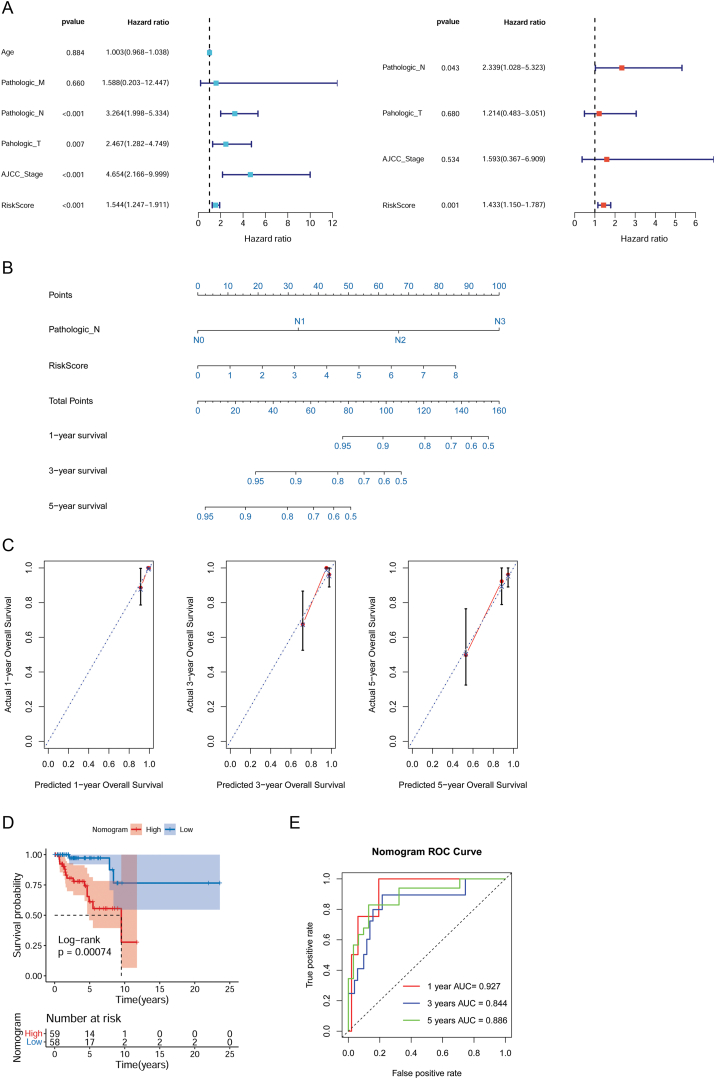
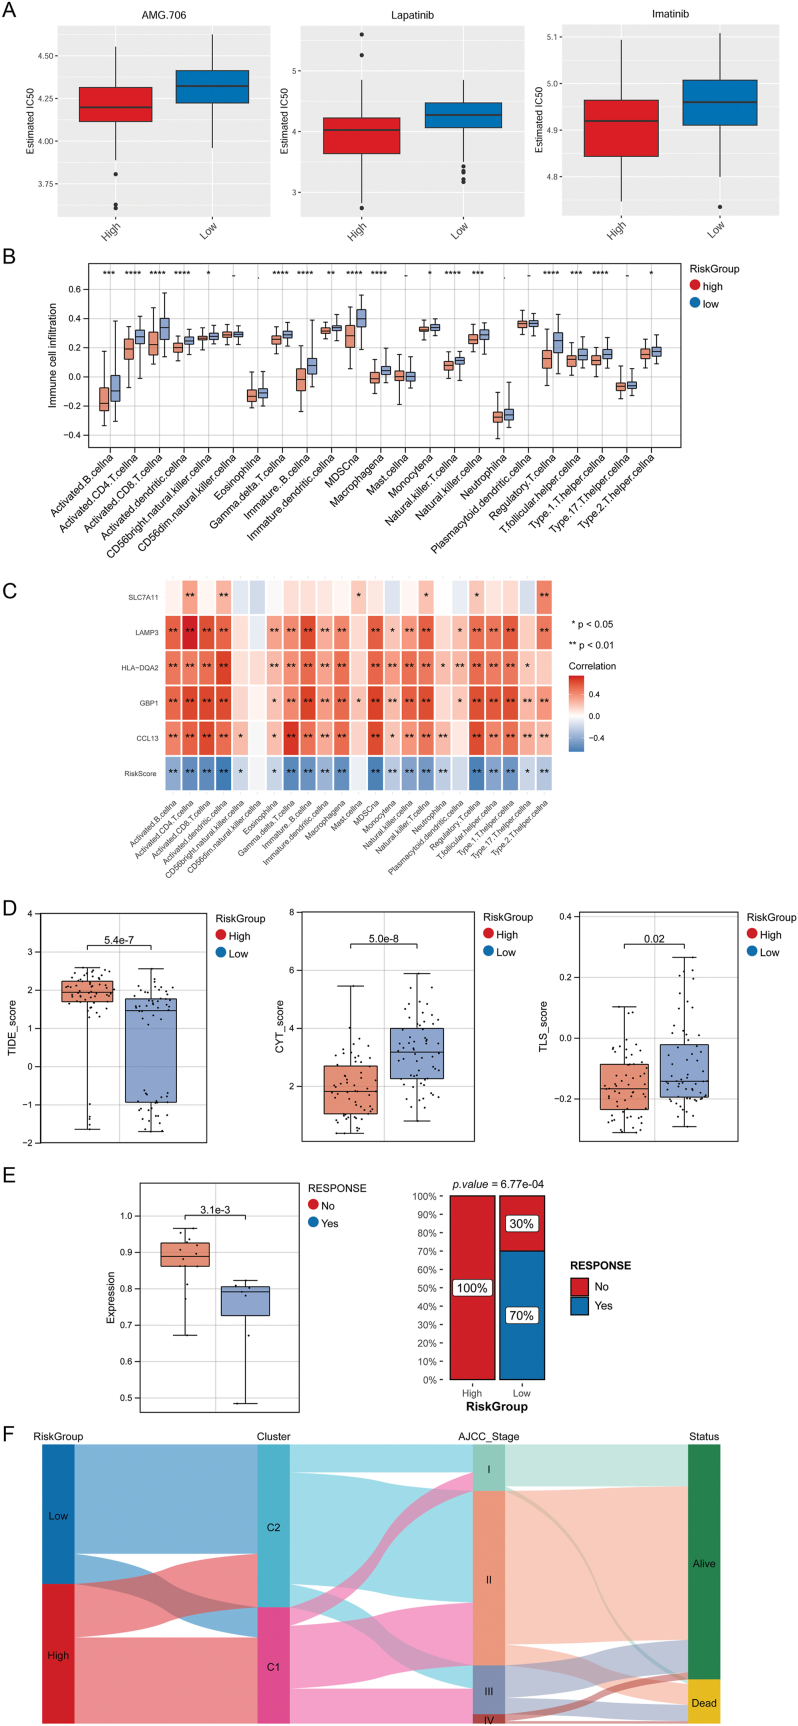
Results: Two disulfidptosis-related clusters of TNBC were identified, which had different OS and macrophage infiltration. Moreover, 235 DEGs were identified between two clusters. A prognostic signature was then constructed by five prognostic DEGs including HLA-DQA2, CCL13, GBP1, LAMP3, and SLC7A11. This signature was highly valuable in predicting prognosis. A nomogram was built by risk score and AJCC stage, which could forecast OS accurately. Moreover, patients with high-risk scores exhibited greater sensitivity to chemotherapy drugs such as lapatinib and had a lower immunotherapy response.
Conclusions: Two TNBC clusters linked to disulfidptosis were identified, with different OS and immune cell infiltration. Moreover, a five-disulfidptosis-related gene signature may be a powerful prognostic biomarker for TNBC.
Keywords: Disulfidptosis; Gene prognostic signature; Immunotherapy; Nomogram.
© 2024 The Authors.
Conflict of interest statement
The authors declare that they have no known competing financial interests or personal relationships that could have appeared to influence the work reported in this paper.
Figures
Similar articles
-
A novel disulfidptosis-associated expression pattern in breast cancer based on machine learning.Front Genet. 2023 Jun 29;14:1193944. doi: 10.3389/fgene.2023.1193944. eCollection 2023. Front Genet. 2023. PMID: 37456667 Free PMC article.
-
Bioinformatics-based analysis of the relationship between disulfidptosis and prognosis and treatment response in pancreatic cancer.Sci Rep. 2023 Dec 14;13(1):22218. doi: 10.1038/s41598-023-49752-4. Sci Rep. 2023. PMID: 38097783 Free PMC article. Clinical Trial.
-
Signature Construction and Disulfidptosis-Related Molecular Cluster Identification for Better Prediction of Prognosis in Glioma.J Mol Neurosci. 2024 Apr 4;74(2):38. doi: 10.1007/s12031-024-02216-4. J Mol Neurosci. 2024. PMID: 38573391
-
Crosstalk of disulfidptosis-related subtypes, establishment of a prognostic signature and immune infiltration characteristics in bladder cancer based on a machine learning survival framework.Front Endocrinol (Lausanne). 2023 Apr 19;14:1180404. doi: 10.3389/fendo.2023.1180404. eCollection 2023. Front Endocrinol (Lausanne). 2023. PMID: 37152941 Free PMC article.
-
Construction of a novel disulfidptosis-related signature for improving outcomes in hepatocellular carcinoma: Observational study.Medicine (Baltimore). 2023 Oct 6;102(40):e35423. doi: 10.1097/MD.0000000000035423. Medicine (Baltimore). 2023. PMID: 37800779 Free PMC article.
Cited by
-
Identification of Molecular Subtypes and Prognostic Features for Triple-Negative Breast Cancer Based on Golgi Apparatus-Related Gene Signature.Oncol Res. 2025 Jul 18;33(8):2013-2035. doi: 10.32604/or.2025.061757. eCollection 2025. Oncol Res. 2025. PMID: 40746884 Free PMC article.
References
LinkOut - more resources
Full Text Sources
Research Materials
