

Transcriptomic and proteomic investigations identify PI3K-akt pathway targets for hyperthyroidism management in rats via polar iridoids from radix Scrophularia
- PMID: 38994059
- PMCID: PMC11238048
- DOI: 10.1016/j.heliyon.2024.e33072
Transcriptomic and proteomic investigations identify PI3K-akt pathway targets for hyperthyroidism management in rats via polar iridoids from radix Scrophularia
Abstract
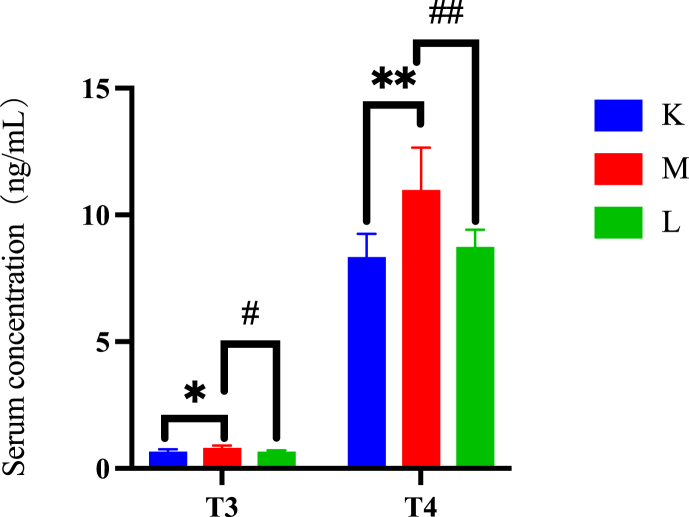
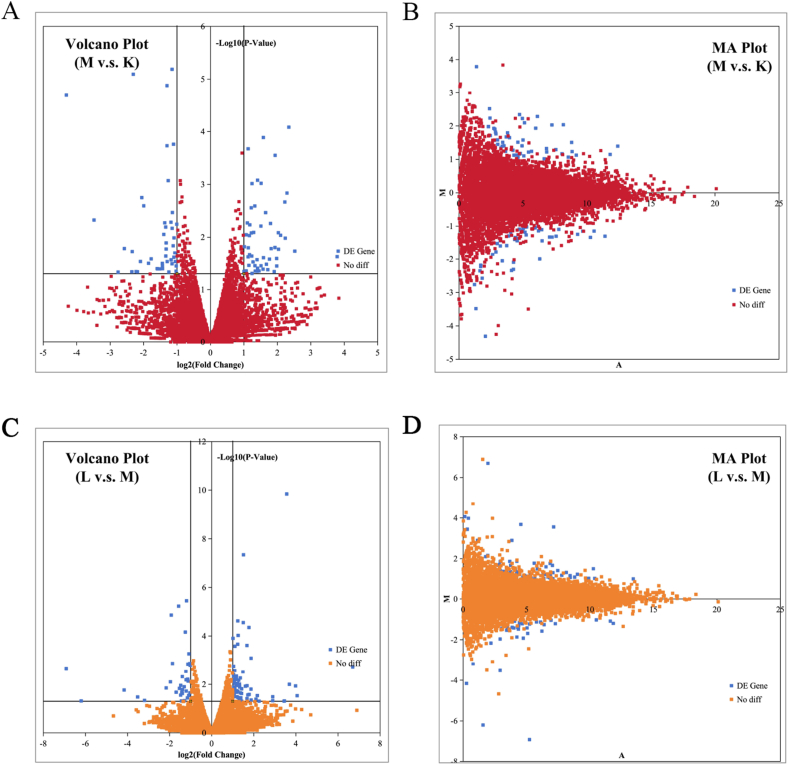
High-polarity iridoids from Radix Scrophulariae (R. Scrophulariae) offer a range of benefits, including anti-inflammatory, antioxidant, antitumour, antibacterial, antiviral, and antiallergic effects. Although previous studies have indicated the potential of R. Scrophulariae for hyperthyroidism prevention and treatment, the specific active compounds involved and their mechanisms of action are not fully understood. This study explored the effects of high-polarity iridoid glycosides from R. Scrophulariae on hyperthyroidism induced in rats by levothyroxine sodium. The experimental design included a control group, a hyperthyroidism model group, and a group treated with iridoid glycosides. Serum triiodothyronine (T3) and thyroxine (T4) levels were quantified using an enzyme-linked immunosorbent assay (ELISA). Transcriptomic and proteomic analyses were applied to liver samples to identify differentially expressed genes and proteins. These analyses were complemented by trend analysis and Kyoto Encyclopedia of Genes and Genomes (KEGG) enrichment analysis. The effectiveness of key factors was further examined through molecular biology techniques. ELISA results indicated a notable increase in T3 and T4 in the hyperthyroid rats, which was significantly mitigated by treatment with iridoid glycosides. Transcriptomic analysis revealed 6 upregulated and 6 downregulated genes in the model group, showing marked improvement following treatment. Proteomic analysis revealed changes in 30 upregulated and 50 downregulated proteins, with improvements observed upon treatment. The PI3K-Akt signalling pathway was investigated through KEGG enrichment analysis. Molecular biology methods verified the upregulation of Spp1, Thbs1, PI3K, and Akt in the model group, which was reversed in the treatment group. This study revealed that highly polar iridoids from R. Scrophulariae can modulate the Spp1 gene and Thbs1 protein via the PI3K-Akt signalling pathway, suggesting a therapeutic benefit for hyperthyroidism and providing a basis for drug development targeting this condition.
Keywords: Highly polar iridoids from radix scrophulariae; Hyperthyroidism; PI3K-Akt signaling pathway; Proteomics; Transcriptomics.
© 2024 The Authors. Published by Elsevier Ltd.
Conflict of interest statement
The authors declare that they have no known competing financial interests or personal relationships that could have appeared to influence the work reported in this paper.
Figures


Similar articles
-
Effective substances and molecular mechanisms guided by network pharmacology: An example study of Scrophulariae Radix treatment of hyperthyroidism and thyroid hormone-induced liver and kidney injuries.J Ethnopharmacol. 2024 May 23;326:117965. doi: 10.1016/j.jep.2024.117965. Epub 2024 Feb 28. J Ethnopharmacol. 2024. PMID: 38423410
-
Effects of Radix Scrophulariae on Hyperthyroidism Assessed by Metabonomics and Network Pharmacology.Front Pharmacol. 2021 Sep 28;12:727735. doi: 10.3389/fphar.2021.727735. eCollection 2021. Front Pharmacol. 2021. PMID: 34650432 Free PMC article.
-
Radix Scrophulariae Extracts Exert Effect on Hyperthyroidism via MST1/Hippo Signaling Pathway.Chin J Integr Med. 2023 Nov;29(11):998-1006. doi: 10.1007/s11655-023-3744-7. Epub 2023 Sep 4. Chin J Integr Med. 2023. PMID: 37661231
-
Elucidating the mechanism of action of Radix Angelica sinensis (Oliv.) Diels and Radix Astragalus mongholicus Bunge ultrafiltration extract on radiation-induced myocardial fibrosis based on network pharmacology and experimental research.Eur J Pharm Sci. 2024 Aug 1;199:106794. doi: 10.1016/j.ejps.2024.106794. Epub 2024 May 22. Eur J Pharm Sci. 2024. PMID: 38788908
-
[Chemical constituents, pharmacological activities, processing and clinical application of traditional Chinese medicine Scrophulariae Radix: a review].Zhongguo Zhong Yao Za Zhi. 2023 Aug;48(16):4302-4319. doi: 10.19540/j.cnki.cjcmm.20230123.201. Zhongguo Zhong Yao Za Zhi. 2023. PMID: 37802857 Review. Chinese.
References
-
- Wiersinga W.M., Poppe K.G., Effraimidis G. Hyperthyroidism: aetiology, pathogenesis, diagnosis, management, complications, and prognosis. Lancet Diabetes Endocrinol. 2023;11(4):282–298. - PubMed
-
- Vaidyanathan P. Update on pediatric hyperthyroidism. Adv. Pediatr. 2022;69(1):219–229. - PubMed
-
- Kobaly K., Mandel S.J. Hyperthyroidism and pregnancy. Endocrinol Metab. Clin. N. Am. 2019;48(3):533–545. - PubMed
-
- Commission C.P. The Medicine Science and Technology Press of China; 2020. Pharmacopoeia of the People's republic of china(Part 1) p. 121.
LinkOut - more resources
Full Text Sources
Research Materials
Miscellaneous
