. 2024 Jun 26:15:1384361.
doi: 10.3389/fimmu.2024.1384361. eCollection 2024.

Gravidity influences distinct transcriptional profiles of maternal and fetal placental macrophages at term

Affiliations

Gravidity influences distinct transcriptional profiles of maternal and fetal placental macrophages at term

Nida Ozarslan et al. Front Immunol. .

Abstract

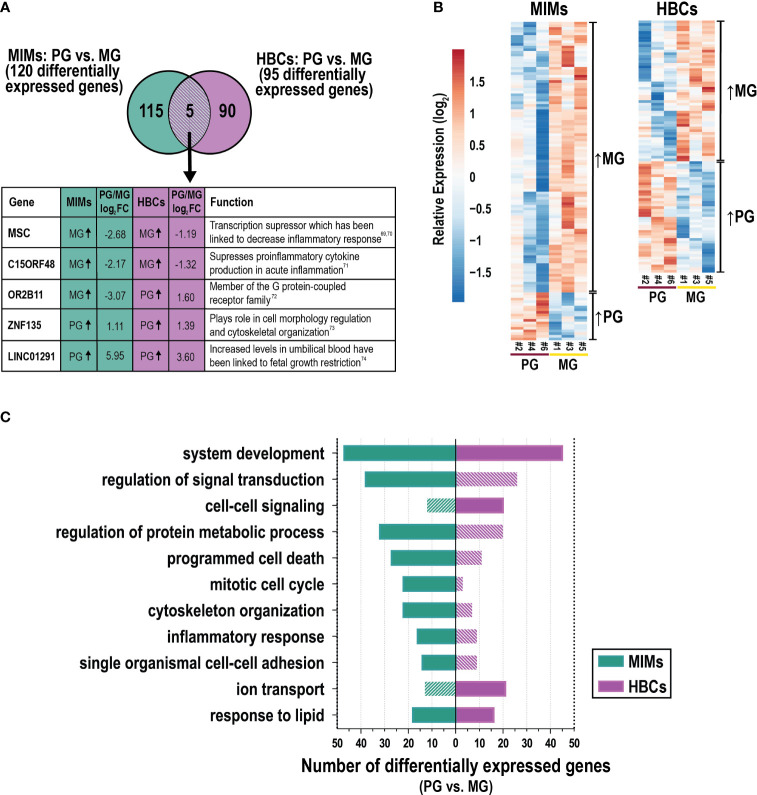
Introduction: Maternal intervillous monocytes (MIMs) and fetal Hofbauer cells (HBCs) are myeloid-derived immune cells at the maternal-fetal interface. Maternal reproductive history is associated with differential risk of pregnancy complications. The molecular phenotypes and roles of these distinct monocyte/macrophage populations and the influence of gravidity on these phenotypes has not been systematically investigated.

Methods: Here, we used RNA sequencing to study the transcriptional profiles of MIMs and HBCs in normal term pregnancies.

Results: Our analyses revealed distinct transcriptomes of MIMs and HBCs. Genes involved in differentiation and cell organization pathways were more highly expressed in MIMs vs. HBCs. In contrast, HBCs had higher expression of genes involved in inflammatory responses and cell surface receptor signaling. Maternal gravidity influenced monocyte programming, as expression of pro-inflammatory molecules was significantly higher in MIMs from multigravidae compared to primigravidae. In HBCs, multigravidae displayed enrichment of gene pathways involved in cell-cell signaling and differentiation.

Discussion: Our results demonstrated that MIMs and HBCs have highly divergent transcriptional signatures, reflecting their distinct origins, locations, functions, and roles in inflammatory responses. Furthermore, maternal gravidity influences the gene signatures of MIMs and HBCs, potentially modulating the interplay between tolerance and trained immunity. The phenomenon of reproductive immune memory may play a novel role in the differential susceptibility of primigravidae to pregnancy complications.

Keywords: Hofbauer cell; RNA-Seq; gravidity; monocyte; myeloid cells; placenta; pregnancy; transcriptomics.


Conflict of interest statement

The authors declare that the research was conducted in the absence of any commercial or financial relationships that could be construed as a potential conflict of interest.

Figures

Figure 1
Figure 1
Anatomical localization of maternal intervillous monocytes (MIMs) and fetal Hofbauer cells (HBCs) within the placenta. MIMs and HBCs reside in unique placental compartments within close proximity. HBCs originate from the fetal yolk sac and reside in the chorionic villi (encircled with dashed lines). MIMs are derived from the maternal bone marrow and, ultimately, enter the placenta via the maternal spiral arteries that provide oxygenated blood to the intervillous space. MIMs and HBCs highly express CD68+ (brown) in histological cross-sections of the chorionic villi and intervillous space. CTB, cytotrophoblast; CV, chorionic villi; FB, fibroblast; fEC, fetal endothelial cell; fRBC, fetal red blood cell; HBC, Hofbauer cell; IVS, intervillous space; MIM, maternal intervillous monocyte; STB, syncytiotrophoblast. Created with BioRender.com.
Figure 2
Figure 2
Differentially expressed genes between MIMs and HBCs. (A) Distribution of average gene counts [log2 normalized counts per million (CPM)] in MIMs and HBCs. (B) Cell/tissue enrichment of the most abundant genes in each cell type (top 2%, dashed line in panel A). (C) Multidimensional scaling plot of MIM (teal squares) and HBC (purple circles) transcriptomes. Paired MIMs and HBCs denoted by sample IDs. (D) Volcano plot displaying significance (negative log p-value) and fold difference in expression (log2). Red dots signify differentially expressed genes between the two cell populations (p<0.00001; absolute FC > 4). Genes labeled in blue were validated via qRT-PCR. (E) Hierarchical clustering plot displaying absolute mRNA expression of differentially expressed genes. Expression of the top 25 most up- (F) or down- (G) regulated genes in terms of fold change (FC) in HBCs vs. MIMs.
Figure 3
Figure 3
mRNA validation of differentially expressed genes between MIMs and HBCs. (A) Relative expression of genes identified to be differentially expressed between HBCs (purple circle) and MIMs (teal circle) via qRT-PCR. Expression values (ΔΔCT) were normalized to housekeeping genes (GAPDH, ACTB) and adjusted by the average MIM expression. Asterisks indicate significant differences between MIMs and HBCs (***p<0.0005; **p<0.005; *p<0.05). Bars reflect mean and standard error (SE). (B) Correlation plot between RNA-seq and qRT-PCR expression levels of HBC/MIM fold change values in log2 format. Regression line signifies relationship between fold change differences of MIMs and HBCs quantified via RNA-seq vs. qRT-PCR (slope = 1095; R2 = 0.8541).
Figure 4
Figure 4
Functional enrichment analysis of differentially expressed genes between MIMs and HBCs. (A) Selected enriched biological processes (criteria: p<0.01, number of differentially expressed genes associated with enriched term ≥ 10) and the number of differentially expressed genes with higher expression in MIMs or HBCs in each category. (B) Hierarchical clustering of differentially expressed genes associated with inflammatory response pathway (GO:0006954). (C) Relative expression of M1/M2 markers in HBCs vs. MIMs. A panel of 31 genes associated with pro- (M1) and anti- (M2) inflammatory activation states were identified based on current literature. Out of this panel, 15 genes were differentially expressed between MIMs and HBCs (average log2count > 0, p<0.01 and absolute log2FC > 1).
Figure 5
Figure 5
The influence of gravidity on gene expression in MIMs and HBCs. (A) Genes identified to be differentially expressed due to gravidity [primigravida (PG) or multigravida (MG) placentas] in the two cell types (p<0.05; absolute FC > 2). Five differentially expressed genes in common between MIMs and HBCs due to gravidity are shown in the box with their previously described functions (–74). (B) Relative expression (based on average expression of primigravidae) of genes significantly influenced by gravidity in MIMs or HBCs. Hierarchical clustering denotes genes higher in multigravidae vs. primigravidae or vice versa in each cell type. (C) Select enriched biological processes associated with gravidity in MIMs or HBCs (p<0.01; number of differentially expressed genes ≥6 in any cell type). Filled bars indicate significance (p<0.01). Hatched bars indicate non-significance.

Update of

References

    1. Erlebacher A, Fisher SJ. Baby’s first organ. Sci Am. (2017) 317:46–53. doi: 10.1038/scientificamerican1017-46 - DOI - PubMed
    1. Labarrere CA, DiCarlo HL, Bammerlin E, Hardin JW, Kim YM, Chaemsaithong P, et al. . Failure of physiologic transformation of spiral arteries, endothelial and trophoblast cell activation, and acute atherosis in the basal plate of the placenta. Am J Obstet Gynecol. (2017) 216:287.e1–287.e16. doi: 10.1016/j.ajog.2016.12.029 - DOI - PMC - PubMed
    1. Gomez-Lopez N, Guilbert LJ, Olson DM. Invasion of the leukocytes into the fetal-maternal interface during pregnancy. J Leukoc Biol. (2010) 88:625–33. doi: 10.1189/jlb.1209796 - DOI - PubMed
    1. Toothaker JM, Olaloye O, McCourt BT, McCourt CC, Silva TN, Case RM, et al. . Immune landscape of human placental villi using single-cell analysis. Development. (2022) 149:dev200013. doi: 10.1242/dev.200013 - DOI - PMC - PubMed
    1. Care AS, Diener KR, Jasper MJ, Brown HM, Ingman WV, Robertson SA. Macrophages regulate corpus luteum development during embryo implantation in mice. J Clin Invest. (2013) 123:3472–87. doi: 10.1172/JCI60561 - DOI - PMC - PubMed