. 2024 Jun 27:15:1389674.
doi: 10.3389/fimmu.2024.1389674. eCollection 2024.

Professional phagocytes are recruited for the clearance of obsolete nonprofessional phagocytes in the Drosophila ovary

Affiliations

Professional phagocytes are recruited for the clearance of obsolete nonprofessional phagocytes in the Drosophila ovary

Alexandra Y Chasse et al. Front Immunol. .

Abstract

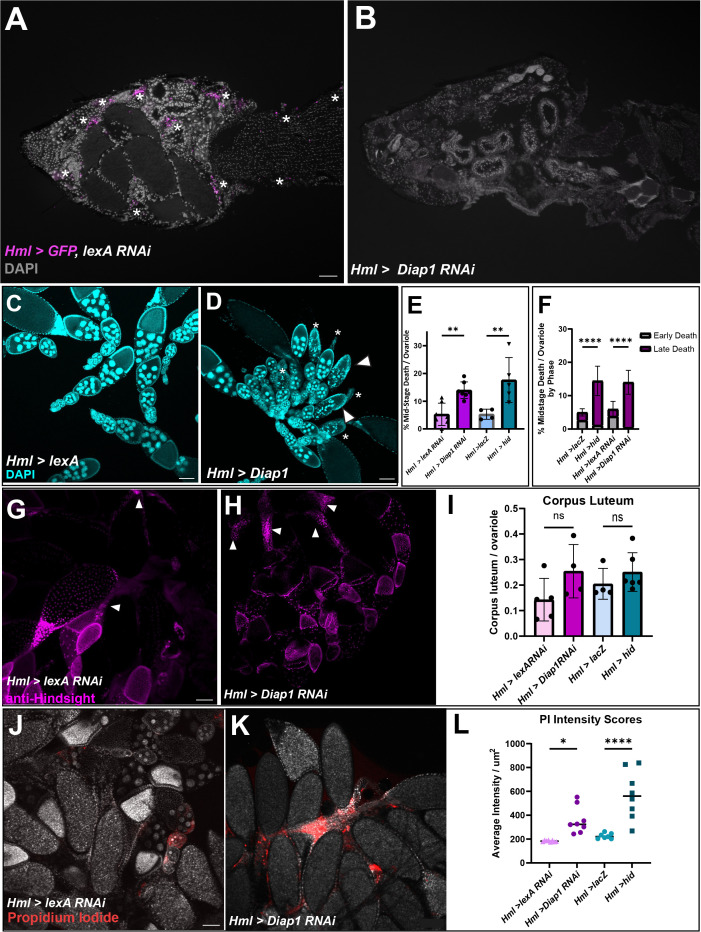
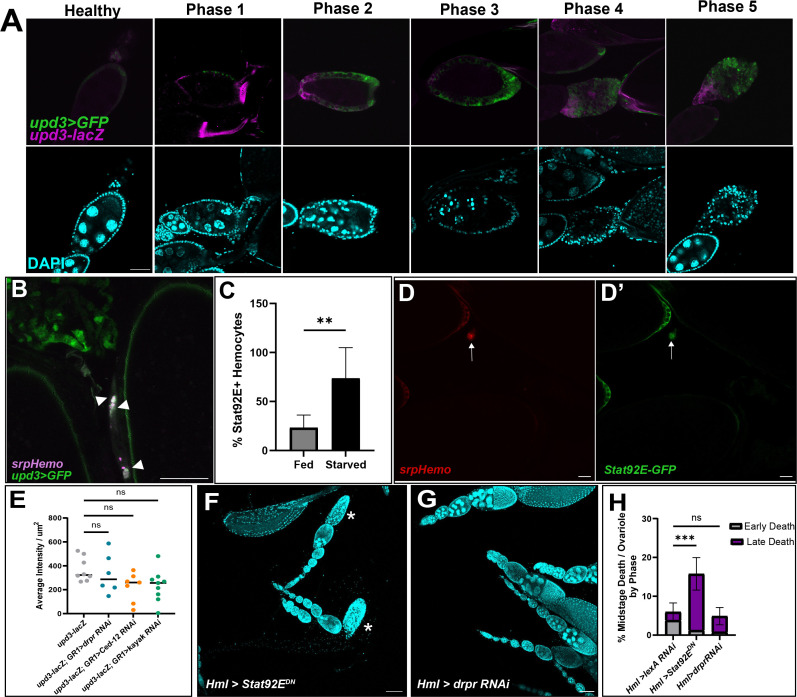
Cell death is an important process in the body, as it occurs throughout every tissue during development, disease, and tissue regeneration. Phagocytes are responsible for clearing away dying cells and are typically characterized as either professional or nonprofessional phagocytes. Professional phagocytes, such as macrophages, are found in nearly every part of the body while nonprofessional phagocytes, such as epithelial cells, are found in every tissue type. However, there are organs that are considered "immune-privileged" as they have little to no immune surveillance and rely on nonprofessional phagocytes to engulf dying cells. These organs are surrounded by barriers to protect the tissue from viruses, bacteria, and perhaps even immune cells. The Drosophila ovary is considered immune-privileged, however the presence of hemocytes, the macrophages of Drosophila, around the ovary suggests they may have a potential function. Here we analyze hemocyte localization and potential functions in response to starvation-induced cell death in the ovary. Hemocytes were found to accumulate in the oviduct in the vicinity of mature eggs and follicle cell debris. Genetic ablation of hemocytes revealed that the presence of hemocytes affects oogenesis and that they phagocytose ovarian cell debris and in their absence fecundity decreases. Unpaired3, an IL-6 like cytokine, was found to be required for the recruitment of hemocytes to the oviduct to clear away obsolete follicle cells. These findings demonstrate a role for hemocytes in the ovary, providing a more thorough understanding of phagocyte communication and cell clearance in a previously thought immune-privileged organ.

Keywords: Unpaired3; cell death; follicle; hemocyte; immune-privileged; nonprofessional phagocyte; ovary; phagocytosis.


Conflict of interest statement

The authors declare that the research was conducted in the absence of any commercial or financial relationships that could be construed as a potential conflict of interest.

Figures

Figure 1
Figure 1
The fate of follicle cells in oogenesis. (A) A diagram of the female reproductive system (left) with two ovaries connected to the uterus by the oviduct. Midstage death (top) occurs when the fly is protein starved. The nurse cell nuclei (blue) condense and fragment in early death phases, while the follicle cell membrane begins to stretch inwards and engulfs the germ layer in late death phases. In corpus luteum formation (bottom), Matrix metalloproteinase2 (Mmp2) cuts the follicle cell layer at the pink axis and the follicle cell layer slides off the mature egg. (B, C) Hemocytes (green) are localized in the entrance to the oviduct (actin filaments (phalloidin) in purple) in both (B) fed and (C) starved flies and increased hemocyte presence around dying egg chambers (white arrowheads) by oviduct entrance. (B’, C’) composites without DAPI channel (white). (B’’, C’’) Hemocyte only channels. (D) Quantification of hemocytes localized in the oviduct entrance of fed and starved flies. Each data point represents two ovaries. (p-value < 0.0180). Scale bars = 50μm.
Figure 2
Figure 2
Hemocyte numbers and localization changes in response to starvation. (A) Representative image of a stained and sectioned abdomen (Hml>GFP). (B) Abdomen boundary is manually defined in QuPath (yellow) and hemocytes are identified (red) based on their fluorescence intensities. 1 px (pixel) = 0.207 microns x 1 micron. (C) Distribution of the number of hemocytes detected averaged across abdomen sections per fly in well-fed and starved experimental conditions (two-sided Mann-Whitney U-test, p-value = 0.28). (D) Distribution of the percentage of abdomen area occupied by hemocytes averaged across abdomen sections per fly (two-sided Mann-Whitney U-test, p-value = 0.20). (E, E’) 2D histogram of hemocyte cartesian coordinates. Darker regions indicate a higher number of hemocyte detections across replicates. (F) Empirical cumulative distribution function (ECDF) of the proportion of hemocyte detections at percentile distances away from the abdomen centroid. Mean ECDF of fed and starved replicates are indicated by dark lines and the 95% confidence intervals are indicated by the lighter color bands (G) Histogram of pairwise Euclidean distances between hemocytes in well-fed and starved abdomens.
Figure 3
Figure 3
Hemocyte ablation results in defective oogenesis and reproductive defects. (A, B) Cryosections of Hml>lexA RNAi, GFP adult female with hemocytes in magenta (white asterisks). (B) Hml > Diap1 RNAi, GFP adult female with no hemocytes present. (C) Hml > lexA RNAi control egg chambers and (D) Hml > Diap1 RNAi egg chambers stained with DAPI (cyan). White arrowhead marks early degenerating egg chambers and asterisks mark late phase degenerating egg chambers. (E) Quantification of midstage death in controls (Hml > lacZ and Hml > lexA RNAi) and hemocyte-ablated (Hml > hid and Hml > Diap1 RNAi) fed flies, n = 7–10 flies per replicate with total of > 40 females per genotype. (F) Dying egg chambers from controls and ablated flies were identified by death phase (early and late). Ordinary One-Way ANOVA determined that ablated flies had a highly significant increase in the number of late stage dying egg chambers. (G) Representative image of Hml > lexA RNAi with anti-Hindsight staining the corpus luteum (in magenta). (H) Representative image of Hml > Diap1 RNAi ovaries with anti-Hindsight staining the corpus luteum (in magenta). (I) Quantification of corpus luteum retention, n = 7–10 females per replicate with a total of > 30 females per genotype. (J) Representative image of Hml > lexA RNAi egg chambers stained with Propidium Iodide (red). (K) Representative image of Hml > Diap1 RNAi egg chambers stained with Propidium Iodide (red). (L) Quantification of PI fluorescence, n = 8 females per genotype. (* p-value < 0.02,** p-value < 0.002, **** p-value < 0.0001) Scale bars = 100µm.
Figure 4
Figure 4
Hemocytes are involved in the engulfment of cell debris. (A) DAPI staining of entrance to oviduct. (A’) anti-NimC1 staining. (A’’) pHRed expressed with the follicle cell driver GR1-Gal4. (A’’’) Composite of NimC1 (yellow) and pHRed channels, with a white box marking the zoom window. Scale bar =100μm. (a) pHRed under GR1-Gal4 driver. (a’) NimC1 antibody staining, merge of 13 5 μm z stacks. (a”) Composite of pHRed and NimC1 antibody channels, z = 3 in order to visualize pHRed signaling. Colocalization is marked by white arrows. Scale bar = 20μm. (B) Diagram of ovary with dotted box indicating imaging area. (C’) DAPI in oviduct region. (C’’) anti-Hindsight staining of the corpus luteum (magenta). (C’’’) Hemocyte tagged line srpHemo-mCherry (green). (C’’’’) Composite of srpHemo and Hindsight channels; white arrowhead marks hemocyte engulfment of corpus luteum. Scale bars = 50μm.
Figure 5
Figure 5
Upd3 is expressed in the follicle cells of dying egg chambers. (A) Egg chambers are ordered by death phase, starting with Healthy (left) and ending with Phase 5 (right). Top panels are upd3>GFP (green) and upd3-lacZ (magenta) co-expression. Bottom panels are DAPI (cyan) of corresponding egg from above image. Scale bars = 50μm. (B) Hemocytes (magenta) are localized near and engulfing Upd3 positive cells (green, white arrowheads). Scale bar = 50μm. (C) Percentage of STAT+ hemocytes in the oviduct of fed or starved females, n = 7 females per condition. Unpaired t-test determined that the number of STAT+ hemocytes increased in starved females (** p-value = 0.002). (D, D’) Representative image of STAT+ hemocytes. (D) srpHemo-mCherry channel. (D’) Stat92E-GFP channel. White arrows indicate hemocyte with Stat92E-GFP expression overlap. Scale bar = 20μm. (E) upd3-lacZ expression was quantified in knockdowns of several phagocytic genes (draper RNAi #67034). Average intensity per μm2 were compared across genotype. Ordinary One-Way ANOVA reveals no significant difference (ns, p-value > 0.05). (F) Representative image of fed Hml>Stat92EDN ovaries with arrowheads indicating early phase dying egg chambers and asterisks indicating late phase dying egg chambers. (G) Representative image of fed Hml>draper RNAi (#36732) ovaries with arrowheads indicating early phase dying egg chambers and asterisks indicating late phase dying egg chambers. Scale bars = 100μm. (H) Quantification of midstage death phases of both Hml > Stat92EDN and Hml > draper RNAi (#36732) ovaries compared to Hml > lexA RNAi control ovaries, n = 7–10 females per replicate and > 14 females per genotype total. 2way ANOVA determined that the percentage of late phase dying egg chambers increased significantly in Hml > Stat92EDN compared to control, but that Hml > draper RNAi was not significant (*** p-value < 0.001, ns p-value > 0.05).
Figure 6
Figure 6
Absence of upd3 expression in dying follicle cells results in midstage death persistence and decreased hemocyte numbers. (A) Follicle cell knockdown of upd3 results in an increased number of late phase dying egg chambers (asterisks). (B) Quantification of dying egg chambers by death phase (** p-value of < 0.007, *** p-value of < 0.003), n = 10–15 females per replicate with a total of > 25 females per genotype. (C) w1118 starved flies with hemocytes labeled in red. (D) GR1-Gal4 starved ovaries. (E) GR1>upd3 RNAi starved ovaries. (F) w1118 fed ovaries. (G) Hemocyte recruitment to the oviduct was quantified in fed and starved conditions in both w1118 and knockdown flies. Each data point indicates an individual female with n = 4–8 females per genotype and condition, with >20 ovarioles scored per female. Starved w1118 flies had a significant increase in the number of hemocytes present in the oviduct compared to fed w1118 flies, however starved upd3 knockdown flies had a significant decrease in the number of hemocytes present in the oviduct (**** p-value < 0.0001, ns p-value > 0.05).

Similar articles

Cited by

References

    1. Arandjelovic S, Ravichandran KS. Phagocytosis of apoptotic cells in homeostasis. Nat Immunol. (2015) 16:907–17. doi: 10.1038/ni.3253 - DOI - PMC - PubMed
    1. Gregory CD, Pound JD. Microenvironmental influences of apoptosis in vivo and in vitro. Apoptosis. (2010) 15:1029–49. doi: 10.1007/s10495-010-0485-9 - DOI - PubMed
    1. Spradling AC, Niu W, Yin Q, Pathak M, Maurya B. Conservation of oocyte development in germline cysts from Drosophila to mouse. eLife. (2022) 11:e83230. doi: 10.7554/eLife.83230 - DOI - PMC - PubMed
    1. Newell MK, Villalobos-Menuey E, Schweitzer SC, Harper ME, Camley RE. Cellular metabolism as a basis for immune privilege. J Immune Based Ther Vaccines. (2006) 4:1. doi: 10.1186/1476-8518-4-1 - DOI - PMC - PubMed
    1. Etchegaray JI, Timmons AK, Klein AP, Pritchett TL, Welch E, Meehan TL, et al. . Draper acts through the JNK pathway to control synchronous engulfment of dying germline cells by follicular epithelial cells. Development. (2012) 139:4029–39. doi: 10.1242/dev.082776 - DOI - PMC - PubMed

Substances

LinkOut - more resources