. 2022 Aug 11:1:952785.
doi: 10.3389/frtra.2022.952785. eCollection 2022.

Single-cell mapping of leukocyte immunoglobulin-like receptors in kidney transplant rejection

Affiliations

Single-cell mapping of leukocyte immunoglobulin-like receptors in kidney transplant rejection

Baptiste Lamarthée et al. Front Transplant. .

Abstract

Leukocyte immunoglobulin-like receptors (LILRs) are a family of inhibitory or stimulatory receptors expressed by immune cell types belonging to both myeloid and lymphoid lineage. Several members of the LILR family recognize major histocompatibility complex class I and thus play important roles in a range of clinical situations including pregnancy. Moreover, paired immunoglobulin-like receptors (PIRs), the murine orthologs of LILRs, are implicated in experimental transplant allorecognition by monocytes and contribute to the induction of donor-specific monocyte-memory. After non-self recognition, activating PIRs are transiently overexpressed at the surface of monocytes and participate in donor-specific monocyte recruitment, leading to graft rejection in vivo. In the present study, we mapped LILR expression and also their respective reported ligands at single cell level in the renal allograft and circulating cells in the context of kidney transplant rejection. Recipient-derived monocytes were shown to infiltrate the donor tissue and to differentiate into macrophages. We thus also investigate LILR expression during in vitro monocyte-to-macrophage differentiation in order to characterize the myeloid population that directly contribute to allorecognition. Altogether our results emphasize non-classical monocytes and CD68+ M1 macrophages as key players in LILRs-ligand interaction in kidney transplantation.

Keywords: LILR; allorecognition; kidney transplantation; monocytes; single-cell RNA sequencing.


Conflict of interest statement

The authors declare that the research was conducted in the absence of any commercial or financial relationships that could be construed as a potential conflict of interest.

Figures

Figure 1
Figure 1
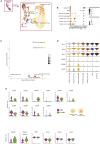
Overview of the single-cell RNA-sequencing analysis on 12 peripheral blood samples with and without antibody-mediated rejection (ABMR) to map LILR expression. (A) Briefly, scRNAseq performed on 6 peripheral blood samples from kidney transplant recipients with a concomitant diagnosis of ABMR, and 6 stable patients without ABMR was reanalyzed (E-MTAB-11450). (B,C) Unsupervised clustering revealed 13 clusters corresponding to the main myeloid and lymphoid cells and granulocytes/platelets. (D,E) CellChat analysis was performed and focused on LILR-ligand. (D) The number of incoming and outgoing LILR-ligand interactions is plotted per cell type. (E) Violin plots depicting expression of indicated genes in all the cell types. (F) We subclustered FCGR3A+ CD14- monocytes and performed differential expression for ABMR vs. no ABMR for the indicated genes. P-values were subjected to Bonferroni correction method.
Figure 2
Figure 2
Overview of the single-cell RNA-sequencing analysis on 7 kidney biopsy samples with and without antibody-mediated rejection (ABMR) to map LILR expression. (A) Briefly, scRNAseq performed on 2 biopsies from kidney transplant recipients with a concomitant diagnosis of ABMR, and 5 stable patients without ABMR was reanalyzed (GSE145927 and KPMP). (B,C) Unsupervised clustering revealed 9 clusters corresponding to the main endothelial cells (EC), myeloid and lymphoid cells but also epithelial renal cells. (D) LILR members were plotted on the UMAP. (E,F) CellChat analysis was performed and focused on Cell-cell contact signaling. (E) The number of incoming and outgoing LILR-ligand interactions is plotted per cell type. (G) We subclustered myeloid cells and performed differential expression for ABMR vs. no ABMR for the indicated genes. P-values were subjected to Bonferroni correction method.
Figure 3
Figure 3
Reintegration of biopsy-derived myeloid cells to map LILR expression at single cell level. (A,B) Briefly, myeloid cells were subclustered and reintegrated before subcluster identification and analysis. Unsupervised clustering revealed 7 clusters corresponding to indicated subpopulations. (C) CellChat analysis was performed and focused on LILR signaling. The number of incoming and outgoing LILR-ligand interactions is plotted per cell type. (D) Violin plots depicting expression of indicated genes in all the cell types. (E) We subclustered both non-classical FCGR3A+ CD14- monocytes and CD68+ M1 macrophages and performed differential expression for ABMR vs. no ABMR for the indicated genes. P-values were subjected to Bonferroni correction method.
Figure 4
Figure 4
LILRA but also S100A8 and S100A9 expression are highly regulated during macrophage differentiation. (A) Schematic workflow of transcriptomic comparison. Public data corresponding to undifferentiated monocytes, Mreg, M0, M1 or M2 transcriptomes were analyzed. (B) Principal Component Analysis illustrating macrophage differentiation impact at transcriptional level. (C) Expression of the LILRA and LILRB families as well as CD47 and SIRPA and reported ligands in the indicated differentiated cells (Log Fold change vs. Monocytes). Log Fold change > |2| were depicted by dotted lines.
Figure 5
Figure 5
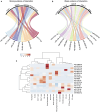
miRNAs strongly regulate LILR reported ligands but not LILRs. (A,B) MiRTarBase and TargetScan databases were interrogated using MIENTURNET web tool. Strong evidence of interaction (predicted or experimentally validated with robust methods) and weak evidence of interaction (experimentally validated with immunoprecipitation) were depicted using chord diagrams. (C) The Fantom 5 database was interrogated to characterize the main cellular sources of the miRNAs of interest and a heatmap was built.

References

    1. Van Loon E, Senev A, Lerut E, Coemans M, Callemeyn J, Van Keer JM, et al. . Assessing the complex causes of kidney allograft loss. Transplantation. (2020) 104:2557–66. 10.1097/TP.0000000000003192 - DOI - PubMed
    1. Mayrdorfer M, Liefeldt L, Wu K, Rudolph B, Zhang Q, Friedersdorff F, et al. . Exploring the complexity of death-censored kidney allograft failure. J Am Soc Nephrol. (2021) 32:1513–26. 10.1681/ASN.2020081215 - DOI - PMC - PubMed
    1. Haas M, Loupy A, Lefaucheur C, Roufosse C, Glotz D, Seron D, et al. . The Banff 2017 kidney meeting report : revised diagnostic criteria for chronic active T cell – mediated rejection, antibody- mediated rejection, and prospects for integrative endpoints for next- generation clinical trials. Am J Transplant. (2018) 18:293–307. 10.1111/ajt.14625 - DOI - PMC - PubMed
    1. Dai H, Lan P, Zhao D, Abou-Daya K, Liu W, Chen W, et al. . PIRs mediate innate myeloid cell memory to nonself MHC molecules. Science. (2020) 368:1122–7. 10.1126/science.aax4040 - DOI - PMC - PubMed
    1. Callemeyn J, Lamarthée B, Koenig A, Koshy P, Thaunat O, Naesens M. Allorecognition and the spectrum of kidney transplant rejection. Kidney Int. (2021) 101:692–710. 10.1016/j.kint.2021.11.029 - DOI - PubMed

LinkOut - more resources