. 2024 Jun 29;3(7):pgae258.
doi: 10.1093/pnasnexus/pgae258. eCollection 2024 Jul.

Quantifying the vulnerabilities of the online public square to adversarial manipulation tactics

Affiliations

Quantifying the vulnerabilities of the online public square to adversarial manipulation tactics

Bao Tran Truong et al. PNAS Nexus. .

Abstract

Social media, seen by some as the modern public square, is vulnerable to manipulation. By controlling inauthentic accounts impersonating humans, malicious actors can amplify disinformation within target communities. The consequences of such operations are difficult to evaluate due to the challenges posed by collecting data and carrying out ethical experiments that would influence online communities. Here we use a social media model that simulates information diffusion in an empirical network to quantify the impacts of adversarial manipulation tactics on the quality of content. We find that the presence of hub accounts, a hallmark of social media, exacerbates the vulnerabilities of online communities to manipulation. Among the explored tactics that bad actors can employ, infiltrating a community is the most likely to make low-quality content go viral. Such harm can be further compounded by inauthentic agents flooding the network with low-quality, yet appealing content, but is mitigated when bad actors focus on specific targets, such as influential or vulnerable individuals. These insights suggest countermeasures that platforms could employ to increase the resilience of social media users to manipulation.


Figures

Fig. 1.
Fig. 1.
Illustration of the SimSoM model. Each agent has a limited-size news feed, containing messages posted or reposted by friends. Dashed arrows represent follower links; messages propagate from agents to their followers along solid links. At each time step, an active agent (colored node) either posts a new message (here, m20) or reposts one of the existing messages in their feed, selected with probability proportional to their appeal a, social engagement e, and recency r (here, m2 is selected). The message spreads to the node’s followers and shows up on their feeds.
Fig. 2.
Fig. 2.
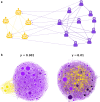
Subnetworks modeling authentic accounts (purple nodes) and bad actors (yellow nodes). a) Illustration of the follower link structure. Solid links indicate follower relations within each subnetwork. Both subnetworks have hub and clustering structure that mimics or derives from online social networks. Dashed links represent authentic accounts following bad actors, according to the infiltration parameter γ, which represents the probability that an authentic node follows any given bad actor. When γ=0 there is no infiltration and bad actors are isolated, therefore harmless; the opposite extreme γ=1 indicates complete infiltration, such that bad actors are followed by all authentic accounts. b) Effects of bad-actor infiltration γ on the quality of messages in synthetic networks with 103 authentic agents and 100 inauthentic agents. For illustration purposes, both the authentic and inauthentic subnetworks in this panel are generated with the same method used for the inauthentic subnetworks in our experiments (see Methods). Node size represents the number of followers. The darker an authentic agent node, the lower the quality of messages in their feed.
Fig. 3.
Fig. 3.
Impacts of different network structural features on the average information quality, relative to the scenario without bad actors. The original network (“hubs + clusters”) is visualized along with shuffled networks in which links from the original network are rewired while preserving clusters, hubs, or neither (“random”). Node size and color represent, respectively, the number of followers of an account and their political leaning ranging from liberal to conservative (red to blue, see Methods). Yellow nodes are bad actors. Pairwise statistical significance is calculated using the Mann–Whitney U test (*** for p<103); only significant differences are reported.
Fig. 4.
Fig. 4.
Effects of individual and combined tactics by bad actors on the system’s message quality, relative to the scenario without bad actors. a) Varying infiltration γ, without flooding (θ=1) or deception (ϕ=0). Shading represents 95% confidence intervals across runs in panels a–c. b) Varying flooding θ with infiltration γ=0.01 and no deception (ϕ=0). c) Varying deception ϕ with infiltration γ=0.01 and no flooding (θ=1). d) Joint infiltration and flooding with no deception. e) Joint infiltration and deception with no flooding. f) Joint deception and flooding with infiltration γ=0.01.
Fig. 5.
Fig. 5.
Complementary cumulative distributions of reshare cascade sizes for low- and high-quality content, generated by inauthentic and authentic agents, respectively. The plots are based on 10 simulations. a) Effect of bad-actor infiltration γ, with no flooding (θ=1) or deception (ϕ=0). b) Effect of flooding θ, with low infiltration (γ=103) and no deception (ϕ=0). c) Effect of deception ϕ, with low infiltration (γ=103) and no flooding (θ=1).
Fig. 6.
Fig. 6.
Scaling between reshare and exposure cascade sizes. a) Scaling for low-quality messages (posted by inauthentic agents). b) Scaling for high-quality messages (posted by authentic agents). The exposure cascade size is averaged across messages with the same reshare cascade size, based on 10 simulations. The dashed lines provide a linear scaling reference, while the solid lines show the slopes (exponents) ν of power-law fits for reshare cascades of size between 10 and 1,000, yielding ν=0.80±0.01 (low-quality messages) and ν=0.56±0.01 (high-quality messages). The largest reshare and exposure cascades (corresponding to the circles in panels a and b) are also visualized for c) low-quality and d) high-quality messages, based on one simulation. Node colors are the same as in Fig. 3; node size represents out-degree, or influence. Here we use θ=1,ϕ=0,γ=102; the results are similar for other γ values.
Fig. 7.
Fig. 7.
Effects of targeting tactics. a) Average information quality resulting from each tactic, as well as the default random targeting, relative to the scenario without bad actors. We highlight significant differences calculated using The Mann–Whitney U test (**** for p<104). b) Suppression of quality in the empirical network when bad actors specifically target influential accounts (hubs), and when they target politically left- (liberal) and right-leaning (conservative) accounts. The network has 103 authentic agents (purple nodes) and 50 inauthentic agents. Node size represents the number of followers. The darker an authentic agent node, the lower the quality of messages in their feed. Significant changes due to targeting tactics are only observed when bad-actor infiltration is sufficiently high, therefore we use γ=101 in experiments for both panels.

Similar articles

References

    1. Ratkiewicz J, et al. 2011. Detecting and tracking political abuse in social media. Proceedings International AAAI Conference on Web and social media (ICWSM). 5(1):297–304.
    1. Metaxas PT, Mustafaraj E. 2012. Social media and the elections. Science. 338(6106):472–473. - PubMed
    1. Stewart LG, Arif A, Starbird K. 2018. Examining trolls and polarization with a retweet network. Proceedings ACM WSDM Workshop on Misinformation and Misbehavior Mining on the Web. 70(1):5–11.
    1. Arif A, Stewart LG, Starbird K. 2018. Acting the part: examining information operations within# BlackLivesMatter discourse. Proc ACM on Hum-Comput Interact. 2(CSCW):1–27.
    1. Lazer D, et al. 2018. The science of fake news. Science. 359(6380):1094–1096. - PubMed