. 2024 Oct;23(10):e14260.
doi: 10.1111/acel.14260. Epub 2024 Jul 12.

Myeloid ectopic viral integration site 2 accelerates the progression of Alzheimer's disease

Affiliations

Myeloid ectopic viral integration site 2 accelerates the progression of Alzheimer's disease

Yuting Cui et al. Aging Cell. 2024 Oct.

Abstract

Amyloid plaques, a major pathological hallmark of Alzheimer's disease (AD), are caused by an imbalance between the amyloidogenic and non-amyloidogenic pathways of amyloid precursor protein (APP). BACE1 cleavage of APP is the rate-limiting step for amyloid-β production and plaque formation in AD. Although the alteration of BACE1 expression in AD has been investigated, the underlying mechanisms remain unknown. In this study, we determined MEIS2 was notably elevated in AD models and AD patients. Alterations in the expression of MEIS2 can modulate the levels of BACE1. MEIS2 downregulation improved the learning and memory retention of AD mice and decreased the number of amyloid plaques. MEIS2 binds to the BACE1 promoter, positively regulates BACE1 expression, and accelerates APP amyloid degradation in vitro. Therefore, our findings suggest that MEIS2 might be a critical transcription factor in AD, since it regulates BACE1 expression and accelerates BACE1-mediated APP amyloidogenic cleavage. MEIS2 is a promising early intervention target for AD treatment.

Keywords: Alzheimer's disease; myeloid ectopic viral integration site 2; transcription pathway; β‐Site amyloid precursor protein cleaving enzyme 1.


Conflict of interest statement

All other authors declare they have no competing interests.

Figures

FIGURE 1
FIGURE 1
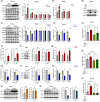
MEIS2 increases in AD. (a) Immunoblot analysis of APP protein levels in HT22 cells transfected with APPswe or the control vector. (b) MEIS2 mRNA levels in HT22 cells transfected with APPswe or the control vector. (c) Representative western blots and relative quantification of the protein expression levels of MEIS2 in HT22 cells transfected with APPswe or the control vector. (d) MEIS2 mRNA levels in the hippocampus of 8‐month APP/PS1 mice and WT mice (n = 3). (e) MEIS2 protein levels in the hippocampus of 8‐month APP/PS1 mice and WT mice (n = 3). (f) MEIS2 mRNA levels in the cortex of 8‐month APP/PS1 mice and WT mice (n = 3). (g) MEIS2 protein levels in the cortex of 8‐month‐old APP/PS1 and WT mice (n = 3). (h) Representative immunostaining and quantifications of MEIS2 (green) and DAPI in the hippocampus and cortex of patients with AD (n = 3) and control cases (n = 4). Scale bar = 100 μm. (i) MEIS2 levels in the CSF of MCI (n = 45) and DAT (n = 65) of patients with AD and normal cognition group (n = 45). (j) MEIS2 levels in the sera of AD patients with mild cognitive impairment (MCI) (n = 60), dementia stage of AD (DAT) (n = 95) and participants with normal cognition (n = 95). Data are presented as mean ± standard error of the mean (SEM) of three separate experiments. (*p < 0.05, **p < 0.01, ***p < 0.001, ****p < 0.0001). Data in b–h are analysed by Student's t‐test; data in i and j were analysed by one‐way ANOVA.
FIGURE 2
FIGURE 2
MEIS2 increases with age in APP/PS1 mice and has a strong correlation with BACE1 and amyloid cleavage products. (a) MEIS2 and BACE1 mRNA levels in the hippocampi of 2‐, 5‐, and 8‐month APP/PS1 mice and age‐matched WT mice. (b) Correlation between MEIS2 and BACE1 mRNA levels in mice hippocampi. (c) Representative western blots and relative quantification of the protein expression levels of MEIS2 and BACE1 in the hippocampi of 2‐, 5‐, and 8‐month APP/PS1 mice and age‐matched WT mice. (d) Correlation between MEIS2 and BACE1 protein levels in mice hippocampi. (e) MEIS2 and BACE1 mRNA levels in the cortices of 2‐, 5‐, and 8‐month APP/PS1 mice and age‐matched WT mice. (f) Correlation between MEIS2 and BACE1 mRNA levels in mice cortices. (g) Representative western blots and relative quantification of the protein expression levels of MEIS2 and BACE1 in the cortices of 2‐, 5‐, and 8‐month APP/PS1 mice and age‐matched WT mice. (h) Correlation between MEIS2 and BACE1 protein levels in mice cortices. (i) The relative levels of soluble Aβ1‐42, sAPPβ, and Aβ1‐40 in the cortices of 2‐, 5‐, and 8‐month APP/PS1 mice and age‐matched WT mice were detected by ELISA. (j) Correlation analysis of Aβ1‐42, sAPPβ, and Aβ1‐40 levels with MEIS2 expression in the cortices of APP/PS1 mice at different ages. Male APP/PS1 mice of 2, 5, and 8 months (AD group, n = 3 for each group) and male age‐matched WT mice (WT group, n = 3 for each group) are used. Data are presented as mean ± SEM. (*p < 0.05, **p < 0.01, ***p < 0.001, ****p < 0.0001). Data in a, c, e, g, and i are analysed by one‐way ANOVA; data in b, d, f, h, and j are analysed by linear regression analysis.
FIGURE 3
FIGURE 3
The effect of MEIS2 on BACE1 expression and APP amyloid cleavage. (a) Representative western blots and relative quantification of the protein expression levels of MEIS2, BACE1, ADAM10, NCSTN, PSEN1, and APP in mouse primary neurons transfected with oeMEIS2 or the control vector. (b) The relative levels of Aβ1‐40, Aβ1‐42, and sAPPβ in the culture media of mouse primary neurons transfected with oeMEIS2 or the control vector. (c) Representative western blots and relative quantification of the protein expression levels of MEIS2, BACE1, ADAM10, NCSTN, PSEN1, and APP in mouse primary neurons transfected with MEIS2‐shRNA or the control‐shRNA. (d) The relative levels of Aβ1‐40, Aβ1‐42, and sAPPβ in the culture medium of mouse primary neurons transfected with MEIS2‐shRNA or the control‐shRNA. (e) MEIS2 and BACE1 mRNA levels in HT22 cells transfected with MEIS2 plasmid or control vector. (f) MEIS2 and BACE1 protein levels in HT22 cells transfected with MEIS2 plasmid or control vector. (g) The relative levels of Aβ1‐40, Aβ1‐42, and sAPPβ in the culture medium of HT22 cells transfected with MEIS2 plasmid or control vector. (h) MEIS2 and BACE1 mRNA levels in HT22 cells transfected with LVshMEIS2 or LVshCtrl. (i) MEIS2 and BACE1 protein levels in HT22 cells transfected with LVshMEIS2 or LVshCtrl. (j) The relative levels of Aβ1‐40, Aβ1‐42, and sAPPβ in the culture medium of HT22 cells transfected with LVshMEIS2 or LVshCtrl. (k) MEIS2 and BACE1 in primary mouse neurons co‐transfected with oeMEIS2 or the control vector and LVshBACE1 or LVshCtrl, respectively. The relative levels of sAPPβ (l), Aβ1‐42 (m), and Aβ1‐40 (n) in the culture medium of mouse primary neurons co‐transfected with oeMEIS2 or the control vector and LVshBACE1 or LVshCtrl, respectively. (o) BACE1 and MEIS2 protein levels in HT22 cells transfected with BACE1 plasmid and control vector. (p) BACE1 and MEIS2 protein levels in HT22 cells transfected with shBACE1 plasmid and control vector. Data are presented as mean ± SEM of three separate experiments. (*p < 0.05, **p < 0.01, ***p < 0.001, ****p < 0.0001). Data in a–j and o–p are analysed by Student's t‐test; data in l–n are analysed by one‐way ANOVA.
FIGURE 4
FIGURE 4
Aggravated cognitive impairment, upregulated BACE1 expression, and promoted amyloid cleavage in the APP/PS1 mice injected with AAVoeMEIS2. APP/PS1 mice were microinjected with AAVoeMEIS2 or AAVoeCtrl (3 × 109 viral genomes/site). (a–f) WT mice (WT, n = 6), AAVoeMEIS2‐injected APP/PS1 mice (AD‐oeMEIS2, n = 6), and AAVoeCtrl‐injected APP/PS1 mice (AD‐oeCtrl, n = 6) were trained and tested for behavioural experiments. (a) Morris water maze (MWM) test results depicting latency to escape to a hidden platform in the 5‐day training phase of the APP/PS1 mice injected with AAVoeMEIS2. MWM probe test to analyse (b) the latency to escape to the platform location and (c) the times of AAVoeMEIS2‐injected APP/PS1 mice passed through the platform location. (d) Representative tracking heat map of probe test of the AAVoeMEIS2‐injected APP/PS1 mice. Novel object recognition analysed the discrimination index during training (e) and testing (f) of the APP/PS1 mice injected with AAVoeMEIS2. (g) The mRNA levels of MEIS2 and BACE1 in the cerebral hippocampi of APP/PS1 mice injected with AAVoeCtrl and AAVoeMEIS2. (h) Correlation between MEIS2 and BACE1 mRNA levels in mice hippocampi. (i) Representative Western blots and relative quantification of the protein expression levels of MEIS2, BACE1, ADAM10, NCSTN, PSEN1, and APP in the cerebral hippocampi of APP/PS1 mice injected with AAVoeCtrl and AAVoeMEIS2. (j) Correlation between MEIS2 and BACE1 protein levels in mice hippocampi. (k) Fluorogenic BACE1 activity assay analysis of BACE1 activity in the brains of APP/PS1 mice injected with AAVoeCtrl and AAVoeMEIS2. (l) The relative levels of Aβ1‐40, Aβ1‐42, and sAPPβ in the brain tissues of the APP/PS1 mice injected with AAVoeMEIS2. (m) Representative immunostaining and quantification of 6E10‐positive amyloid plaques in the brains of the APP/PS1 mice injected with AAVoeMEIS2. Scale bar = 100 μm. Data are presented as mean ± SEM. (*p < 0.05, **p < 0.01, ***p < 0.001, ****p < 0.0001). Data in a, b, c, e, and f are analysed by one‐way ANOVA; data in g, i, k, l, and m are analysed by Student's t‐test; data in h and j are analysed by linear regression analysis.
FIGURE 5
FIGURE 5
Alleviated cognitive impairment, downregulated BACE1 expression, and reduced amyloid cleavage in the APP/PS1 mice injected with AAVshMEIS2. APP/PS1 mice were microinjected with AAVshMEIS2 or AAVshCtrl (3 × 109 viral genomes/site). (a–f) WT mice (WT, n = 6), AAVshMEIS2‐injected APP/PS1 mice (AD‐shMEIS2, n = 6), and AAVshCtrl‐injected APP/PS1 mice (AD‐shCtrl, n = 6) were trained and tested for behavioural experiments. (a) MWM test results depicting latency to escape to a hidden platform in the 5‐day training phase of the APP/PS1 mice injected with AAVshMEIS2. MWM probe test to analyse (b) the latency to escape to the platform location and (c) the times of AAVshMEIS2‐injected APP/PS1 mice passed through the platform location. (d) Representative tracking heat map of probe test of the AAVshMEIS2‐injected APP/PS1 mice. Novel object recognition analysed the discrimination index during training (e) and testing (f) of the APP/PS1 mice injected with AAVshMEIS2. (g) The mRNA levels of MEIS2 and BACE1 in the cerebral hippocampi of APP/PS1 mice injected with AAVshCtrl and AAVshMEIS2. (h) Correlation between MEIS2 and BACE1 mRNA levels in mice hippocampi. (i) Representative Western blots and relative quantification of the protein expression levels of MEIS2, BACE1, ADAM10, NCSTN, PSEN1 and APP in the cerebral hippocampi of APP/PS1 mice injected with AAVshCtrl and AAVshMEIS2. (j) Correlation between MEIS2 and BACE1 protein levels in mice hippocampi. (k) Fluorogenic BACE1 activity assay analysis of BACE1 activity in the brains of APP/PS1 mice injected with AAVshCtrl and AAVshMEIS2. (l) The relative levels of Aβ1‐40, Aβ1‐42, and sAPPβ in the brain tissues of the APP/PS1 mice injected with AAVshMEIS2. (m) Representative immunostaining and quantification of 6E10‐positive amyloid plaques in the brains of the APP/PS1 mice injected with AAVshMEIS2. Scale bar = 100 μm. Data were presented as mean ± SEM. (*p < 0.05, **p < 0.01, ***p < 0.001, ****p < 0.0001). Data in a, b, c, e, and f are analysed by one‐way ANOVA; data in g, i, k, l, and m are analysed by Student's t‐test; data in h and j are analysed by linear regression analysis.
FIGURE 6
FIGURE 6
MEIS2 binds to BACE1 promoter and regulates BACE1. (a) Integrative Genomics Viewer (IGV) of the chromatin‐accessible regions of BACE1 was analysed by GSE145908 in the GEO database. (b) The mRNA levels of MEIS2 and BACE1 in HT22 cells treated with 5 μg/mL ActD for 3 h after transfected with MEIS2 plasmid and control vector for 24 h. (c) The potential MEIS2 binding sites on mouse BACE1 promoter were predicted by the JASPAR database. (d) Schematic diagram of the mutation constructs of MEIS2 binding sites in the mouse BACE1 promoter region. (e) Dual‐luciferase reporter assay results depicted BACE1 promoter activity in N2a cells after being co‐transfected with MEIS2 or pcDNA3.1 and mouse BACE1 promoter luciferase reporter plasmid (−2000 to TSS) or different mutations with renilla reporter plasmid as the control. The ChIP assay results depicted MEIS2 binding to the BACE1 promoter in HT22APP cells (f), the brain of 8‐month age APP/PS1 mice and age‐matched WT mice (g), and the APP/PS1 mice with different ages (h). (i) KEGG pathway analysis of DEGs after RNA‐seq using HT22 cells transfected with MEIS2 plasmid and control vector. (j) Circular heatmap of AD‐related DEGs after transfected with MEIS2 plasmid and control vector in HT22 cells. (k) Diagram showing the mechanism by which MEIS2 promotes amyloid cleavage of β amyloid precursor protein through transcriptional regulation of BACE1. Data are presented as mean ± SEM of three separate experiments. (*p < 0.05, **p < 0.01, ***p < 0.001, ****p < 0.0001). Data in b, e, f and g are analysed by Student's t‐test; data in h is analysed by one‐way ANOVA.

Similar articles

References

    1. (2021). 2021Alzheimer's disease facts and figures. Alzheimer's & Dementia, 17(3), 327–406. - PubMed
    1. Bahn, G. , Park, J. S. , Yun, U. J. , Lee, Y. J. , Choi, Y. , Park, J. S. , Baek, S. H. , Choi, B. Y. , Cho, Y. S. , Kim, H. K. , Han, J. , Sul, J. H. , Baik, S. H. , Lim, J. , Wakabayashi, N. , Bae, S. H. , Han, J. W. , Arumugam, T. V. , Mattson, M. P. , & Jo, D. G. (2019). NRF2/ARE pathway negatively regulates BACE1 expression and ameliorates cognitive deficits in mouse Alzheimer's models. Proceedings of the National Academy of Sciences of the United States of America, 116(25), 12516–12523. - PMC - PubMed
    1. Bum‐Erdene, K. , Zhou, D. , Gonzalez‐Gutierrez, G. , Ghozayel, M. K. , Si, Y. , Xu, D. , Shannon, H. E. , Bailey, B. J. , Corson, T. W. , Pollok, K. E. , Wells, C. D. , & Meroueh, S. O. (2019). Small‐molecule covalent modification of conserved cysteine leads to allosteric inhibition of the TEAD·yap protein‐protein interaction. Cell Chemical Biology, 26(3), 378–389.e13. - PubMed
    1. Bushweller, J. H. (2019). Targeting transcription factors in cancer—from undruggable to reality. Nature Reviews. Cancer, 19(11), 611–624. - PMC - PubMed
    1. Butterfield, D. A. , & Halliwell, B. (2019). Oxidative stress, dysfunctional glucose metabolism and Alzheimer disease. Nature Reviews. Neuroscience, 20(3), 148–160. - PMC - PubMed

MeSH terms

Substances

LinkOut - more resources