. 2024 Jul 25;67(14):12099-12117.
doi: 10.1021/acs.jmedchem.4c00835. Epub 2024 Jul 12.

Ligand-Directed Labeling of the Adenosine A1 Receptor in Living Cells

Affiliations

Ligand-Directed Labeling of the Adenosine A1 Receptor in Living Cells

Eleonora Comeo et al. J Med Chem. .

Abstract

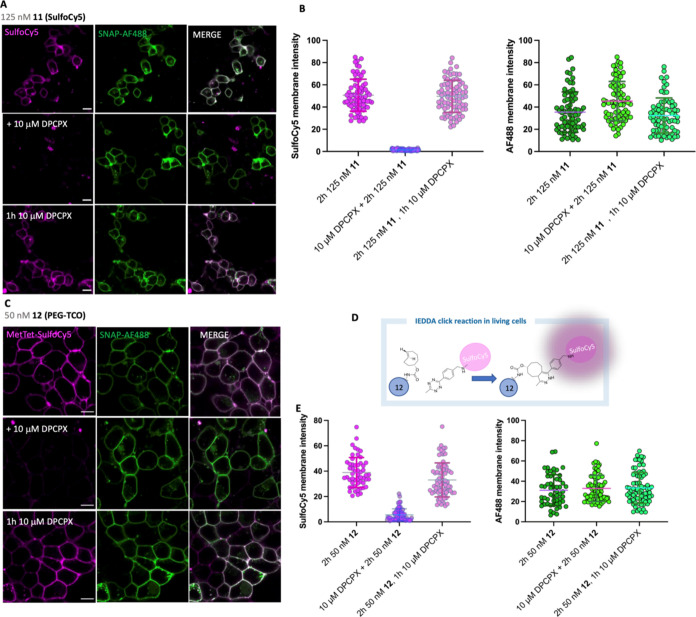
The study of protein function and dynamics in their native cellular environment is essential for progressing fundamental science. To overcome the requirement of genetic modification of the protein or the limitations of dissociable fluorescent ligands, ligand-directed (LD) chemistry has most recently emerged as a complementary, bioorthogonal approach for labeling native proteins. Here, we describe the rational design, development, and application of the first ligand-directed chemistry approach for labeling the A1AR in living cells. We pharmacologically demonstrate covalent labeling of A1AR expressed in living cells while the orthosteric binding site remains available. The probes were imaged using confocal microscopy and fluorescence correlation spectroscopy to study A1AR localization and dynamics in living cells. Additionally, the probes allowed visualization of the specific localization of A1ARs endogenously expressed in dorsal root ganglion (DRG) neurons. LD probes developed here hold promise for illuminating ligand-binding, receptor signaling, and trafficking of the A1AR in more physiologically relevant environments.


Conflict of interest statement

The authors declare no competing financial interest.

Figures

Figure 1
Figure 1
Schematic representation of ligand-directed labeling of a GPCR. Upon ligand binding, the electrophilic carbonyl group undergoes nucleophilic attack by a nucleophilic residue (here represented as lysine) side chain in proximity to the binding site; the functional probe (here represented by a red-shifted fluorophore) is covalently attached to the receptor, and the affinity guide ligand freely dissociates (dashed line) leaving the binding site available for additional ligands to bind to the target protein receptor.
Figure 2
Figure 2
Molecular modeling of DITC-XAC (A), ligand-directed (LD) probe 11 (B) and LD probe 12 (C) to the crystal structure of the hA1AR (PDB: 5UEN) performed with Schrödinger’s Glide (Schrödinger release 2022-2). Figures show a focused view of the orthosteric binding site of the hA1AR with cocrystallized DU172. DITC-XAC is illustrated in violet-purple sticks, LD probe 11 is rendered in steel blue sticks, while LD probe 12 is depicted in light blue sticks. The hA1AR is shown in ribbon with the surface set at 80% transparency, both colored in aquamarine. Hydrogen bonds are shown as yellow-dashed lines and the extracellular loop (ECL) 2 and lysine 168 (K168) are labeled for clarity. Images were generated using PyMOL (2.5.4). The panel (framed within a light blue solid line) on the right of panel A depicts a schematic representation of the covalent ligand-binding hypothesis of DITC-XAC, which inspired the design of our ligand-directed probes. The devised LD A1AR probe is shown with a general structure whereby the phenoxy acyl group, depicted here as a purple-colored circle, may represent a different array of functional cargo (e.g., fluorophore, clickable ligand) depending on the final application of the LD compound.
Scheme 1
Scheme 1. Synthesis of 3-Fluorophenyl Ester-Linked Ligand-Directed Probes
Reagents and conditions: (a) (i) cyanoacetic acid, Ac2O, 83 °C, 2 h, (ii) H2O, 70% NaOH, room temperature (rt), 64%; (b) NaNO2, 50% AcOH, 57 °C, 1 h, 41%; (c) Na2S2O4, 12.5% NH4OH, 60 °C, 30 min, 80%; (d) (i) 4-(methoxycarbonyl)bicyclo[2.2.2]octane-1-carboxylic acid, N,N-diisopropylethylamine (DIPEA), COMU, dimethylformamide (DMF), rt, 15 min (ii) 1.0 M KOH, propan-2-ol, reflux, 2 h, 68% (over two steps); (e) N-Boc ethylenediamine, COMU, DIPEA, DMF, rt 53%; (f) 4 M HCl in dioxane, rt, 1 h, quantitative; (g) Boc-β-Ala-OH, COMU, DIPEA, DMF, rt, 88%; (h) 3-fluoro-4-hydroxybenzoic acid, COMU, DIPEA, DMF, 1 h, 90 °C, 53%; (i) respective probe (−CO2H), 2-bromo-1-ethyl-pyridinium tetrafluoroborate (BEP), DIPEA, DMF, 15 min, rt, then amine, overnight 29–75%.
Figure 3
Figure 3
Molecular pharmacology and biochemical characterization of 11 and 12. NanoBRET ligand-binding data were measured in HEK293 cells stably expressing the human NL-A1AR (A–C) or rat NL-A1AR (D–F). (A, D) NanoBRET saturation ligand-binding curves obtained by treating the cells with increasing concentration of 11 (0–125 nM (A), human NL-A1AR) and (0–250 nM (D), rat NL-A1AR) for 1 h at 37 °C in the absence (closed purple circles) and presence (open circles) of 10 μM A1AR selective competitive antagonist DPCPX, where the latter was used to determine nonspecific binding. (B, E) Inhibition of CA200645 specific binding (25 nM) in the presence of increasing concentrations of competitive ligands (12 and DPCPX). Data were normalized to maximal BRET signals in the absence of unlabeled competing ligands (total binding, TB). (C, F) NanoBRET dissociation kinetics experiments with 11 (SulfoCy5) performed in human and rat NL-A1AR HEK293T cells, respectively. Cells were treated with 250 nM 11 (SulfoCy5, lilac open circles) for 5 h and CA200645 (black open triangles) for 2 h. After baseline BRET was read every 30 s for 5 min, 10 μM DPCPX was added and BRET measurements were taken every 30 s over the subsequent 1 h. Specific BRET was calculated after subtraction of nonspecific binding component, determined in the presence of 10 μM DPCPX, from the total binding. Each data point represents the combined mean ± SEM from n = 5 (A, C), n = 4 (B, D), and n = 3 (E, F) experiments, each one performed in triplicate. (G) HEK293G cells stably expressing TS-SNAP-A1AR were treated with 300 nM 11 or 130 nM 12 in serum-free media for 2 h at 37 °C and 5% CO2. For samples treated with compound 12, the labeling solution was removed and immediately replaced with 10 mL of serum-free media containing 1 μM Met-Tet-Cy5 and incubated at 37 °C and 5% CO2 for a further 15 min. Untreated cells were used as a control. TS-SNAP-A1AR was purified and separated on an SDS-PAGEgel gel, and direct Cy5 fluorescence was visualized using in-gel fluorescence. The gel shown is representative of three independent experiments.
Figure 4
Figure 4
NanoBRET ligand-binding curves obtained by treating HEK293 cells expressing each adenosine receptor subtype with 11 (A) or 12 (B). (A) Specific binding of 11 was measured from saturation binding curves after subtraction of the nonspecific binding component from the total binding. Nonspecific binding was determined in the presence of 10 μM ZM241385 for NL-hA2AAR, 10 μM PSB603 for NL-hA2BAR, or 10 μM MRS1220 for NL-hA3AR. (B) Inhibition of CA200645 specific binding to each subtype of adenosine receptor in the presence of increasing concentrations of 12. Data were normalized to the maximal BRET signal in the absence of unlabeled competing ligands (total binding, TB). Data points represent the combined mean ± SEM from n = 4 (NL-hA2AAR and NL-hA2BAR) and n = 3 (NL-hA3AR) experiments performed in triplicate.
Figure 5
Figure 5
NanoBiT (NanoLuc Binary Technology) complementation assay was used to monitor agonist-induced internalization of HiBiT-tagged A1AR HEK293T living cells. (A) Schematic representation of the NanoBiT internalization assay. Step 1: The first step of the assay involves the addition of the agonist (NECA) to stimulate an internalization response of HiBiT-tagged A1AR expressed at the cell membrane, whereby HiBiT-A1AR is subsequently removed from the cell membrane. Step 2: Treatment of the cells with exogenous purified LgBiT (10 nM), which is cell impermeable, reconstitutes the full-length NanoLuc luciferase, following complementation with HiBiT-tagged receptors localized at the cell surface. The addition of the substrate furimazine leads to a luminescence signal, which can be quantified. The higher the amount of receptor internalized, the lower the intensity of the signal is as a result of reduced availability of receptors on the membrane. (B) Effect of A1AR-selective antagonist DPCPX on the NECA-mediated internalization response in HiBiT-A1AR HEK293T living cells. Internalization of HiBiT-A1AR following agonist (NECA) treatment in the presence and absence of 10 nM competitive antagonist DPCPX. Cells were treated with (open symbols) or without (closed symbols) 1 μM 11 (SulfoCy5) for 1 h. Cells were washed twice prior to the addition of the competitive antagonist DPCPX, which was incubated for 10 min, followed by the addition of increasing concentrations of NECA for 2 h. The decay of the luminescence signal as a result of the loss of the receptor from the cell surface was quantified. Data are normalized to basal (in the absence of NECA treatment). Data points represent the combined mean ± SEM from n = 4 separate experiments performed in triplicate.
Figure 6
Figure 6
Live-cell confocal microscopy studies of (A) SulfoCy5-conjugated 11 (125 nM) and (C) PEG-TCO-conjugated 12 (50 nM) labeling SNAP-hA1AR HEK293T cells at 37 °C in the absence (A and C, top frames) and presence (pretreatment) of (A and C, middle frames) 10 μM DPCPX. Cells were labeled with membrane impermeable SNAP-AF488 for 30 min prior to treatment with 11 and 12 for 2 h, respectively, with the latter followed by the addition of 1 μM methyltetrazine (Met-Tet) SulfoCy5 for 5 min prior to the acquisition of the single equatorial images. (A) and (C) (bottom frames) cells were treated for 1 h with 10 μM DPCPX after the ligand-directed labeling reactions with 11 and 12 had occurred (2 h). For all the conditions, left-hand frames represent the SulfoCy5 channel (magenta), middle frames are the SNAP-hA1AR AF488 (green) channel, and right-hand frames represent merged images of both channels, with white indicating the overlap of magenta and green. (B, E) Fluorescence intensity plots (16-bit) were generated for both SulfoCy5 and AF488 channels by hand drawing the region of interest (ROI) in images obtained as indicated in (A) and (C) using ImageJ (FIJI). Data points represent membrane fluorescence signals measured from ROI drawn in each cell, and error bars represent mean ± standard deviation (SD). Images are representative of images obtained from three independent experiments from which 72 to 83 cells were analyzed. Scale bars are = 13 μm for (A) and 10 μm for (C). (D) Schematic representation of the biorthogonal IEDDA reaction between the TCO group (covalently attached to the hA1AR by ligand-directed chemistry) and SulfoCy5-conjugated methyltetrazine (MetTet-SulfoCy5). Following the click IEDDA reaction, the formation of the 4,5-dihydropyridazine cycloadduct increases the fluorescence intensity of the fluorophore conjugated to the tetrazine moiety.
Figure 7
Figure 7
Confocal microscopy images of SulfoCy5-bioconjugated SNAP-A1AR HEK293T cells by probe 11 treated with the A1AR-selective agonist CCPA (bottom frames) or vehicle (top frames) for 2 h. Cells were immunolabeled with the Anti-Rab5 monoclonal antibody and visualized by treatment with AF488-conjugated secondary antibody (middle frames, green channel). Right-hand frames show merged images of both magenta and green channels. The white arrows in the bottom right-hand side frame show areas where colocalization of intracellular SulfoCy5-labeled A1AR populations with endosomal Rab5 compartments was observed. The confocal images are representative of images acquired from three independent experiments. Scale bar: 5 μm.
Figure 8
Figure 8
Fluorescence correlation spectroscopy studies of SulfoCy5-bioconjugated A1AR 11 on SNAP-A1AR HEK293 cells. (A) Confocal imaging of probe 11 (100 nM) and SNAP-AF488 (100 nM), used to aid membrane placement, scale bar represents 20 μm. (B) Illustration of the placement of the confocal observation volume used to record fluorescence fluctuations as SulfoCy5-labeled species diffuse within the lipid bilayer of the cell membrane; figures are prepared in BioRender (www.biorender.com). (C) Fluorescence fluctuation trace recorded on the apical membrane of SNAP-A1AR HEK293T cells treated with 11 alone and after preincubation with DPCPX (D, 10 μM). (E) Autocorrelation curves constructed from fluorescence traces (C, D), fit with a 1 × 3D 1 × 2D diffusion model (red line), with deviation from fit (right). (F) Diffusion coefficients (D, μm2/s), (G) particle number (N, μm2) and (H) molecular brightness (ε, cpm/s) from individual FCS measurements from 42 individual cells taken over 5 independent experiments. Mean ± SEM values of all measurements are shown by line and error bars.
Figure 9
Figure 9
Live-cell confocal imaging of dorsal root ganglion (DRG) neurons labeled with SulfoCy5 by ligand-directed chemistry using probe 11 (250 nM). Cells were labeled in the presence (bottom frames) or absence (top frames) of 10 μM DPCPX. Left-hand side frames represent the SulfoCy5 channel, middle frames represent brightfield and right-hand side frames represent merged images from both channels. Images are representative of images acquired in four independent experiments. Scale bar: 10 μm.

Similar articles

Cited by

References

    1. Sletten E. M.; Bertozzi C. R. Bioorthogonal Chemistry: Fishing for Selectivity in a Sea of Functionality. Angew. Chem., Int. Ed. 2009, 48 (38), 6974–6998. 10.1002/anie.200900942. - DOI - PMC - PubMed
    1. Tamura T.; Hamachi I. Chemistry for Covalent Modification of Endogenous/Native Proteins: From Test Tubes to Complex Biological Systems. J. Am. Chem. Soc. 2019, 141 (7), 2782–2799. 10.1021/jacs.8b11747. - DOI - PubMed
    1. Keppler A.; Gendreizig S.; Gronemeyer T.; Pick H.; Vogel H.; Johnsson K. A General Method for the Covalent Labeling of Fusion Proteins with Small Molecules in Vivo. Nat. Biotechnol. 2003, 21 (1), 86–89. 10.1038/nbt765. - DOI - PubMed
    1. Los G. V.; Al D.; Learish R.; McDougall M. G.; Encell L. P.; Friedman-Ohana R.; Wood M.; Vidugiris G.; Zimmerman K.; Otto P.; Klaubert D. H.; Wood K.. One Fusion Protein: Multiple Functions, Promega Notes 89, 2005; pp 2–6.
    1. Tian H.; Furstenberg A.; Huber T. Labeling and Single-Molecule Methods to Monitor G Proteincoupled Receptor Dynamics. Chem. Rev. 2017, 117 (1), 186–245. 10.1021/acs.chemrev.6b00084. - DOI - PubMed

Publication types

LinkOut - more resources