. 2024 Sep;11(35):e2405677.
doi: 10.1002/advs.202405677. Epub 2024 Jul 12.

Mid-Infrared Photoacoustic Stimulation of Neurons through Vibrational Excitation in Polydimethylsiloxane

Affiliations

Mid-Infrared Photoacoustic Stimulation of Neurons through Vibrational Excitation in Polydimethylsiloxane

Zhiyi Du et al. Adv Sci (Weinh). 2024 Sep.

Abstract

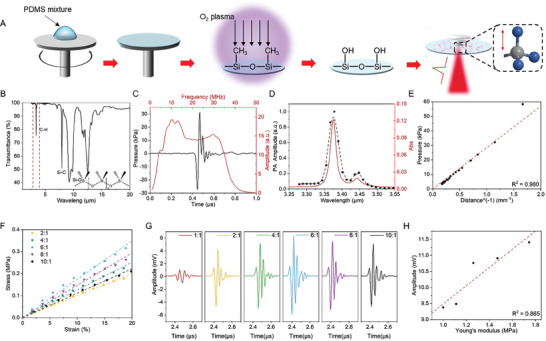
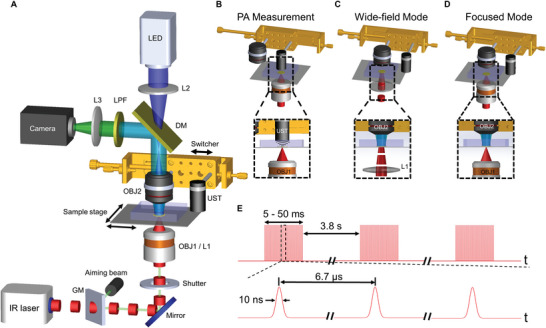
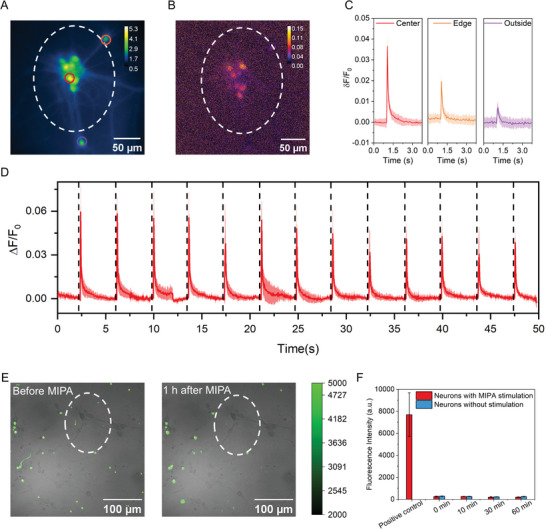
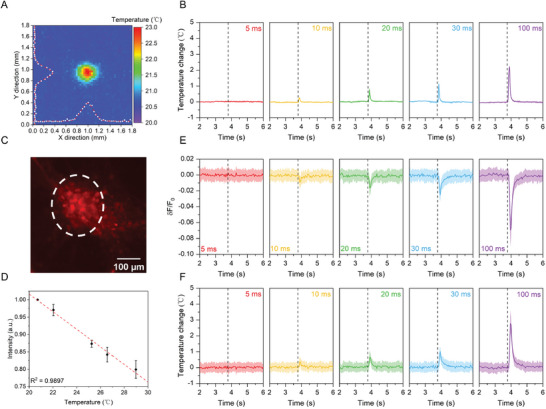
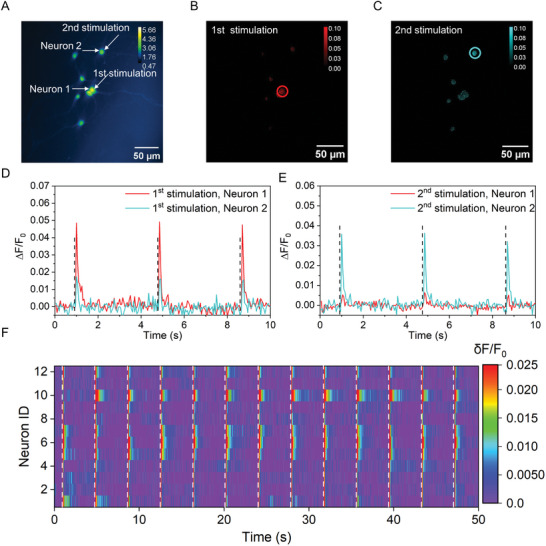
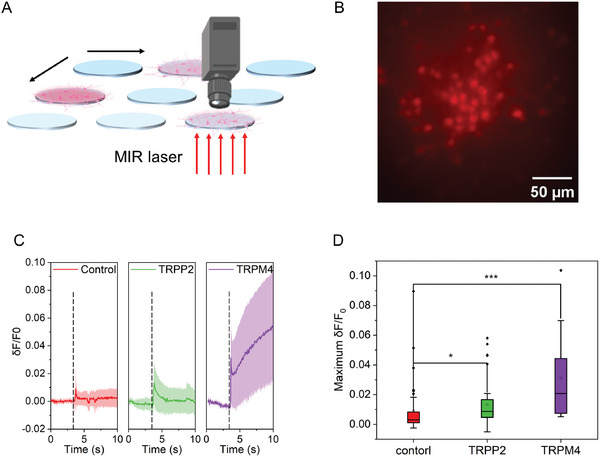
Photoacoustic (PA) emitters are emerging ultrasound sources offering high spatial resolution and ease of miniaturization. Thus far, PA emitters rely on electronic transitions of absorbers embedded in an expansion matrix such as polydimethylsiloxane (PDMS). Here, it is shown that mid-infrared vibrational excitation of C─H bonds in a transparent PDMS film can lead to efficient mid-infrared photoacoustic conversion (MIPA). MIPA shows 37.5 times more efficient than the commonly used PA emitters based on carbon nanotubes embedded in PDMS. Successful neural stimulation through MIPA both in a wide field with a size up to a 100 µm radius and in single-cell precision is achieved. Owing to the low heat conductivity of PDMS, less than a 0.5 °C temperature increase is found on the surface of a PDMS film during successful neural stimulation, suggesting a non-thermal mechanism. MIPA emitters allow repetitive wide-field neural stimulation, opening up opportunities for high-throughput screening of mechano-sensitive ion channels and regulators.

Keywords: mid‐infrared; neural stimulation; photoacoustic.


Conflict of interest statement

C.Y. and J.X.C. serve as Scientific Advisor for Axorus. CY received a research grant from Axorus, which did not support this work. C.Y. and J.X.C. have a patent on Methods and Devices for Optoacoustic Stimulation (US Patent No. 11684404 B2) issued.

Figures

Figure 1
Figure 1
PDMS: The bond selective photoacoustic (PA) emitter. A) Schematic of the fabrication of the hydrophilic PDMS film as a transparent and biocompatible MIPA emitter. B) FTIR spectrum of the PDMS film. Inset: the chemical structure of PDMS. C) The photoacoustic waveform in the time domain (Black) and frequency domain (Red) of a 25‐µm thick PDMS film. D) The normalized PA amplitude and the absorption spectrum of a 25‐µm thick PDMS film in the mid‐infrared region. Black dots: photoacoustic pressure measured by a 25 MHz ultrasound transducer. Black dashed curve: B‐spline fitted curve for the PA spectrum. Red curve: Absorbance. E) Initial peak‐to‐peak photoacoustic pressures measured at different distances from the PA film. Black dots: experimental data. Red dashed line: the fitted curve. F) Stretching stress versus stretching strain of PDMS films prepared with different base‐to‐agent ratios. Dashed lines: linear fitted curves. G) Representative waveforms measured from different samples in Figure 1F. H) The PA amplitude measured and obtained from Figure 1G as a function of Young's modulus. Laser condition for this figure: 3.38 µm wavelength, 10 ns pulse width, 0.2 µJ pulse energy.
Figure 2
Figure 2
Multifunctional MIPA Optical System. A) Schematic of the system. B) Photoacoustic characterization module. Zoom‐in: focused MIR laser pulses excite the PDMS film to generate the PA wave, which is collected by a focused ultrasonic transducer (UST). The MIR beam and ultrasound transducer are confocally aligned. C) Wide‐field mode. The CaF2 lens weakly focuses IR beam on the sample plane for wide‐field neuron stimulation (Inset). D) High‐precision mode. A high‐NA reflective objective focuses the IR beam tightly to provide high‐precision neural stimulation (Inset). GM, germanium window. OBJ1, reflective objective. L1, CaF2 lens. UST, ultrasonic transducer. OBJ2, visible objective. DM, dichroic mirror. LPF, long pass filter. L2, L3, A‐coating lens. E) Schematic of MIR pulse train used.
Figure 3
Figure 3
Wide‐field MIPA neural stimulation. A) A representative calcium image of Oregon green labeled cortical neurons at DIV12 cultured on the PDMS film. Dashed line: the illumination area. Solid circles: representative neurons at the center of the illumination area (red), edge of the illumination area (orange), and outside of the illumination area (purple). The inserted Color bar represents the relative fluorescence intensity. B) Map of the maximum ΔF/F0 of the same view field in Figure 3A. F0 is the average fluorescence before stimulation. Laser condition: 0.4 µJ pulse energy, 150 kHz repetition rate, 5 ms duration. C) Average calcium traces obtained from the solid circled neurons upon MIPA stimulation in Figure 3A correspondingly. Shaded areas: one standard deviation, obtained from 20‐time repeats on the same neurons. D) The average calcium trace of neurons in the illumination area in wide‐field MIPA stimulation (n = 12). Shaded areas: one standard deviation. Black dashed lines: laser onset. E) Microscope images of Sytox Green nucleus acid staining of neurons before and 1 h after wide‐field MIPA stimulation. Gray channel: bright field microscope images. Green channel: fluorescence images. Laser condition: 10 ms duration, 0.4 µJ pulse energy. White circles indicate the MIPA stimulation area. F) Comparison of fluorescence intensities of neurons stained with Sytox Green before and at different time points in both the control group and MIPA stimulation group. Before MIPA stimulation, the Sytox‐labeled nucleus of dead neurons was used as the positive control.
Figure 4
Figure 4
Thermal effect during MIPA stimulation. A) Temperature distribution on the top surface of PDMS after 100 ms MIR irradiation taken by a thermal camera. White dots: temperature measured along X = 1 and Y = 1, respectively. Red dashed lines: Gaussian fits of temperature measured. B) Average maximum temperature measured based on three trials with different locations of the same PDMS sample for each laser duration. Black dashed lines: MIR laser onset. C) A representative fluorescent image of mCherry labeled cortical neurons at DIV10 cultured on a 71 µm thick PDMS film. The white dashed circle: the MIR illumination area. D) Normalized fluorescence intensity of mCherry labeled cortical neurons (n = 5) at different temperatures controlled  by a dish heater. Error bars: one standard deviation of normalized fluorescence intensity of five different neurons. E) Average fluorescence intensity change of neurons (n = 52) in five different fields of view under MIR illumination areas with different MIR durations. Black dashed lines: MIR laser onset. Shaded areas: one standard deviation. F) The calculated average temperature increase of neurons in Figure 4E is based on the calibration curve in Figure 4D. Shaded areas: one standard deviation.
Figure 5
Figure 5
High‐precision MIPA neural stimulation. A) Representative calcium image of Oregon Green labeled cortical neurons at DIV12 cultured on the PDMS film before sequential MIPA stimulation. White arrows indicate the targeted neurons. The color scale represents relative fluorescence intensity. B,C) Maps of the maximum ΔF/F0 induced by two sequential MIPA stimulations. Red: the first stimulation. Cyan: the second stimulation. Laser condition: 0.1 µJ pulse energy, 150 kHz repetition rate, 15 ms duration. Solid circles: 1st stimulated area (red) and 2nd stimulated area (cyan). Color scales represent ΔF/F0. D–E) Corresponding calcium traces of Neuron1 and Neuron2 during two sequential MIPA stimulation in Figure 5B,C. Black dashed lines: the laser onset. D) the first MIPA stimulation. E) the second MIPA stimulation. F) The heatmap of fluorescence change in neurons cultured on the PDMS film under the illumination area. White dashed: the onset of the laser.
Figure 6
Figure 6
Neurons overexpressed with different ion channels show distinct responses under wide‐field MIPA stimulation. A) Schematic of wide‐field MIPA stimulation based high throughput cell screening. MIR laser was weakly focused on the bottom surface of PDMS and a 2D stage was used to control the targeted wells. B) A representative fluorescence image of mCherry labelled, TRPM4 overexpressed cortical neurons in DIV 12. C) Average calcium traces of wild‐type neurons (red, n = 40), TRPP2 overexpressed neurons (green, n = 38), and TRPM4 overexpressed neurons (purple, n = 14) cultured on 71 µm thick PDMS films. Laser condition: 0.2 µJ pulse energy, 150 kHz repetition rate. The shaded areas: one standard deviation. Black dashed: laser onset. D) Comparison of the maximum fluorescence intensity changes obtained in Figure 6C. (n > 14, *p < 0.05, ***p < 0.001, n.s. p = 0.147, Kruskal‐Wallis ANOVA test.).

Similar articles

Cited by

References

    1. Guo R., Lu G., Qin B., Fei B., Ultrasound Med Biol 2018, 44, 37. - PMC - PubMed
    1. Ikeda T., Yoshizawa S., Koizumi N., Mitsuishi M., Matsumoto Y., in (Eds.: Escoffre J.‐M., Bouakaz A.), Springer International Publishing, Cham: 2016.
    1. Xu Z., Hall T. L., Vlaisavljevich E., Lee F. T., Int. J. Hyperthermia 2021, 38, 561. - PMC - PubMed
    1. a) Yu K., Niu X., Krook‐Magnuson E., He B., Nat. Commun. 2021, 12, 2519; - PMC - PubMed
    2. b) Rabut C., Yoo S., Hurt R. C., Jin Z., Li H., Guo H., Ling B., Shapiro M. G., Neuron 2020, 108, 93; - PMC - PubMed
    3. c) Jiang L., Lu G., Zeng Y., Sun Y., Kang H., Burford J., Gong C., Humayun M. S., Chen Y., Zhou Q., Nat. Commun. 2022, 13, 3853; - PMC - PubMed
    4. d) Fry W. J., Fry F. J., Barnard J. W., Krumins R. F., Brennan J. F., Science 1955, 122, 517. - PubMed
    1. a) Tyler W. J., Tufail Y., Finsterwald M., Tauchmann M. L., Olson E. J., Majestic C., PLoS One 2008, 3, e3511; - PMC - PubMed
    2. b) Xu C., Lu G., Kang H., Humayun M. S., Zhou Q., Micromachines (Basel) 2022, 13, 13091536. - PMC - PubMed

LinkOut - more resources