. 2024 Jun 29;13(13):1127.
doi: 10.3390/cells13131127.

Adult Human Brain Tissue Cultures to Study NeuroHIV

Affiliations

Adult Human Brain Tissue Cultures to Study NeuroHIV

Rachel Van Duyne et al. Cells. .

Abstract

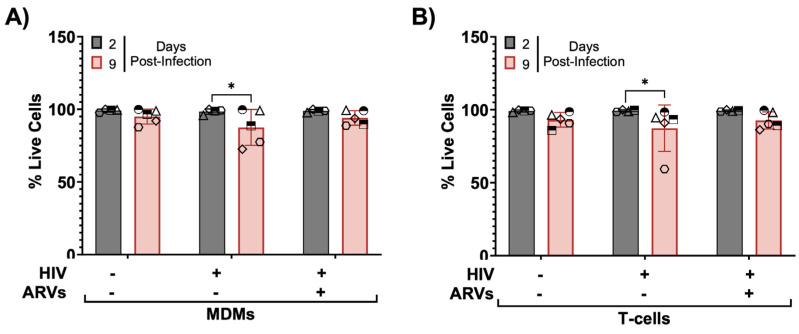
HIV-associated neurocognitive disorders (HAND) persist under antiretroviral therapy as a complex pathology that has been difficult to study in cellular and animal models. Therefore, we generated an ex vivo human brain slice model of HIV-1 infection from surgically resected adult brain tissue. Brain slice cultures processed for flow cytometry showed >90% viability of dissociated cells within the first three weeks in vitro, with parallel detection of astrocyte, myeloid, and neuronal populations. Neurons within brain slices showed stable dendritic spine density and mature spine morphologies in the first weeks in culture, and they generated detectable activity in multi-electrode arrays. We infected cultured brain slices using patient-matched CD4+ T-cells or monocyte-derived macrophages (MDMs) that were exposed to a GFP-expressing R5-tropic HIV-1 in vitro. Infected slice cultures expressed viral RNA and developed a spreading infection up to 9 days post-infection, which were significantly decreased by antiretrovirals. We also detected infected myeloid cells and astrocytes within slices and observed minimal effect on cellular viability over time. Overall, this human-centered model offers a promising resource to study the cellular mechanisms contributing to HAND (including antiretroviral toxicity, substance use, and aging), infection of resident brain cells, and new neuroprotective therapeutics.

Keywords: HIV-1 infection; HIV-associated neurocognitive disorders (HAND); dendritic spine analysis; human brain organotypic slice cultures; microelectrode array.


Conflict of interest statement

The authors declare that the research was conducted in the absence of any commercial or financial relationships that could be construed as a potential conflict of interest. (Author Atom Sarkar was employed by the company Global Neurosciences Institute, LLC. The company had no role in the design of the study; in the collection, analyses, or interpretation of data; in the writing of the manuscript, or in the decision to publish the results.)

Figures

Figure 1
Figure 1
Donor screening and slice culture workflow. (A) Example MRI imaging of a suitable brain tissue donor with a deep brain pathology that required partial resection of cortical tissues to access. The left image shows a deep lesion in blue, while the right shows a similar section that highlights peri-lesional edema in pink. The right image also shows a multi-colored arrow demonstrating the optimal surgical path to the lesion that avoids eloquent brain. Our slice cultures only used the radiographically normal tissues marked by the yellow part of the incision path. (B) Flowchart of the slice culture protocol. Figure generated with BioRender. (C) Immunofluorescence staining of brain slices. Select brain slices were processed with a tissue clearing protocol and stained for either the neuronal marker microtubule-associated protein 2 (MAP2—magenta), the astrocyte marker glial fibrillary acidic protein (GFAP—green), or the microglia marker transmembrane protein 119 (TMEM 119—magenta). Slices were counterstained with Hoechst (cyan) to visualize cellular nuclei.
Figure 2
Figure 2
Cellular viability of slice cultures over time. (A) Flowchart describing the process of characterizing cellular viability and identifying CNS cell types over 4 weeks in vitro (WIV) via multiparameter flow cytometry. Figure generated with BioRender. (B) Hierarchical gating strategy for multiparameter flow cytometry. Example raw data shown from one case at WIV 2. (C) The overall cellular viability of slices shown as the percentage of live cells per week. The red dashed line indicates 80% viability. WIV 1–3, N = 15; WIV 4, N = 14) Independent cases are represented by unique symbols in the graph. Data plotted as mean ± SD and analyzed by one-way ANOVA with Dunnett’s post hoc.
Figure 3
Figure 3
Dendritic spine density and morphology in slice culture. (A) Flowchart of dendritic spine labeling and analysis. Figure generated with BioRender. (B) Representative images of human dendrites stained with DiI (top, grayscale) and analyzed with Neurolucida 360 software (bottom, pseudo-color) from each experimental timepoint. Scale bar = 10 μm. Analyzed images highlight dendrites (red), filopodia (yellow), thin spines (white), mushroom spines (blue), and stubby spines (green). (C) Overall dendritic spine density over the culture lifetime. Each experimental timepoint examined at least 3 dendrites per slice from 3–4 slices. Data averaged from 3 cases and analyzed by one-way ANOVA with Dunnett’s post hoc, **** p < 0.0001. (D) Dendritic spine density from panel (C) broken down by spine morphology. Data analyzed by two-way ANOVA with Dunnett’s post hoc **** p < 0.0001, *** p < 0.001, ** p < 0.01, * p < 0.05.
Figure 4
Figure 4
Acute slice activity recordings with multi-electrode arrays. (A) Schematic of multi-electrode array grid (top image), which contacts an acute brain slice (bottom image) to record local field potentials over time. (B) Neuronal activity quantifications. Tissues from three cases were recorded and analyzed for overall number of spikes (left) and the total number of single-electrode bursts (right) over the same baseline and treatment periods. N = 6 slices (2 slices per donor), data analyzed by one-way repeated measures ANOVA with Tukey’s post hoc, * p < 0.05. (C) Example voltage traces from one row of electrodes over an entire 90 min recording session. Colored overlays indicate 20 min recording periods analyzed at baseline (gray) or after treatments (depolarizing aCSF: pink, TTX: teal). (D) The same example voltage traces analyzed for voltage spikes (green bars) and single-electrode bursts (red dots) using Multi Channel Analyzer software v.2.18.0.21200. (E) Heatmaps from one recording session showing the number of spikes recorded at each electrode during the three analysis periods. Gray squares indicate electrodes that failed to record physiological values and were thus not representative of tissue activity.
Figure 5
Figure 5
Schematic of slice culture infection protocol. Whole blood collected before brain tissue resection (DIV 0) was used to purify patient-matched CD4+ T-cells and monocytes. T-cells were then activated with PHA/IL-2 and monocytes were differentiated into MDMs with human serum and MCSF. At DIV 3, cells were washed, counted, and infected with HIVBaL-GFP. Then, at DIV 5, infected T-cells and MDMs were washed, counted, and used to inoculate their patient-matched slice cultures in the presence or absence of ARVs. From DIV 7–14, we tracked the slice culture media for viral p24 alphaLISA, and examined slices for viral RNA using qPCR, and GFP+-infected cell types using flow cytometry. Figure generated with BioRender.
Figure 6
Figure 6
HIV replication kinetics in slice cultures. (A) MDM-based infections. Quantification of HIV p24 gag levels in culture media (pg/mL) with background subtracted (inoculum-specific uninfected) as a readout of viral replication kinetics over 9 days post-infection. Uninfected tissues are plotted as black lines (all at bottom of graph), while infected tissues are plotted as solid green lines indicating cases of spreading infection and dashed green lines indicating cases where infection failed to spread. (B) p24 gag levels from MDM-infected slices compared to parallel slices infected and treated with ARVs. Data shown normalized to untreated tissues from the same donor at day 9 post-infection. (C) T-cell-based infections. HIV p24 gag levels were quantified over time as in (A), except blue solid lines indicate spreading infection while blue dotted lines indicate cases where infection failed to spread. (D) Similar to panel B, p24 gag levels from T-cell-infected slices compared to parallel slices infected and treated with ARVs at day 9 post-infection. Data represent virus production from one slice per condition. Independent cases shown as unique symbols on the graphs; (A) Day 2, 4, 9, N = 9; Day 7, N = 8; (B): N = 3; (C): Day 2, 4, 9, N = 10; Day 7, N = 9; (D) N = 5. Data from panel (B,D) are plotted as mean ± SD and analyzed by two-tailed, unpaired t-test, **** p < 0.0001.
Figure 7
Figure 7
Viral RNA measurements from infected slice cultures. (A) ΔΔCt values were calculated comparing MDM-inoculated and T-cell-inoculated slices to uninfected controls. MDM, N = 8; T-cell, N = 7, data analyzed by two-tailed, unpaired t-test compared to uninfected, * p < 0.05. The fold change in gag expression in slices inoculated with MDMs (B) or T-cells (C) in the presence of ARVs (dashed bars) normalized to untreated (solid bars). Data plotted as mean ± SD of independent cases with individual data points per case indicated by unique symbols: (B) N = 6; (C) N = 7. Data analyzed by two-tailed, unpaired t-test, * p < 0.05, **** p < 0.0001.
Figure 8
Figure 8
Tissue viability throughout infection and ARV treatment. Slices from (A) MDM-infected tissue or (B) T-cell-infected tissues analyzed for viability by flow cytometry. Gating was performed as indicated in Figure 2. Data per case represent dissociated cells from one slice per condition per timepoint. Data plotted as mean ± SD of independent cases (shown as unique symbols) and analyzed by two-way ANOVA with Tukey’s post hoc * p < 0.05; N = 5.
Figure 9
Figure 9
Identification of GFP+-infected cells from inoculated slices. Ex vivo human brain slices were inoculated with HIV-1-infected MDMs (A,B,D) or T-cells (A,C,E), collected at days 2 and 9 post-infection, and analyzed for infected subcellular populations via flow cytometry. (A) Example dot plots from live GFP+ cells from one case at day 2 post-infection, indicating GFP+ gating from uninfected slices or those inoculated with infected MDMs or T-cells (green) with or without ARV treatment. Gating was performed as indicated and subcellular populations defined as in Figure 2B (astrocytes—red; myeloid—purple; neurons—blue). The %GFP+ cells of the indicated populations were determined by gating on the matched uninfected inoculum such that the GFP+ percentage of the control was ≤0.1%. GFP+ cell counts from each subcellular population per case per timepoint per inoculum were normalized to the sum of GFP+ astrocytes, myeloid cells, and neurons. “ND” is not detected and is indicated when values are less than 0.001%. Green numbers above each bar indicate the raw counts of GFP+ cells and the associated percent of the total number of live cells (indicated in black below the x-axis). Black numbers within each bar indicate the raw counts of GFP+ cells within each subpopulation. (B) MDM-inoculated slices at day 2 post-infection, N = 3; (C) T-cell-inoculated slices at day 2 post-infection, N = 3; (D) MDM-inoculated slices at day 9 post-infection, N = 3; (E) T-cell-inoculated slices at day 9 post-infection, N = 4. Data per case represent dissociated cells from one slice per condition per time point.

References

    1. van Schalkwyk C., Mahy M., Johnson L.F., Imai-Eaton J.W. Updated Data and Methods for the 2023 UNAIDS HIV Estimates. J. Acquir. Immune Defic. Syndr. 2024;95:e1–e4. doi: 10.1097/QAI.0000000000003344. - DOI - PMC - PubMed
    1. Ellis R.J., Marquine M.J., Kaul M., Fields J.A., Schlachetzki J.C.M. Mechanisms underlying HIV-associated cognitive impairment and emerging therapies for its management. Nat. Rev. Neurol. 2023;19:668–687. doi: 10.1038/s41582-023-00879-y. - DOI - PMC - PubMed
    1. Chan P., Brew B.J. HIV associated neurocognitive disorders in the modern antiviral treatment era: Prevalence, characteristics, biomarkers, and effects of treatment. Curr. HIV/AIDS Rep. 2014;11:317–324. doi: 10.1007/s11904-014-0221-0. - DOI - PubMed
    1. Rosenthal J., Tyor W. Aging, comorbidities, and the importance of finding biomarkers for HIV-associated neurocognitive disorders. J. Neurovirol. 2019;25:673–685. doi: 10.1007/s13365-019-00735-0. - DOI - PMC - PubMed
    1. Chan P., Valcour V. Neurocognition and the Aging Brain in People with HIV: Implications for Screening. Top. Antivir. Med. 2022;29:423–429. - PMC - PubMed

Publication types

LinkOut - more resources