. 2024 Jul 2;13(13):1138.
doi: 10.3390/cells13131138.

In Vivo Monitoring of Fabp7 Expression in Transgenic Zebrafish

Affiliations

In Vivo Monitoring of Fabp7 Expression in Transgenic Zebrafish

Sol Pose-Méndez et al. Cells. .

Abstract

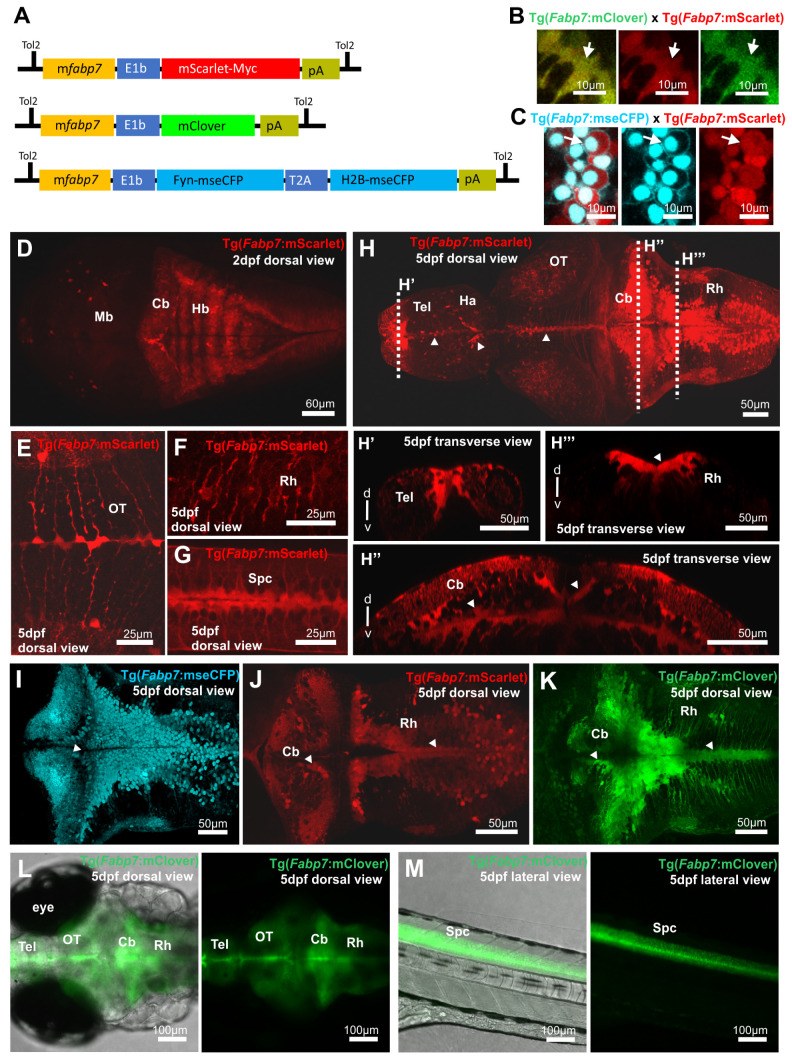
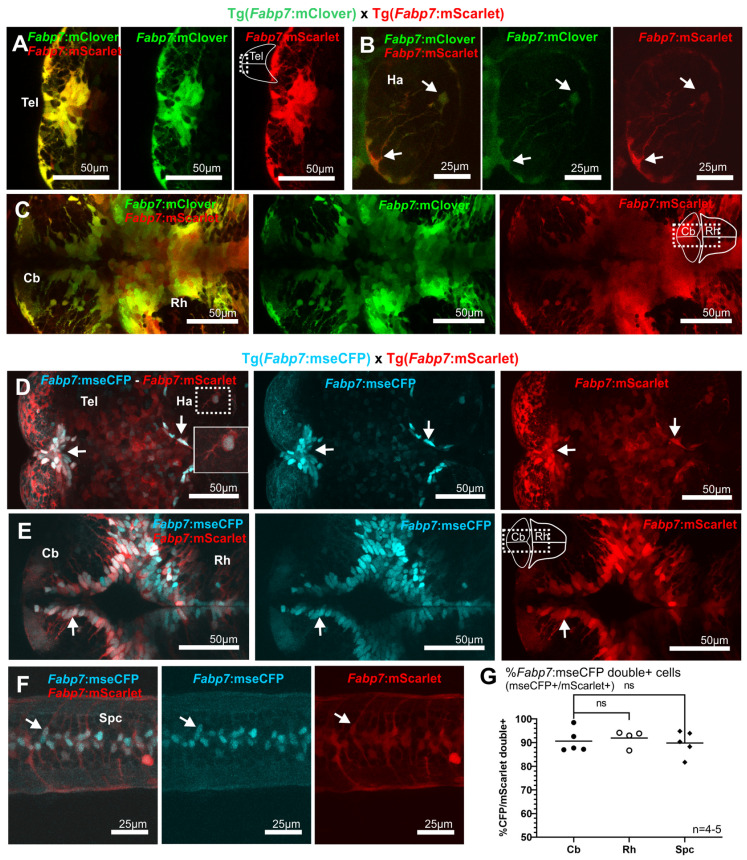
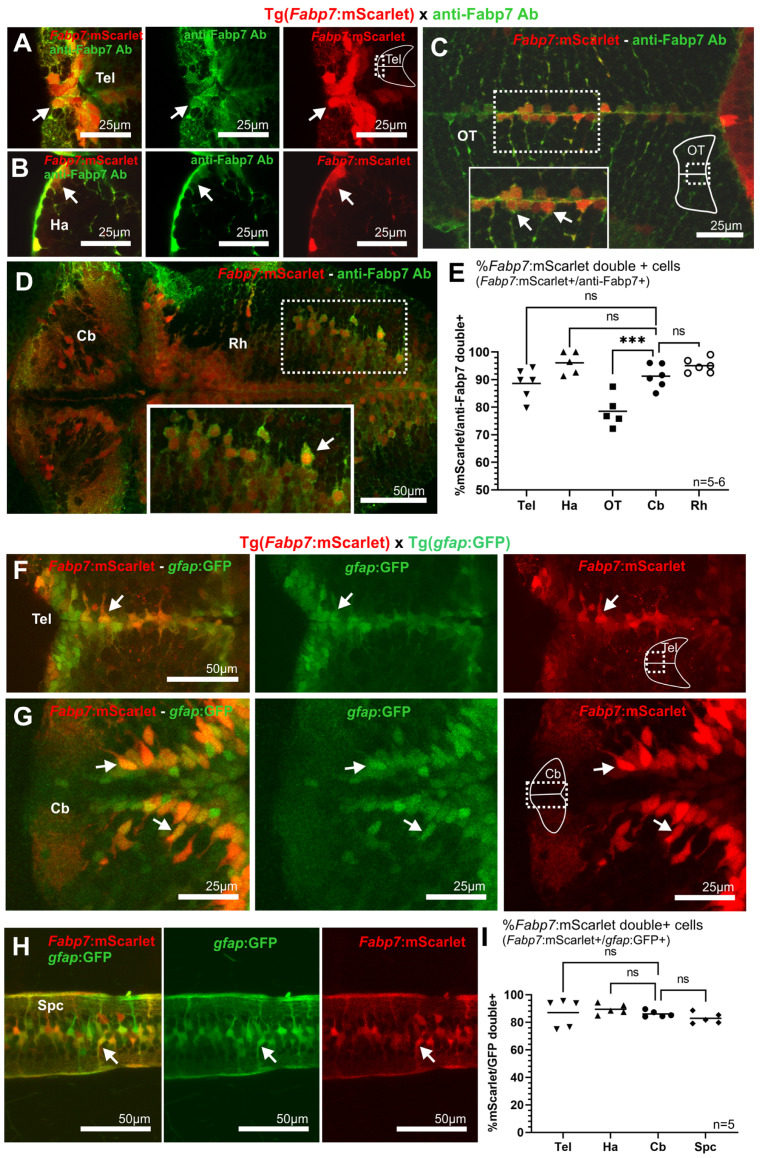
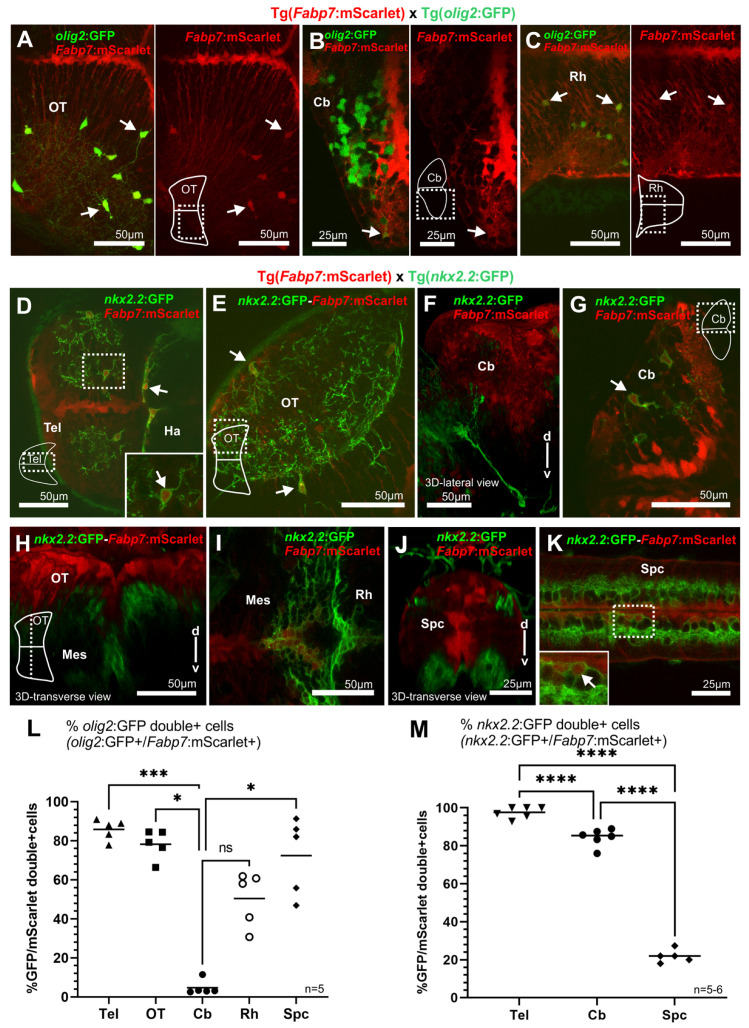
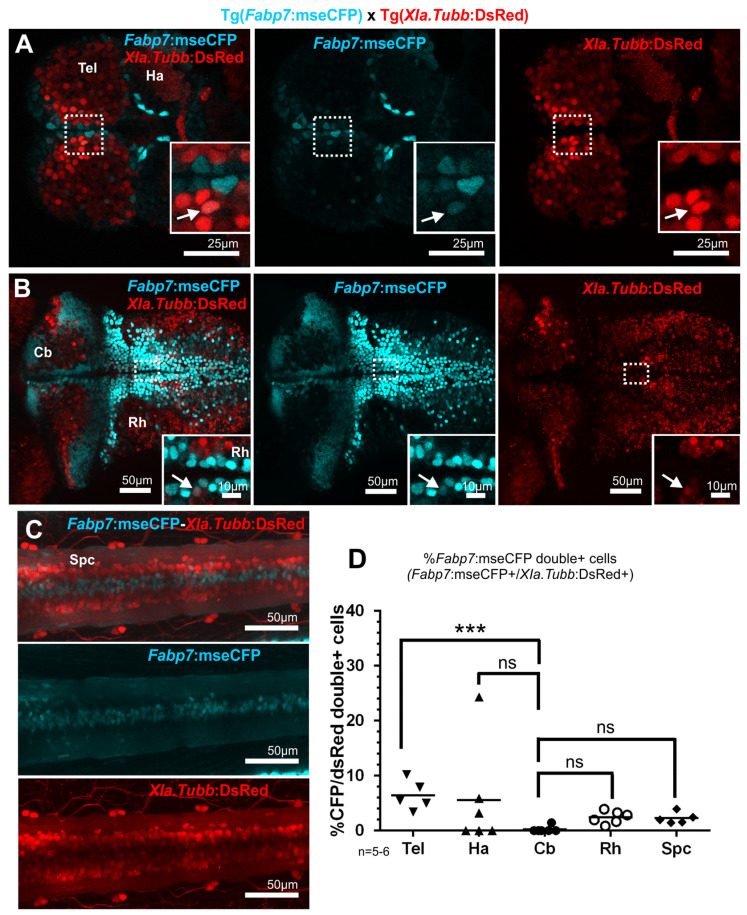
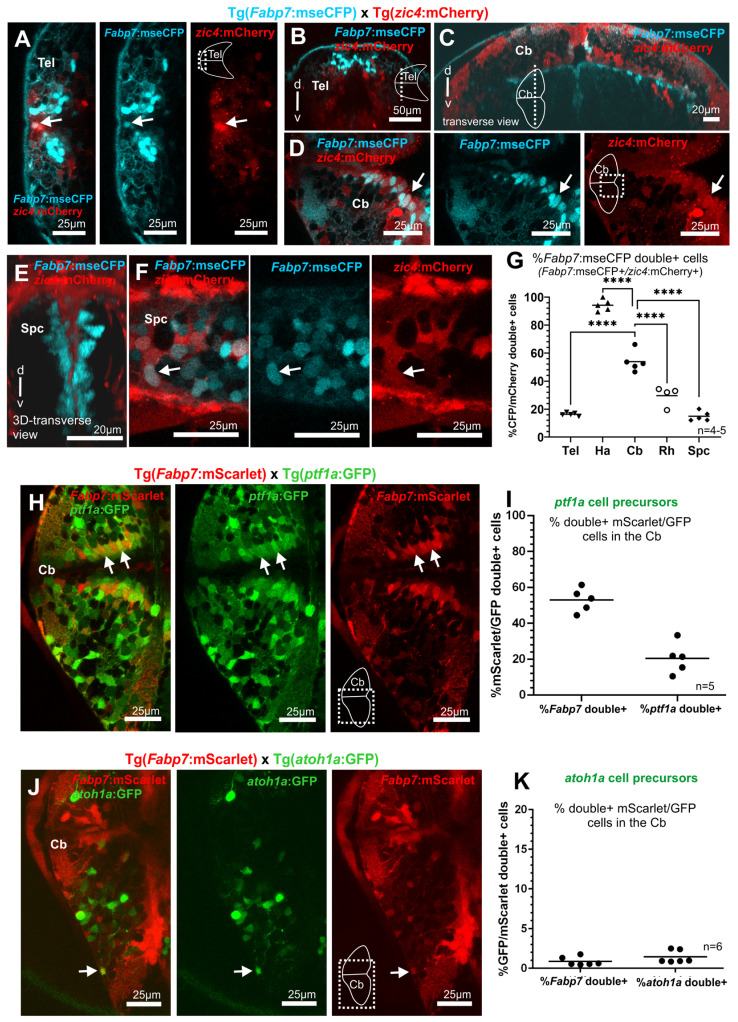
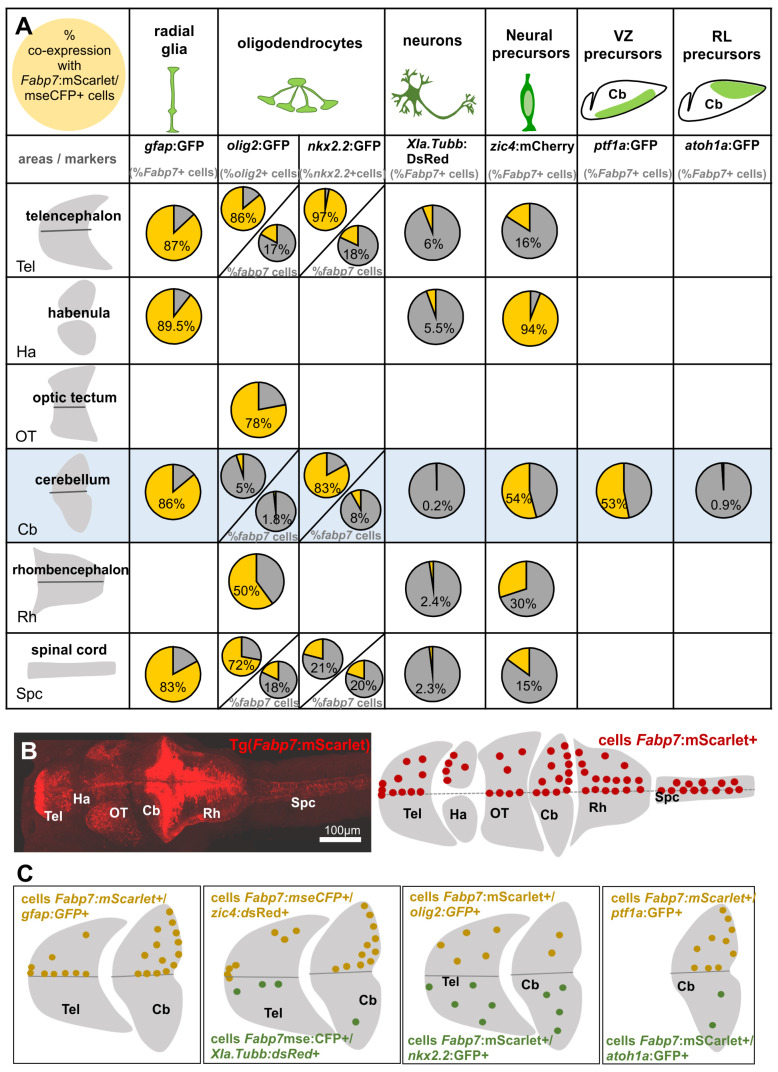
In zebrafish, like in mammals, radial glial cells (RGCs) can act as neural progenitors during development and regeneration in adults. However, the heterogeneity of glia subpopulations entails the need for different specific markers of zebrafish glia. Currently, fluorescent protein expression mediated by a regulatory element from the glial fibrillary acidic protein (gfap) gene is used as a prominent glia reporter. We now expand this tool by demonstrating that a regulatory element from the mouse Fatty acid binding protein 7 (Fabp7) gene drives reliable expression in fabp7-expressing zebrafish glial cells. By using three different Fabp7 regulatory element-mediated fluorescent protein reporter strains, we reveal in double transgenic zebrafish that progenitor cells expressing fluorescent proteins driven by the Fabp7 regulatory element give rise to radial glia, oligodendrocyte progenitors, and some neuronal precursors. Furthermore, Bergmann glia represent the almost only glial population of the zebrafish cerebellum (besides a few oligodendrocytes), and the radial glia also remain in the mature cerebellum. Fabp7 regulatory element-mediated reporter protein expression in Bergmann glia progenitors suggests their origin from the ventral cerebellar proliferation zone, the ventricular zone, but not from the dorsally positioned upper rhombic lip. These new Fabp7 reporters will be valuable for functional studies during development and regeneration.

Keywords: Bergmann glia; Fabp7; cell progenitors; cerebellum; neurons; oligodendrocytes; radial glia; transgenic line; zebrafish.


Conflict of interest statement

The authors declare no conflict of interest. The funders had no role in the design of the study, in the collection, analyses, or interpretation of data, in the writing of the manuscript, or in the decision to publish the results.

Figures

Figure 1
Figure 1
Transgenic zebrafish reporter lines at two and five days post-fertilization (dpf) expressing fluorescent reporter proteins under control of a mouse Fatty acid binding protein 7 (Fabp7) regulatory element. (A) Schematic representation of the constructs from the transgenic reporter lines [Tg(Fabp7:mScarlet), Tg(Fabp7:mClover), and Tg(Fabp7:mseCFP)]. (B,C) Detail pictures of the double transgenic larvae Tg(Fabp7:mScarlet) × Tg(Fabp7:mClover) and Tg(Fabp7:mScarlet) × Tg(Fabp7:mseCFP), showing mScarlet and mClover expression in the cytoplasm (B,C), and mseCFP expression in the nucleus and cell membrane (C). (DM) Representative overview (D,H,IM) and detail (EG,H’H’’’) images showing the Fabp7-regulatory element mediated fluorescent protein expression pattern throughout the whole central nervous system from dorsal (EG), lateral (M), and transverse view (H’H’’’). Arrows point to double positive cells. Rostral is to the left. Abbreviations: Fabp7 Fatty acid binding protein 7 regulatory element, Tel telencephalon, Ha habenula, Cb cerebellum, HB hindbrain, MB midbrain, OT optic tectum, Rh rhombencephalon, Spc spinal cord.
Figure 2
Figure 2
Double transgenic Fabp7 enhancer-mediated reporters in zebrafish larvae at 5 dpf. (AC) Representative images of Tg(Fabp7:mScarlet) × Tg(Fabp7:mClover) double transgenic larvae showing the colocalization of both fluorescent proteins in the majority of cells. (DG) Representative images (DF) and quantitative analysis of double positive cells (G) in the Tg(Fabp7:mScarlet) × Tg(Fabp7:mseCFP) double transgenic larvae showing the colocalization of both fluorescent proteins in the majority of cells (average number and percentage of cells, corresponding to the quantification indicated in the graphs, are detailed in Supplementary Table S1). Arrows point to double positive cells. Dotted box indicates the area corresponding to detail picture (solid box) included in the figure. Rostral is to the left. Statistical method: Kruskal–Wallis multiple comparison test for nonparametric data was applied. Abbreviations: Cb cerebellum, ns no significant differences, Rh rhombencephalon, Spc spinal cord, Tel telencephalon.
Figure 3
Figure 3
Comparison of the Fabp7 enhancer-mediated reporter expression to anti-Fabp7 immunohistochemistry and radial glia expression in transgenic gfap enhancer-mediated reporter zebrafish larvae at 5 dpf. (AE) Pictures (AD) and quantitative analysis (E) of reporter protein expression in the transgenic line Tg(Fabp7:mScarlet) and the antibody anti-Fabp7. (FI) Pictures (FH) and quantitative analysis of double positive cells (I) in the double transgenic larvae Tg(Fabp7:mScarlet) × Tg(gfap:GFP) (average number and percentage of cells, corresponding to the quantification indicated in the graphs, are detailed in Supplementary Table S1). Arrows point to double positive cells. Dotted box indicates the area corresponding to detail pictures (solid box) included in the figures. Rostral is to the left. Statistical method: Ordinary one-way ANOVA, Sidák’s (E, for parametric or normal distribution data), and Kruskal–Wallis (I, for nonparametric data) multiple comparison tests were applied, level of significance: p < 0.001 (***). Abbreviations: Cb cerebellum, Ha habenula, ns no significant differences, OT optic tectum, Spc spinal cord, Tel telencephalon.
Figure 4
Figure 4
Comparison of the Fabp7 enhancer-regulated reporter expression to transgenic olig2 and nkx2.2 oligodendrocyte zebrafish reporter strains at 5 dpf. (AC,L) Pictures (AC) and quantitative analysis (L) of the double transgenic larvae Tg(Fabp7:mScarlet) × Tg(olig2:GFP). (DK,M) Pictures (DK) and quantitative analysis of double positive cells (M) in the double transgenic larvae Tg(Fabp7:mScarlet) × Tg(nkx2.2:GFP) (H,I) (average number and percentage of cells, corresponding to the quantification indicated in the graphs, are detailed in Supplementary Table S1). Arrows point to double positive cells. Dotted box indicates the area corresponding to detail picture (solid box) included in the figure. Rostral is to the left. Statistical method: ANOVA test for multiple group comparison (ordinary one-way ANOVA followed by Šidák’s multiple comparisons test for parametric or normal distribution data (M) or Kruskal–Wallis (L) for nonparametric data), level of significance: p < 0.05 (*), p < 0.001 (***), p < 0.0001 (****). Abbreviations: Cb cerebellum, Ha habenula, Mes mesencephalon, ns no significant differences, OT optic tectum, Rh rhombencephalon, Spc spinal cord, Tel telencephalon.
Figure 5
Figure 5
Comparison of the Fabp7 reporter expression to transgenic XIa.Tubb pan-neuronal zebrafish reporter strain at 5 dpf. (AD) Pictures (AC) and quantitative analysis of double positive cells (D) in the double transgenic larvae Tg(Fabp7:mseCFP) × Tg(XIa.Tubb:DsRed) (average number and percentage of cells, corresponding to the quantification indicated in the graph, are detailed in Supplementary Table S1). Arrows point to double positive cells. Dotted box indicates the area corresponding to detail pictures (solid box) included in the figures. Rostral is to the left. Statistical method: Ordinary one-way ANOVA, Kruskal–Wallis multiple comparison test for nonparametric data was applied, level of significance: p < 0.001 (***). Abbreviations: Cb cerebellum, Ha habenula, ns no significant differences, Rh rhombencephalon, Spc spinal cord, Tel telencephalon.
Figure 6
Figure 6
Zebrafish Bergmann glia in the cerebellum are derived from ptf1a enhancer-mediated fluorescent reporter expressing neural progenitor cells of the cerebellar ventricular zone. Colocalization of Fabp7 enhancer-mediated reporter expressing cells with progenitor cells in zebrafish larvae at 5 dpf. (AG) Pictures (AF) and quantitative analysis of double positive cells (G) in double transgenic larvae Tg(Fabp7:mseCFP) × Tg(zic4:mCherry). (H,I) Pictures (H) and quantitative analysis of double positive cells (I) in double transgenic larvae Tg(Fabp7:mScarlet) × Tg(ptf1a:GFP). (J,K) Pictures (J) and quantitative analysis of double positive cells (K) in double transgenic larvae Tg(Fabp7:mScarlet) × Tg(atoh1a:GFP). Arrows point to double positive cells. Rostral is to the left. The average number and percentage of cells, corresponding to the quantification indicated in the graphs, are detailed in Supplementary Table S1. Statistical method: Ordinary one-way ANOVA, Sidák’s multiple comparison test for parametric, or normal distribution data were applied, level of significance: p < 0.0001 (****). Abbreviations: Cb cerebellum, Spc spinal cord, Tel telencephalon.
Figure 7
Figure 7
Schematic summary of the percentage and distribution of cells with fluorescent reporter protein expression mediated by the mouse Fabp7 regulatory element with cells co-expressing other cell markers in different main areas of the brain and spinal cord. (A) Average of the percentage of double positive cells expressing Fabp7 enhancer-controlled fluorescent protein expression and other glial (gfap, olig2, nkx2.2), neuronal (Xla.Tubb) cell, and cell precursor (zic4, ptf1a, atoh1a) markers. In the case of oligodendrocyte markers, in addition to the percentage of Fabp7 enhancer-mediated fluorescent protein-expressing cells colabeled with olig2 and nkx2.2 enhancer-mediated fluorescent protein expression (lower chart), percentage of olig2 and nkx2.2 enhancer-mediated fluorescent protein-expressing cells colabeled with Fabp7 enhancer-mediated fluorescent protein expression is also indicated (in order to show the ratio of oligodendrocytes derived from Fabp7 expressing cells, upper chart). (B) Overview picture and schematic drawing of the distribution of Fabp7 regulatory element expressing cells. (C) Schematic drawing of the distribution of cells double positive for Fabp7 enhancer-controlled fluorescent protein expression and other specific cell markers in the telencephalon and cerebellum. Rostral is to the left. Abbreviations: Fabp7 fatty acid binding protein regulatory element 7, Cb cerebellum, Ha habenula, OT optic tectum, Rh rhombencephalon, RL rhombic lip, Spc spinal cord, Tel telencephalon, VZ ventricular zone.

Similar articles

Cited by

References

    1. Kaslin J., Kroehne V., Ganz J., Hans S., Brand M. Distinct Roles of Neuroepithelial-like and Radial Glia-like Progenitor Cells in Cerebellar Regeneration. Development. 2017;144:1462–1471. doi: 10.1242/dev.144907. - DOI - PubMed
    1. Diotel N., Vaillant C., Kah O., Pellegrini E. Mapping of Brain Lipid Binding Protein (Blbp) in the Brain of Adult Zebrafish, Co-Expression with Aromatase B and Links with Proliferation. Gene Expr. Patterns. 2016;20:42–54. doi: 10.1016/j.gep.2015.11.003. - DOI - PubMed
    1. Than-Trong E., Bally-Cuif L. Radial Glia and Neural Progenitors in the Adult Zebrafish Central Nervous System. Glia. 2015;63:1406–1428. doi: 10.1002/glia.22856. - DOI - PubMed
    1. März M., Chapouton P., Diotel N., Vaillant C., Hesl B., Takamiya M., Lam C.S., Kah O., Bally-Cuif L., Strähle U. Heterogeneity in Progenitor Cell Subtypes in the Ventricular Zone of the Zebrafish Adult Telencephalon. Glia. 2010;58:870–888. doi: 10.1002/glia.20971. - DOI - PubMed
    1. Kaslin J., Ganz J., Geffarth M., Grandel H., Hans S., Brand M. Stem Cells in the Adult Zebrafish Cerebellum: Initiation and Maintenance of a Novel Stem Cell Niche. J. Neurosci. 2009;29:6142–6153. doi: 10.1523/JNEUROSCI.0072-09.2009. - DOI - PMC - PubMed

Publication types

MeSH terms

LinkOut - more resources