. 2024 Jul 3;13(13):1142.
doi: 10.3390/cells13131142.

Identification and Characterization of ATOH7-Regulated Target Genes and Pathways in Human Neuroretinal Development

Affiliations

Identification and Characterization of ATOH7-Regulated Target Genes and Pathways in Human Neuroretinal Development

David Atac et al. Cells. .

Abstract

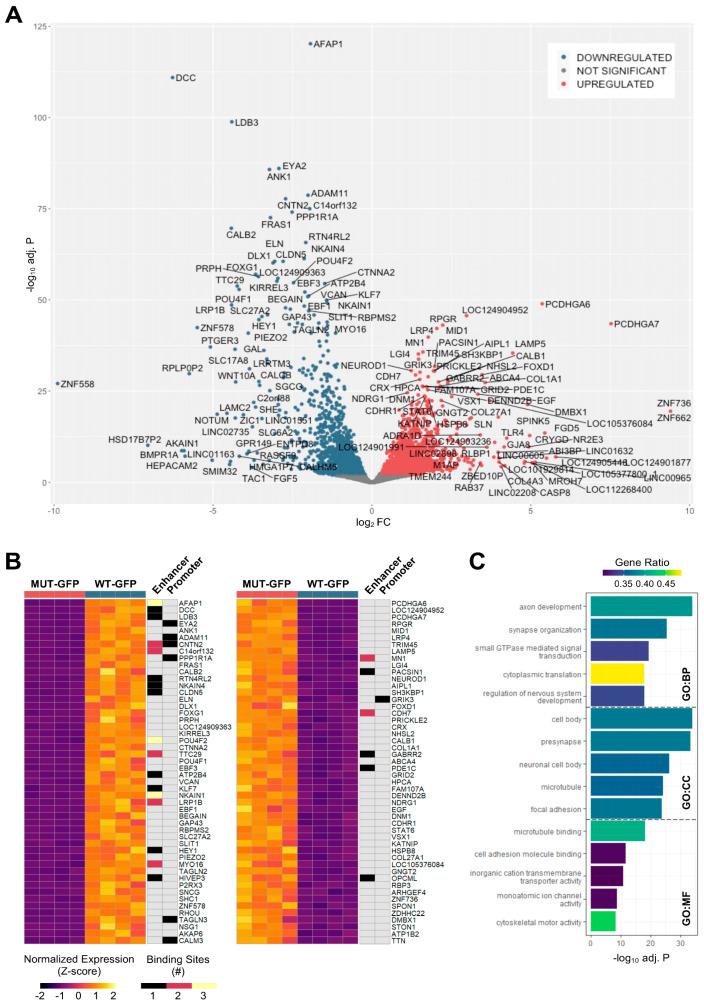
The proneural transcription factor atonal basic helix-loop-helix transcription factor 7 (ATOH7) is expressed in early progenitors in the developing neuroretina. In vertebrates, this is crucial for the development of retinal ganglion cells (RGCs), as mutant animals show an almost complete absence of RGCs, underdeveloped optic nerves, and aberrations in retinal vessel development. Human mutations are rare and result in autosomal recessive optic nerve hypoplasia (ONH) or severe vascular changes, diagnosed as autosomal recessive persistent hyperplasia of the primary vitreous (PHPVAR). To better understand the role of ATOH7 in neuroretinal development, we created ATOH7 knockout and eGFP-expressing ATOH7 reporter human induced pluripotent stem cells (hiPSCs), which were differentiated into early-stage retinal organoids. Target loci regulated by ATOH7 were identified by Cleavage Under Targets and Release Using Nuclease with sequencing (CUT&RUN-seq) and differential expression by RNA sequencing (RNA-seq) of wildtype and mutant organoid-derived reporter cells. Additionally, single-cell RNA sequencing (scRNA-seq) was performed on whole organoids to identify cell type-specific genes. Mutant organoids displayed substantial deficiency in axon sprouting, reduction in RGCs, and an increase in other cell types. We identified 469 differentially expressed target genes, with an overrepresentation of genes belonging to axon development/guidance and Notch signaling. Taken together, we consolidate the function of human ATOH7 in guiding progenitor competence by inducing RGC-specific genes while inhibiting other cell fates. Furthermore, we highlight candidate genes responsible for ATOH7-associated optic nerve and retinovascular anomalies, which sheds light to potential future therapy targets for related disorders.

Keywords: ATOH7; CUT&RUN sequencing; RNA sequencing; retinal development; retinal ganglion cells; retinal organoids; retinal progenitor cells; scRNA sequencing.


Conflict of interest statement

The authors declare no conflicts of interest. The funders had no role in the design of the study; in the collection, analyses, or interpretation of data; in the writing of the manuscript; or in the decision to publish the results.

Figures

Figure 1
Figure 1
Graphical summary of the study design. Human iPSCs were edited using a CRISPR/Cas9 approach. From the edited cell population, single cells were sorted and expanded in 96-well plates, followed by genotyping by Sanger sequencing. Selected clones were then differentiated to retinal organoids, which were then collected for different experiments. iPSC, induced pluripotent stem cell; WT, wildtype; KO, knockout; CUT&RUN-seq, cleavage under targets and release using nuclease sequencing; scRNA-seq, single-cell RNA sequencing; MUT-GFP, mutant reporter; WT-GFP, wildtype reporter.
Figure 2
Figure 2
Schematic representation of the iPSC cell lines used in the current study, which include isogenic WT and KO clones (ATOH7WT and ATOH7KO), as well as WT and mutant eGFP reporter lines (ATOH7WT-GFP and ATOH7MUT-GFP). iPSC, induced pluripotent stem cell; WT, wildtype; KO, knockout; UTR, untranslated region; CDS, coding sequence; T, c-Myc tag; eGFP, enhanced green fluorescent protein; P2A, porcine teschovirus-1 2A self-cleaving peptide; HA, homology arm; sgKO, single-guide RNA for ATOH7 knockout; PAM, protospacer-adjacent motif; MUT-GFP, mutant reporter; WT-GFP, wildtype reporter.
Figure 3
Figure 3
Characterization of retinal organoids derived from gene-edited human iPSCs. (A) Confocal laser scanning microscopy imaging of immuno-assayed week 6–10 retinal organoids demonstrating protein expression of ATOH7 and (B) comparison of RGC and PR markers in ATOH7WT (WT) and ATOH7KO (KO) week 7 retinal organoids. Scale bar represents 50 µm. (C) Week 4 retinal organoids derived from ATOH7WT-GFP and ATOH7MUT-GFP reporter iPSCs immediately after dissection from 2D differentiation culture. At week 7, clear GFP signals could be detected in reporter iPSC-derived organoids. Scale bars represent 200 µm and 100 µm. (D) RT-qPCR targeting ATOH7 CDS in week 7 retinal organoids derived from reporter iPSCs. The assay was performed on six individual differentiation batches in a triplicate design. The cycle threshold results were normalized to GAPDH levels and are shown relative to expression in iPSCs. (E) Week 7 retinal organoids derived from reporter iPSCs were cultured on coverslips coated with Matrigel® for two weeks in order to observe axon sprouting. Immunostaining targeting neuronal tubulin TUBB3 and axon-specific TAU confirmed axon identity. Scale bars represent 200 µm and 100 µm. (F) Week 7 retinal organoids were also cultured encapsulated inside Corning® Matrigel® Matrix domes for two weeks, resulting in enhanced axon sprouting and confirming reduced axonogenesis in ATOH7-mutant retinal organoids. Scale bar represents 100 µm. BR, brightfield; iPSC, induced pluripotent stem cell; KO, knockout; PR, photoreceptor; RGC, retinal ganglion cell; RT-qPCR, real-time quantitative polymerase chain reaction; MUT-GFP, mutant reporter; WT-GFP, wildtype reporter; WT, wildtype. Scale bars: 50 µm (63X: (A,B)), 200 µm (4X: (C,E)), 100 µm (10X: (C,F)), and 100 µm (20X: (E)).
Figure 4
Figure 4
Identification of ATOH7 downstream targets by CUT&RUN-seq, performed on week 7 retinal organoids derived from ATOH7WT-GFP iPSCs. (A) Enrichment of reads within 5 kb of known TSSs acquired from CUT&RUN-seq of anti-ATOH7 antibody-treated eGFP-positive cells (target), eGFP-negative cells (negative control), and non-immune IgG-treated eGFP-positive cells (background control). (B) Peaks were determined using the MACS2 algorithm testing enrichment against the background control. Consensus peaks between replicate experiments were identified using the IDR method with a threshold of IDR < 0.05. (C) Venn diagram showing number of consensus peaks in target and negative control identified by IDR. The most enriched known motif found amongst target consensus peaks was the bHLH E-box motif modeled by ATOH1 using HOMER. (D) Genetic element distribution of target consensus peaks. (E) Top target consensus peaks ranked by lowest IDR (heatmap cut-off IDR < 0.001) and their peak-to-gene annotation using ChIP-Enrich. Additionally, the heatmap visualizes whether the annotated peak was assigned as a distal enhancer (>5 kb from TSS) or promoter (±5 kb from TSS), and total target consensus peaks assigned to the gene of interest. * Annotated by multiple peaks and/or discussed more in detail in the Results Section. (F) GO enrichment by g:Profiler of annotated genes after reduction using REVIGO, showing the top five most significant terms per GO category according to adjusted p-values, based on g:SCS. BP, biological process; CC, cellular compartment; CUT&RUN-seq, cleavage under targets and release using nuclease sequencing; g:SCS, g:Profiler set counts and sizes; GO, gene ontology; IDR, irreproducible discovery rate; MACS2, model-based analysis for ChIP-Seq 2; MF, molecular function; REVIGO, reduce visualize gene ontology; WT-GFP, wildtype reporter; TSS, transcription start site.
Figure 5
Figure 5
Differentially expressed genes (DEGs) in retinal organoid-derived ATOH7 reporter cells. (A) Reporter cells were isolated from week 7 organoids, sorted by cytometry, and sequenced by mRNA-seq. Differential expression analysis between ATOH7MUT-GFP and ATOH7WT-GFP reporter-enriched cells revealed 4037 DEGs, of which the top candidates are illustrated by Volcano using fold change and adjusted p-value (Benjamini–Hochberg FDR). (B) Heatmaps showing top-ranking DEGs according to adjusted p-value, as well as the presence and number of annotated ATOH7 binding sites, as revealed by CUT&RUN-seq. (C) GO enrichment by g:Profiler of annotated genes after reduction using REVIGO, showing the top five most significant terms per GO category according to adjusted p-values, based on g:SCS. BP, biological process; CC, cellular compartment; CUT&RUN-seq, cleavage under targets and release using nuclease sequencing; DEG, differentially expressed gene; FC, fold change; FDR, false discovery rate; g:SCS, g:Profiler set counts and sizes; GO, gene ontology; REVIGO, reduce visualize gene ontology; MUT-GFP, mutant reporter; WT-GFP, wildtype reporter.
Figure 6
Figure 6
Retinal organoid cell composition and cell type-specific genes regulated by ATOH7. Ten week 7 ATOH7WT and ATOH7KO retinal organoids were separately pooled, dissociated, and subsequently analyzed by hybridization-based PFA-fixed scRNA-seq. (A) UMAP of defined retinal clusters from integrated ATOH7WT and ATOH7KO organoids. The representative clusters are defined as naïve retinal progenitor cells (nRPCs), transient retinal progenitor cells (tRPCs), early retinal ganglion cells (early RGCs), late retinal ganglion cells (late RGCs), horizontal and amacrine cells (H&As), and photoreceptor cells (PRs). (B) Pseudotime trajectory analysis starting from TP53-positive dividing retinal progenitor cells. (C) Separated UMAPs of cells derived from either ATOH7WT or ATOH7KO organoids. Percentages represent the proportion of cells in a given cluster compared to the total number of cells. Values in parentheses indicate the relative change in cell proportions compared to WT. (D) UMAP of re-clustered ATOH7-positive cells derived from ATOH7WT organoids. (E) ATOH7-targeted cell type marker genes, defined as scRNA-seq marker genes (AUC > 0.75) with a significant differential expression (adj. p-value < 0.01) between ATOH7MUT-GFP and ATOH7WT-GFP cells, based on reporter-enriched mRNA-seq, and at least one binding site discovered by CUT&RUN-seq, where the annotation is defined as either enhancer (>5 kb from TSS) or promoter (±5 kb from TSS). AUC, area under curve; CUT&RUN-seq, cleavage under targets and release using nuclease sequencing; KO, knockout; PFA, paraformaldehyde; scRNA-seq, single-cell RNA sequencing; TSS, transcription start site; UMAP, uniform manifold approximation and projection; DEGs, differentially expressed genes between MUT-GFP and WT-GFP; MUT-GFP, mutant reporter; WT-GFP, wildtype reporter; WT, wildtype.
Figure 7
Figure 7
Axon guidance and Notch signaling are enriched amongst ATOH7 target DEGs. Identified ATOH7 target genes and ATOH7-associated DEGs in eGFP-enriched reporter cells derived from week 7 retinal organoids were overlapped to identify differentially expressed ATOH7 target genes (ATOH7 target DEGs). (A) Venn diagram showing the identification of ATOH7 target DEGs. (B) Number of regulated genes per cell type amongst ATOH7 target DEGs, with cell-type specificity defined by scRNA-seq. The representative cell clusters are defined as naïve retinal progenitor cells (nRPCs), transient retinal progenitor cells (tRPCs), early retinal ganglion cells (early RGCs), late retinal ganglion cells (late RGCs), horizontal and amacrine cells (H&As), and photoreceptor cells (PRs). (C) Enrichment of GO terms amongst the 469 ATOH7 target DEGs compared to all annotated genes. The analysis was performed in g:Profiler and reduced by REVIGO, showing the top five most significant terms for biological processes (GO:BP), cellular compartments (GO:CC), and molecular function (GO:MF) for ATOH7 target DEGs. Additionally, the enrichment of biological pathway terms from combined KEGG, REACTOME, and WikiPathways databases was performed against all known human genes, showing top 15 terms according to adjusted p-value. Asterisks (*) demark significance (adj. p-value < 0.05) when including annotated genes only. Multiple correction testing was performed using g:SCS. (D) Selection of ATOH7 target DEGs intersecting with top significantly enriched biological pathways. Similar terms from different databases were grouped together. “Nervous System Development” (R-HSA-9675108) and “Axon Guidance” (R-HSA-422475) were grouped together due to an almost complete overlap (98%) of intersecting genes. Heatmaps of annotated genes present relative expression per cell type, based on scRNA-seq data of ATOH7-positive cells in ATOH7WT organoids, differential expression between ATOH7MUT-GFP and ATOH7WT-GFP cells, based on reporter-enriched mRNA-seq, and the number of annotated ATOH7-binding loci identified by CUT&RUN-seq, where the annotation is defined as either enhancer (>5 kb from TSS) or promoter (±5 kb from TSS). (E) Expression distribution of selected genes in cell type-specific scRNA-seq clusters. Violin plots show raw expression distribution for cells originating from ATOH7WT organoids, ATOH7KO organoids, and from the ATOH7-expressing (ATOH7+) cells, re-clustered from the ATOH7WT organoids. Each expressing cell is marked by a black point. CUT&RUN-seq, cleavage under targets and release using nuclease sequencing; EVR, exudative vitreoretinopathy; g:SCS, g:Profiler set counts and sizes; GO, gene ontology; KO, knockout; REVIGO, reduce visualize gene ontology; PHPV, persistent hyperplastic primary vitreous; scRNA-seq, single-cell RNA sequencing; DEGs, differentially expressed genes between MUT-GFP and WT-GFP; MUT-GFP, mutant reporter; WT-GFP, wildtype reporter; TSS, transcription start site; WT, wildtype.
Figure 8
Figure 8
ATOH7 regulates genes encoding Wnt effectors and other secreted proteins. (A) Selection of ATOH7 reporter DEGs (log2FC > ±2, FDR < 0.01) encoding extracellular/secreted proteins. Heatmap of annotated genes present relative expression per cell type, based on scRNA-seq data, differential expression between ATOH7MUT-GFP and ATOH7WT-GFP cells, based on reporter-enriched mRNA-seq, and the number of annotated ATOH7-binding loci identified by CUT&RUN-seq, where the annotation is defined as either enhancer (>5 kb from TSS) or promoter (±5 kb from TSS). The representative cell clusters are defined as naïve retinal progenitor cells (nRPCs), transient retinal progenitor cells (tRPCs), early retinal ganglion cells (early RGCs), late retinal ganglion cells (late RGCs), horizontal and amacrine cells (H&As), and photoreceptor cells (PRs). (B) Expression distribution of selected genes encoding secreted proteins in cell type-specific scRNA-seq clusters. Violin plots show raw expression distribution in cells originating from ATOH7WT organoids, ATOH7KO organoids, and from the ATOH7 expressing (ATOH7+) cells, re-clustered from the ATOH7WT organoids. Each expressing cell is marked by a black dot. (C) Heatmap including the selection of ATOH7 reporter DEGs (log2FC > ±2, FDR < 0.01) associated with PHPV/EVR in patients (LRP5, NDP, KIF11, and RCBTB1) and/or in vivo (LRP5, NDP, KIF11, EFNA5, EFNB2, and NEO1) or in silico (SMAD2 and, MYCN) according to a literature search [70,71,72,73,74,75,76,77,78,79,80,81,82,83,84,85,86,87,88,89,90,91,92,93,94,95,96]. (D) Expression distribution of genes encoding NDP and NDP-associated receptors in cell type-specific scRNA-seq clusters. CUT&RUN-seq, cleavage under targets and release using nuclease sequencing; EVR, exudative vitreoretinopathy; KO, knockout; PHPV, persistent hyperplastic primary vitreous; scRNA-seq, single-cell RNA sequencing; DEGs, differentially expressed genes between MUT-GFP and WT-GFP; MUT-GFP, mutant reporter; WT-GFP, wildtype reporter; TSS, transcription start site; WT, wildtype.

Similar articles

Cited by

References

    1. Marquardt T., Gruss P. Generating Neuronal Diversity in the Retina: One for Nearly All. Trends Neurosci. 2002;25:32–38. doi: 10.1016/S0166-2236(00)02028-2. - DOI - PubMed
    1. Guillemot F. Vertebrate BHLH Genes and the Determination of Neuronal Fates. Exp. Cell Res. 1999;253:357–364. doi: 10.1006/excr.1999.4717. - DOI - PubMed
    1. Perron M., Harris W.A. Determination of Vertebrate Retinal Progenitor Cell Fate by the Notch Pathway and Basic Helix-Loop-Helix Transcription Factors. Cell. Mol. Life Sci. 2000;57:215–223. doi: 10.1007/PL00000685. - DOI - PMC - PubMed
    1. Wang S.W. Requirement for Math5 in the Development of Retinal Ganglion Cells. Genes. Dev. 2001;15:24–29. doi: 10.1101/gad.855301. - DOI - PMC - PubMed
    1. Brown N.L., Kanekar S., Vetter M.L., Tucker P.K., Gemza D.L., Glaser T. Math5 Encodes a Murine Basic Helix-Loop-Helix Transcription Factor Expressed during Early Stages of Retinal Neurogenesis. Development. 1998;125:4821–4833. doi: 10.1242/dev.125.23.4821. - DOI - PubMed

Publication types

MeSH terms

Substances

Grants and funding

LinkOut - more resources