. 2024 Jul 4;13(13):1147.
doi: 10.3390/cells13131147.

Iron Regulates Cellular Proliferation by Enhancing the Expression of Glucose Transporter GLUT3 in the Liver

Affiliations

Iron Regulates Cellular Proliferation by Enhancing the Expression of Glucose Transporter GLUT3 in the Liver

Kleber S Ribeiro et al. Cells. .

Abstract

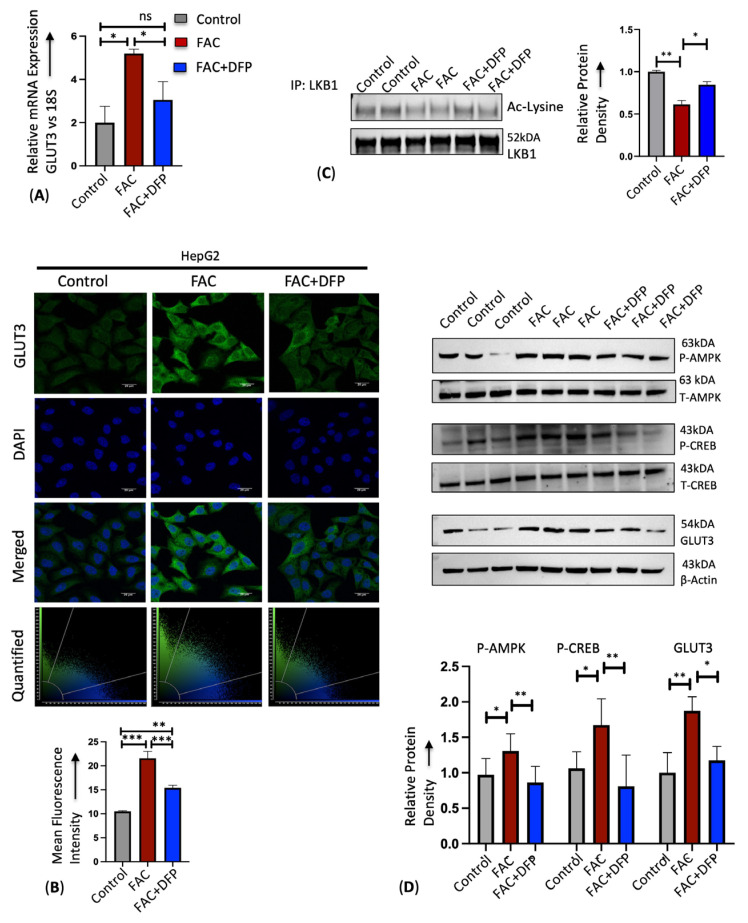
Iron is often accumulated in the liver during pathological conditions such as cirrhosis and cancer. Elevated expression of glucose transporters GLUT1 and GLUT3 is associated with reduced overall survival in patients with hepatocellular carcinoma. However, it is not known whether iron can regulate glucose transporters and contribute to tumor proliferation. In the present study, we found that treatment of human liver cell line HepG2 with ferric ammonium citrate (FAC) resulted in a significant upregulation of GLUT3 mRNA and protein in a dose-dependent manner. Similarly, iron accumulation in mice fed with high dietary iron as well as in mice injected intraperitoneally with iron dextran enhanced the GLUT3 expression drastically in the liver. We demonstrated that iron-induced hepatic GLUT3 upregulation is mediated by the LKB1/AMPK/CREB1 pathway, and this activation was reversed when treated with iron chelator deferiprone. In addition, inhibition of GLUT3 using siRNA prevented iron-mediated increase in the expression of cell cycle markers and cellular hyperproliferation. Furthermore, exogenous sodium beta-hydroxybutyrate treatment prevented iron-mediated hepatic GLUT3 activation both in vitro and in vivo. Together, these results underscore the importance of iron, AMPK, CREB1 and GLUT3 pathways in cell proliferation and highlight the therapeutic potential of sodium beta-hydroxybutyrate in hepatocellular carcinoma with high GLUT3 expression.

Keywords: AMPK; CREB1; GLUT3; cell proliferation; iron overload.


Conflict of interest statement

The authors declare that they have no competing interests.

Figures

Figure 1
Figure 1
Differential expression of GLUTs upon induction of iron overload in the liver. (A) Comparison of the ΔCT values for GLUT1, GLUT2, and GLUT3 expression in the mouse liver. (B) Relative mRNA expression of TFR1 by RT-PCR in the liver tissue of SD- or HID-fed mice and PBS- or Fe-Dex-injected mice. (C) Relative mRNA expression of GLUT1, GLUT2, and GLUT3 by RT-PCR in the liver tissues of SD- and HID-fed mice. (D) Relative mRNA expression of GLUT1, GLUT2, and GLUT3 by RT-PCR in the liver tissues of PBS- and Fe-Dex-injected mice; 18S RNA was used as an internal control. Data expressed as mean ± SEM; n = 4–5 mice per group; *** p < 0.0001, * p < 0.05, ns—not significant.
Figure 2
Figure 2
Iron upregulates hepatic GLUT3 expression in vitro in a dose-dependent manner. (A) Relative mRNA expression of GLUT3 by RT-PCR in HepG2 cells treated with different concentrations of FAC for 24 h. (B) Qualitative analysis of GLUT3 protein expression in FAC-treated HepG2 cells by confocal microscopy. Scale bar is 10 μm. Graph represents mean fluorescence intensity of GLUT3 expression. (C) Quantitative protein expression of p-AMPK (Thr-172), total AMPK, p-CREB (Ser 133), total CREB, and GLUT3 in HepG2 cells treated with FAC for 24 h by Western blot. α-tubulin was used as a loading control. Blots cropped from different parts of the same gel or from different gels are separated by white space. Data expressed as mean ± SEM of three independent experiments; *** p < 0.0001, ** p < 0.001, * p < 0.05.
Figure 3
Figure 3
Iron enhances hepatic GLUT3 expression through LKB1/AMPK/CREB axis. HepG2 cells treated with PBS, 250 μg/mL FAC, or 250 μg/mL FAC co-treated with 100 μM DFP for 24 h were used. (A) Relative mRNA expression of GLUT3 was assessed by RT-PCR. (B) Qualitative analysis of GLUT3 protein expression by confocal microscopy. Scale bar is 20 μm. Graph represents relative intensity of GLUT3 expression. (C) Lysates from HepG2 cells were incubated and precipitated with LKB1 antibody. Pull down was analyzed by Western blot for acetylated lysine. LKB1 was blotted as a loading control. (D) Protein expression of p-AMPK (Thr-172), total AMPK, p-CREB (Ser 133), total CREB and GLUT3 were quantified by Western blot. Data expressed as mean ± SEM of three independent experiments; *** p < 0.001, ** p < 0.01, * p < 0.05, ns = non-significant.
Figure 4
Figure 4
GLUT3 silencing prevents iron-mediated cellular hyperproliferation in HepG2 cells. FAC-treated HepG2 cells in the presence or absence of GLUT3siRNA were used. Relative mRNA expression of (A) GLUT3, (B) Ki67, and (C) cyclin D1 was assessed by RT-PCR. (D) Qualitative analysis of cyclin D1 protein expression by confocal microscopy. Graph represents relative intensity of cyclin D1 expression. Scale bar is 20 μm. (E) Quantitative protein expression of cyclin D1 by Western blot. Cell proliferation was quantified by (F) MTT assay and (G) BrdU assay. Data expressed as mean ± SEM of three independent experiments; *** p < 0.001, ** p < 0.01, * p < 0.05, ns = non-significant.
Figure 5
Figure 5
Treatment with BHB in vitro prevents FAC-induced GLUT3 upregulation in HepG2 cells. HepG2 cells treated with BHB at different concentrations for 24 h with or without FAC were used. (A) Relative mRNA expression of GLUT3 was assessed by RT-PCR. (B) Qualitative analysis of GLUT3 protein expression by confocal microscopy. Scale bar is 20 μm. (C) Western blot analysis of GLUT3 protein expression. Graph represents quantification of GLUT3 protein normalized to loading control by densitometry. Data expressed as mean ± SEM of three independent experiments; *** p < 0.001, ** p < 0.01, * p < 0.05, ns = non-significant.
Figure 6
Figure 6
BHB treatment in vivo prevents iron-mediated hepatic GLUT3 upregulation in mice. HID-fed mice treated with or without BHB were used. SD-fed mice were used as control. (A) Relative mRNA expression of GLUT3 in the liver tissues from mice. (B) Protein expression of p-AMPK (Thr-172), total AMPK, p-CREB (Ser 133), total CREB, and GLUT3 by Western blot in the mouse liver tissues. Quantification of p-AMPK (Thr-172), p-CREB (Ser 133), and GLUT3 expression by densitometry. (C) Immunohistochemistry of TFR1 and GLUT3 expression patterns in the mouse liver tissues. Scale bar is 10 μm. Images were quantified to detect the mean fluorescence intensity of TFR1 and GLUT3 using Las X software version 3.5.19976.5. (D) Relative mRNA expression of TfR1 in the liver tissues from mice. Data expressed as mean ± SEM; n = 5 mice per group; *** p < 0.0001, ** p < 0.001, * p < 0.05, ns—not significant.
Figure 7
Figure 7
A schematic of the signaling pathways involved in iron-induced cellular hyperproliferation through GLUT3 upregulation in the liver.

References

    1. Ganz T., Nemeth E. Iron homeostasis in host defence and inflammation. Nat. Rev. Immunol. 2015;15:500–510. doi: 10.1038/nri3863. - DOI - PMC - PubMed
    1. Andrews N.C. Disorders of iron metabolism. N. Engl. J. Med. 1999;341:1986–1995. doi: 10.1056/NEJM199912233412607. - DOI - PubMed
    1. MacKenzie E.L., Iwasaki K., Tsuji Y. Intracellular iron transport and storage: From molecular mechanisms to health implications. Antioxid. Redox Signal. 2008;10:997–1030. doi: 10.1089/ars.2007.1893. - DOI - PMC - PubMed
    1. Rui L. Energy metabolism in the liver. Compr. Physiol. 2014;4:177–197. - PMC - PubMed
    1. Simcox J.A., McClain D.A. Iron and diabetes risk. Cell Metab. 2013;17:329–341. doi: 10.1016/j.cmet.2013.02.007. - DOI - PMC - PubMed

Publication types

MeSH terms

LinkOut - more resources