Comparative Study
. 2024 Jul 5;13(13):1149.
doi: 10.3390/cells13131149.

Global Transcriptomic and Characteristics Comparisons between Mouse Fetal Liver and Bone Marrow Definitive Erythropoiesis

Affiliations
Comparative Study

Global Transcriptomic and Characteristics Comparisons between Mouse Fetal Liver and Bone Marrow Definitive Erythropoiesis

Chengjie Gao et al. Cells. .

Abstract

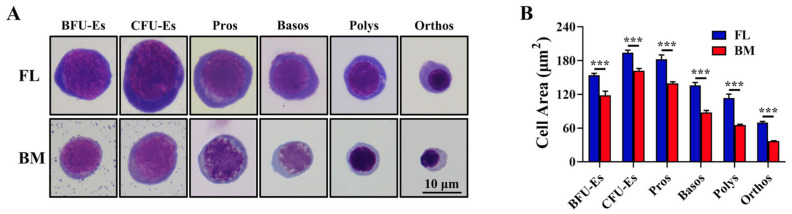
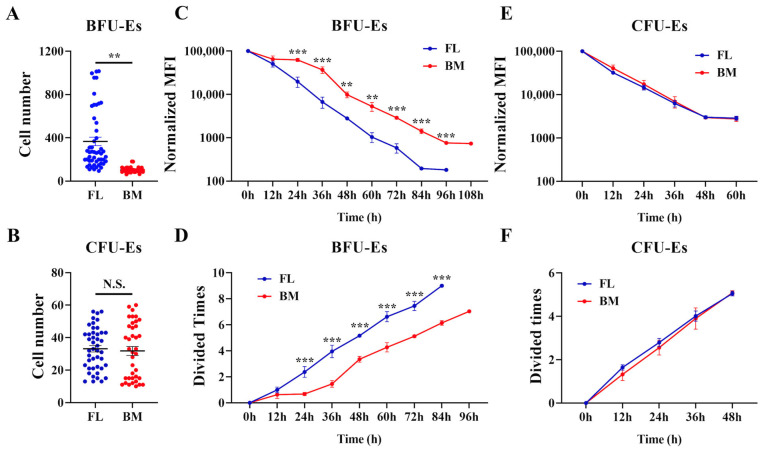
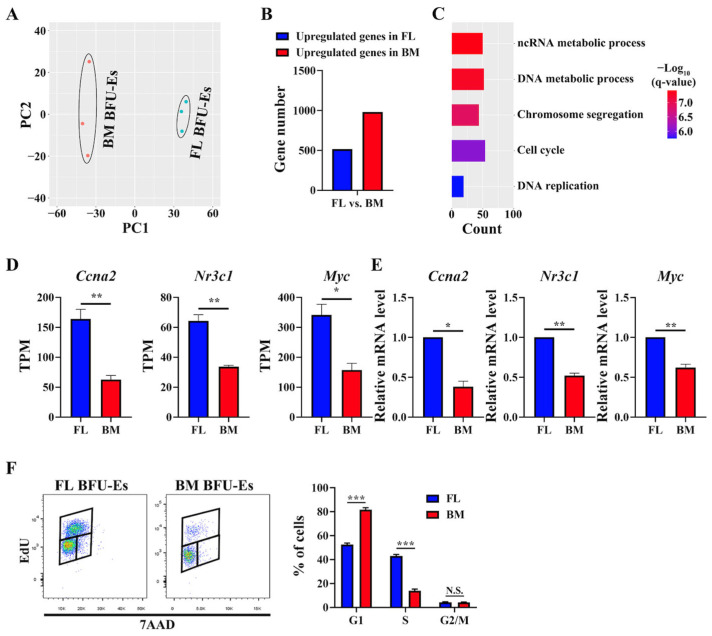
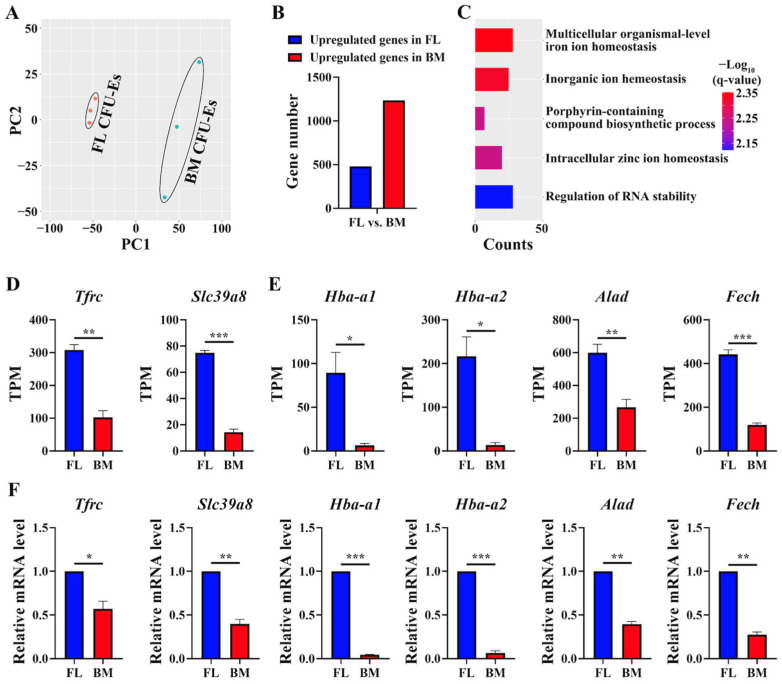
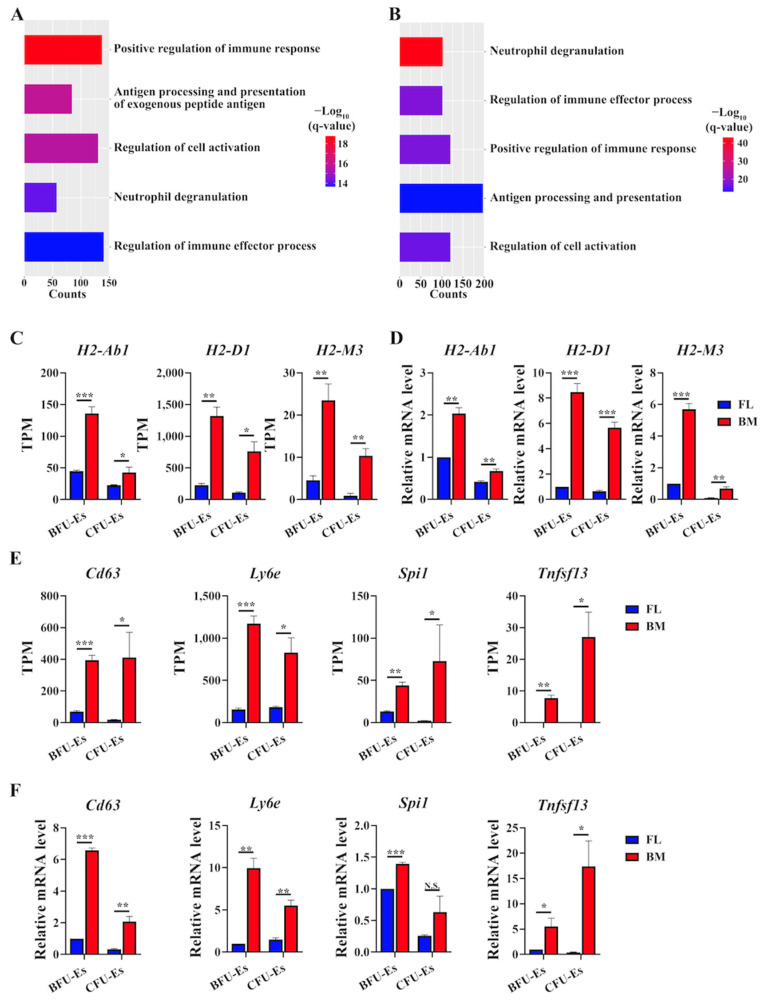
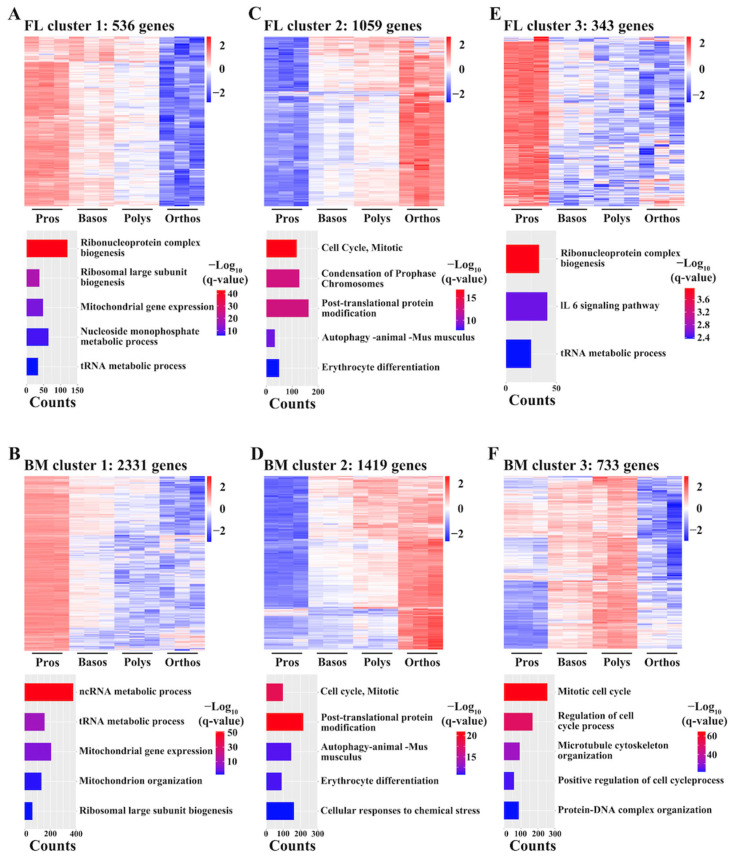
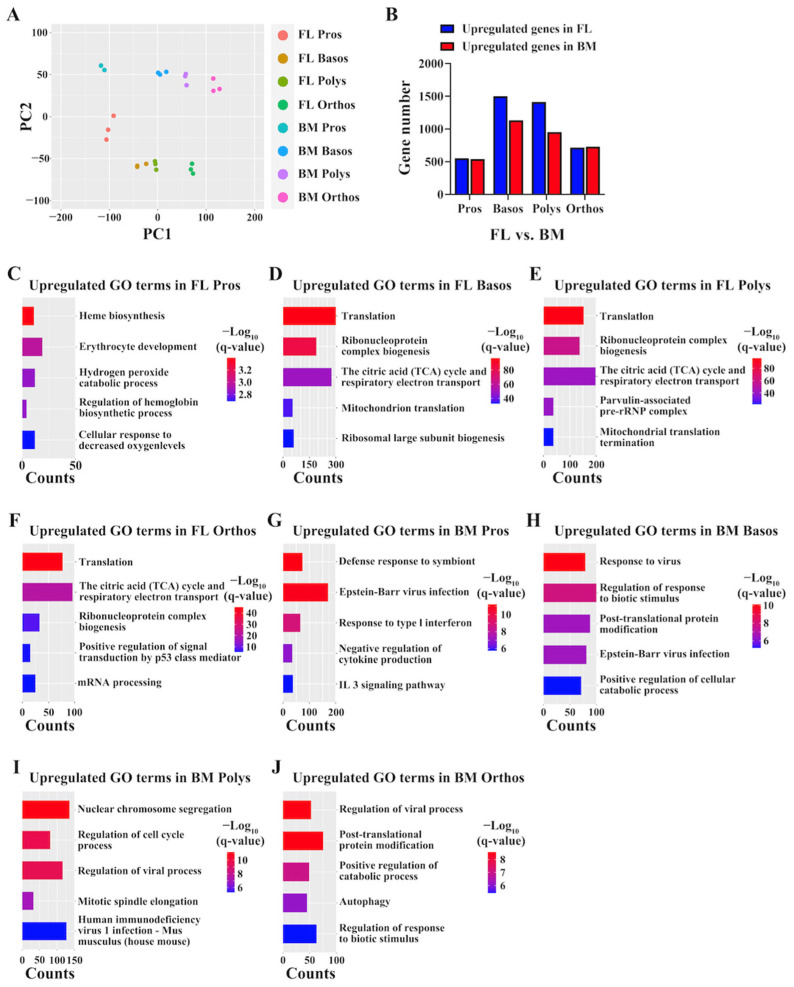
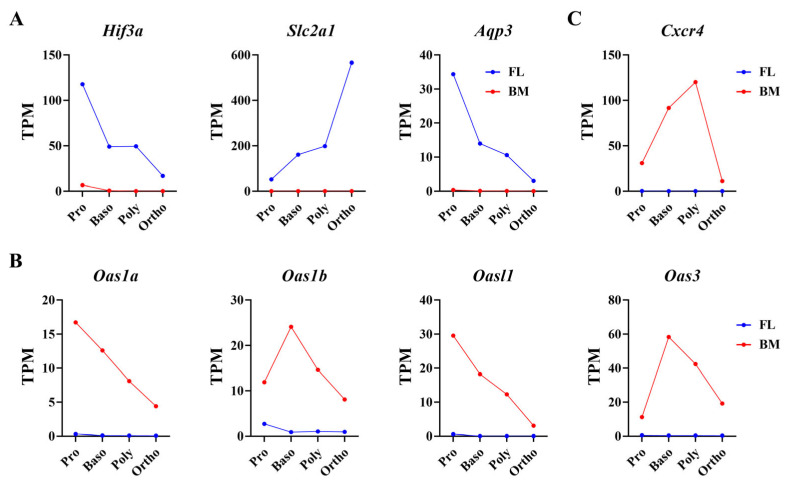
Erythropoiesis occurs first in the yolk sac as a transit "primitive" form, then is gradually replaced by the "definitive" form in the fetal liver (FL) during fetal development and in the bone marrow (BM) postnatally. While it is well known that differences exist between primitive and definitive erythropoiesis, the similarities and differences between FL and BM definitive erythropoiesis have not been studied. Here we performed comprehensive comparisons of erythroid progenitors and precursors at all maturational stages sorted from E16.5 FL and adult BM. We found that FL cells at all maturational stages were larger than their BM counterparts. We further found that FL BFU-E cells divided at a faster rate and underwent more cell divisions than BM BFU-E. Transcriptome comparison revealed that genes with increased expression in FL BFU-Es were enriched in cell division. Interestingly, the expression levels of glucocorticoid receptor Nr3c1, Myc and Myc downstream target Ccna2 were significantly higher in FL BFU-Es, indicating the role of the Nr3c1-Myc-Ccna2 axis in the enhanced proliferation/cell division of FL BFU-E cells. At the CFU-E stage, the expression of genes associated with hemoglobin biosynthesis were much higher in FL CFU-Es, indicating more hemoglobin production. During terminal erythropoiesis, overall temporal patterns in gene expression were conserved between the FL and BM. While biological processes related to translation, the tricarboxylic acid cycle and hypoxia response were upregulated in FL erythroblasts, those related to antiviral signal pathway were upregulated in BM erythroblasts. Our findings uncovered previously unrecognized differences between FL and BM definitive erythropoiesis and provide novel insights into erythropoiesis.

Keywords: bone marrow; cell cycle; definitive erythropoiesis; fetal liver; transcriptome analysis.


Conflict of interest statement

The authors declare no conflicts of interest.

Figures

Figure 1
Figure 1
Morphology of mouse FL and BM erythroid cells. (A) Representative images of erythroid cells at all maturational stages from mouse E16.5 FL and adult BM. (B) Quantitative analysis of cell area of erythroid progenitors and precursors at all maturational stages. In total, 30 cells at each stage were used for quantification. *** p < 0.001. FL: fetal liver; BM: bone marrow; BFU-Es: burst colony forming unit-erythroids; CFU-Es: colony forming unit-erythroids; Pros: proerythroblasts; Basos: basophilic erythroblasts; Polys: polychromatic erythroblasts; Orthos: orthochromatic erythroblasts.
Figure 2
Figure 2
Proliferation capability of mouse FL and BM erythroid cells. (A) Numbers of cell grown from one sorted FL or BM BFU-E cell after culturing for 96 h. (B) Numbers of cell grown from one sorted FL or BM CFU-E cell after culturing for 48 h. (C) Normalized violet MFI of FL or BM BFU-Es detected at indicated time points. N = 3. (D) Numbers of cell division of FL or BM BFU-Es calculated based on changes in MFI. N = 3. (E) Normalized violet MFI of FL or BM CFU-Es detected at indicated time points. N = 3. (F) Numbers of cell division of FL or BM CFU-Es calculated based on changes in MFI. MFI: mean fluorescence intensity N = 3. N.S. Not Significant. ** p < 0.01, *** p < 0.001.
Figure 3
Figure 3
Comparisons between mouse FL and BM BFU-E cells. (A) Principal component analyses of transcriptomes showing separation of FL BFU-Es and BM BFU-Es. (B) Bar plot of differentially expressed gene (DEG) numbers between FL BFU-Es and BM BFU-Es. (C) Bar plot of GO terms enriched in genes with higher expression in FL BFU-Es than BM BFU-Es. (D) Expression levels of Ccna2, Nr3c1 and Myc in FL and BM BFU-E cells from RNA-seq by TPM. (E) Expression levels of Ccna2, Nr3c1 and Myc in FL and BM BFU-E cells as assessed by real-time PCR. Gapdh was used as control. (F) Cell cycle analyses of FL and BM BFU-E cells as assessed by in vivo EdU uptake by flow cytometry. N = 3. N.S.: Not Significant. * p < 0.05. ** p < 0.01, *** p < 0.001. q-value represents adjusted p. PC: principal component.
Figure 4
Figure 4
Comparisons between mouse FL and BM CFU-E cells. (A) Principal component analyses showing separation of FL CFU-Es and BM CFU-Es. (B) Bar plot of DEG numbers between FL CFU-Es and BM CFU-Es. (C) Bar plot of GO terms enriched in genes with higher expression in FL CFU-Es than BM CFU-Es. (D) Expression levels of Tfrc and Slc39a8 in FL and BM CFU-Es from RNA-seq by TPM. (E) Expression levels of genes involved in hemoglobin biosynthesis in FL and BM CFU-Es from RNA-seq by TPM. (F) Expression levels of genes in D and E in FL and BM CFU-E cells as assessed by real-time PCR. Gapdh was used as control. N = 3. * p < 0.05. ** p < 0.01, *** p < 0.001. q-value represents adjusted p.
Figure 5
Figure 5
Upregulated GO terms and genes in BM progenitors than FL progenitors. (A) Bar plot of GO terms enriched in genes with higher expression in BM BFU-Es than FL BFU-Es. (B) Bar plot of GO terms enriched in genes with higher expression in BM CFU-Es than FL CFU-Es. (C) Expression level of histocompatibility complex genes from RNA-seq by TPM in FL and BM progenitors. (D) Expression level of histocompatibility complex genes as assessed by real-time PCR. (E) Expression level of marker genes involved in immunomodulation from RNA-seq by TPM in FL and BM progenitors. (F) Expression level of marker genes involved in immunomodulation as assessed by real-time PCR. Gapdh was used as control. N = 3. N.S.: Not Significant. * p < 0.05. ** p < 0.01, *** p < 0.001. q-value represents adjusted p.
Figure 6
Figure 6
Clusters of DEGs between adjacent stages in FL and BM terminal erythropoiesis. Heatmap of gene expression and bar plot of enriched GO terms of genes in cluster 1 (A), cluster 2 (C) and cluster 3 (E) in FL terminal erythropoiesis. Heatmap of gene expression and bar plot of enriched GO terms of genes in cluster 1 (B), cluster 2 (D) and cluster 3 (F) in BM terminal erythropoiesis. q-value represents adjusted p.
Figure 7
Figure 7
Same-stage transcriptome comparison between FL and BM erythroblasts. (A) Principal component analyses showing separation of FL and BM erythroblasts at all maturational stages. (B) Bar plot of numbers of DEGs at each stage between FL and BM erythroblasts. (C) Enriched GO terms of DEGs with increased expression in FL Pros compared to BM Pros. (D) Enriched GO terms of DEGs with increased expression in FL Basos compared to BM Basos. (E) Enriched GO terms of DEGs with increased expression in FL Polys compared to BM Polys. (F) Enriched GO terms of DEGs with increased expression in FL Orthos compared to BM Orthos. (G) Enriched GO terms of DEGs with increased expression in BM Pros compared to FL Pros. (H) Enriched GO terms of DEGs with increased expression in BM Basos compared to FL Basos. (I) Enriched GO terms of DEGs with increased expression in BM Polys compared to FL Polys. (J) Enriched GO terms of DEGs with increased expression in BM Orthos compared to FL Orthos. q-value represents adjusted p.
Figure 8
Figure 8
Specifically expressed genes in FL or BM erythroblasts. (A) Bar plot of expression of hypoxia-regulated genes Hif3a, Aqp3 and Slc2a1 from RNA-seq by TPM. (B) Bar plot of expression of genes involved in antiviral signaling pathway from RNA-seq by TPM. (C) Bar plot of Cxcr4 expression from RNA-seq by TPM. q-value represents adjusted p.

Similar articles

References

    1. Palis J., Robertson S., Kennedy M., Wall C., Keller G. Development of erythroid and myeloid progenitors in the yolk sac and embryo proper of the mouse. Development. 1999;126:5073–5084. doi: 10.1242/dev.126.22.5073. - DOI - PubMed
    1. Palis J., Yoder M.C. Yolk-sac hematopoiesis: The first blood cells of mouse and man. Exp. Hematol. 2001;29:927–936. doi: 10.1016/S0301-472X(01)00669-5. - DOI - PubMed
    1. Baron M.H., Vacaru A., Nieves J. Erythroid development in the mammalian embryo. Blood Cells Mol. Dis. 2013;51:213–219. doi: 10.1016/j.bcmd.2013.07.006. - DOI - PMC - PubMed
    1. Dzierzak E., Philipsen S. Erythropoiesis: Development and differentiation. Cold Spring Harb. Perspect. Med. 2013;3:a011601. doi: 10.1101/cshperspect.a011601. - DOI - PMC - PubMed
    1. Palis J. Ontogeny of erythropoiesis. Curr. Opin. Hematol. 2008;15:155–161. doi: 10.1097/MOH.0b013e3282f97ae1. - DOI - PubMed

Publication types

LinkOut - more resources