. 2024 Jul 6;13(13):1150.
doi: 10.3390/cells13131150.

Cx40 Levels Regulate Hypoxia-Induced Changes in the Migration, Proliferation, and Formation of Gap Junction Plaques in an Extravillous Trophoblast Cell Model

Affiliations

Cx40 Levels Regulate Hypoxia-Induced Changes in the Migration, Proliferation, and Formation of Gap Junction Plaques in an Extravillous Trophoblast Cell Model

Fernanda M Rozas-Villanueva et al. Cells. .

Abstract

Background: Extravillous trophoblasts (EVTs) form stratified columns at the placenta-uterus interface. In the closest part to fetal structures, EVTs have a proliferative phenotype, whereas in the closest part to maternal structures, they present a migratory phenotype. During the placentation process, Connexin 40 (Cx40) participates in both the proliferation and migration of EVTs, which occurs under hypoxia. However, a possible interaction between hypoxia and Cx40 has not yet been established.

Methods: We developed two cellular models, one with "low Cx40" (Jeg-3), which reflected the expression of this protein found in migratory EVTs, and one with "high Cx40" (Jeg-3/hCx40), which reflected the expression of this protein in proliferative cells. We analyzed the migration and proliferation of these cells under normoxic and hypoxic conditions for 24 h. Jeg-3 cells under hypoxia increased their migratory capacity over their proliferative capacity. However, in Jeg-3/hCx40, the opposite effect was induced. On the other hand, hypoxia promoted gap junction (GJ) plaque formation between neighboring Jeg-3 cells. Similarly, the activation of a nitro oxide (NO)/cGMP/PKG-dependent pathway induced an increase in GJ-plaque formation in Jeg-3 cells.

Conclusions: The expression patterns of Cx40 play a crucial role in shaping the responses of EVTs to hypoxia, thereby influencing their migratory or proliferative phenotype. Simultaneously, hypoxia triggers an increase in Cx40 gap junction (GJ) plaque formation through a pathway dependent on NO.

Keywords: connexins; extravillous trophoblast; gap junction channels; nitric oxide; placenta.


Conflict of interest statement

The authors declare no conflicts of interest.

Figures

Figure 1
Figure 1
Immunodetection of Cx40. (A) Evaluation of the Cx40 protein through Western Blot analysis using Jeg-3 and Hela cells, both transfected and non-transfected with hCx40. HeLa cells were employed as an expression control and for assessing the specificity of the primary antibody. Each lane was loaded with 60 µg of total proteins. The upper panel shows the results of the primary anti-Cx40 antibody, while the lower panel displays anti-tubulin, with both revealed using a secondary antibody conjugated to HRP. (B) Densitometry quantification of the bands shown in (A). Statistical comparisons were made using the t-test against the respective controls, with significance indicated as * p < 0.05 and ** p < 0.01. Error bars represent the standard error of n = 3. Detection of Cx40 through indirect immunofluorescence, recorded using confocal microscopy. (C) The upper panels illustrate the localization of Cx40 in HeLa cells, both wild type (WT) and those transfected with Cx40 (hCx40). (D) The lower panels show Jeg-3 cells, both WT and hCx40. Arrow heads show localization of Cx40 GJ plaques. Scale bar = 10 mm. A secondary anti-rabbit antibody used in this study was conjugated with Alexa Fluor 594 (signal showed in green), while nuclei were stained with DAPI.
Figure 2
Figure 2
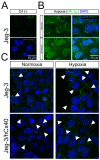
Hypoxia induces Cx40 GJ plaque formation in Jeg-3 cells. Jeg-3 and Jeg-3/hCx40 cells were grown in normoxic and hypoxic conditions for 24 h. (A) Immunofluorescence negative control performed using cells incubated only with secondary anti-Rabbit antibody conjugated with FITC. (B) Immunodetection of Hif-1α (green signal) in Jeg-3 cells: In normoxia, the immunoreactive signal for Hif-1α was observed mostly in perinuclear regions. However, under hypoxia, Hif-1α was translocated to the nucleus. (C) Immunodetection of Cx40 (green signal): left panels cells maintained in normoxia and right panels cells maintained in hypoxia for 24 h. Upper panels correspond to Jeg-3 cells, and lower panels correspond to Jeg-3/hCx40 cells. Representative photographs of 3 independent experiments. Arrow heads show Cx40 GJ-plaques and scale bar = 15 µm.
Figure 3
Figure 3
Hypoxia induces an enhanced DAPI transfer between neighboring cells. To assess intercellular coupling in 90–100% confluent cell cultures, a DAPI (50 μM) scrape loading assay was conducted. Upper panels correspond to the phase-contrast images for the lower panels (Scale bar = 100 mm). The middle panels display images captured at a 20X magnification using a 350 nm filter in an epifluorescence microscope. The lower panels offer a closer view of the highlighted red areas in the middle panels. Each image is a representative sample from a total of n = 3 independent experiments. Scale bar = 30 µm.
Figure 4
Figure 4
Cx40 levels modulate the effect of hypoxia in Jeg-3 cells. Jeg-3 and Jeg- 3/hCx40 cells were grown in hypoxia for 24 h and compared to controls (normoxia). Migration was evaluated by wound healing test. Yellow line draws the migration front: (A) upper panels show cells maintained in normoxia or (B) lower panels in hypoxia. (C) Proliferation assay, upper images correspond to cells grown in normoxia, and lower images correspond to cells grown in hypoxia. The photographs correspond to the cell density at 24 h. Inserts show GFP expression of Jeg-3/hCx40 cells. (D) Quantification of proliferation and migration (left and right abscissa respectively). The graph shows the average rate of change for each condition. Statistical comparison by ANOVA: * p < 0.05, ** p < 0.01; and *** p < 0.005; bars represent the standard error (n = 3). Only comparisons whose p was <0.05 are drawn, any other multiple comparison not indicated in the graph was not significant.
Figure 5
Figure 5
NO enhanced Cx40 GJC, but reduced migration and proliferation of Jeg-3 cells. Jeg-3 cells were maintained in normoxia or hypoxia alone or in combination with NO modulators for 24 h (A) Jeg-3 cells were grown in culture media with a nitric oxide synthase inhibitor (L-NAME) or in presence of NO donors (1 mM SNP, 500 µM GSNO, or 500 µM NONOate) for 24 h and then the localization of Cx40 (green signal) was studied by immunofluorescence in a confocal microscope. Nuclei were stained with DAPI and arrow heads show localization of Cx40 GJ-plaques. (B) Graphic shows the effect of 1 mM SNP on the proliferation and migration capacity of Jeg-3 cells. Statistical comparison by ANOVA: *** p <0.001, ns p >0.05 (n = 4). (C) Jeg-3 cells were cultured in media containing 0.5- and 1-mM SNP for 24 h, and cell viability was subsequently assessed using an MTS kit. (D) Jeg-3 cells were cultured in media with various NO donors (1 mM SNP, 500 μM GSNO, or 500 μM NONOate) for 24 h, and the uptake of 10 μM 7-AAD was measured. As a positive control for this technique, cells were exposed to culture media with 0.5% Triton X-100. In all cases, after 10 min of exposure to 7-AAD, cells were washed and images were captured using a microscope. The scale bars = 50 μm (n = 3). Statistical comparison by ANOVA: ns > 0.05; * p < 0.05, and *** p < 0.005; bars represent the standard error (n = 3).
Figure 6
Figure 6
cGMP/PKG induces Cx40 GJ plaques between Jeg-3 cells. Jeg-3 cells were cultured in 21% O2 and treated with DMSO (0.1%) (left panel), 1 mM 8-bromo-cGMP (middle panel), or 1 mM 8-bromo-cGMP plus 1 μM PKGi (KT5823, right panel). Arrow heads denote the presence of GJ plaques between cells. Pictures representatives of 3 independent experiments. Scale bar = 20 µm.
Figure 7
Figure 7
Model of the relationship between Cx40 levels and the effect of hypoxia on EVTs. As hypoxia is established, it will increase proliferation in cells with high Cx40 expression levels and migration in cells with low Cx40 expression levels. In addition, hypoxia-induced Cx40 GJ plaques formation in cells with low Cx40 levels possibly occurs via a NO/cGMP/PKG-dependent pathway. However, cells with high expression basally form Cx40 GJCs, which seem to not be affected by hypoxia.

Similar articles

Cited by

References

    1. Knöfler M., Pollheimer J. Human placental trophoblast invasion and differentiation: A particular focus on Wnt signaling. Front. Genet. 2013;4:190. doi: 10.3389/fgene.2013.00190. - DOI - PMC - PubMed
    1. Pollheimer J., Vondra S., Baltayeva J., Beristain A.G., Knöfler M. Regulation of Placental Extravillous Trophoblasts by the Maternal Uterine Environment. Front. Immunol. 2018;9:2597. doi: 10.3389/fimmu.2018.02597. - DOI - PMC - PubMed
    1. Sato Y., Fujiwara H., Konishi I. Mechanism of maternal vascular remodeling during human pregnancy. Reprod. Med. Biol. 2012;11:27–36. doi: 10.1007/s12522-011-0102-9. - DOI - PMC - PubMed
    1. Davies J.E., Pollheimer J., Yong H.E.J., Kokkinos M.I., Kalionis B., Knöfler M., Murthi P. Epithelial-mesenchymal transition during extravillous trophoblast differentiation. Cell Adhes. Migr. 2016;10:310–321. doi: 10.1080/19336918.2016.1170258. - DOI - PMC - PubMed
    1. Pollheimer J., Fock V., Knöfler M. Review: The ADAM metalloproteinases—Novel regulators of trophoblast invasion? Placenta. 2014;35:S57–S63. doi: 10.1016/j.placenta.2013.10.012. - DOI - PubMed

Publication types

LinkOut - more resources