

Retinal Ganglion Cell Content Underlying Standard Automated Perimetry Size I to V Visual Sensitivities in the Non-Human Primate Experimental Glaucoma Model
- PMID: 38995114
- PMCID: PMC11246096
- DOI: 10.1167/iovs.65.8.22
Retinal Ganglion Cell Content Underlying Standard Automated Perimetry Size I to V Visual Sensitivities in the Non-Human Primate Experimental Glaucoma Model
Abstract
Purpose: To determine the relationship between visual sensitivities from white-on-white Goldmann size I to V stimuli and the underlying retinal ganglion cell (RGC) content in the non-human primate (NHP) experimental glaucoma model.
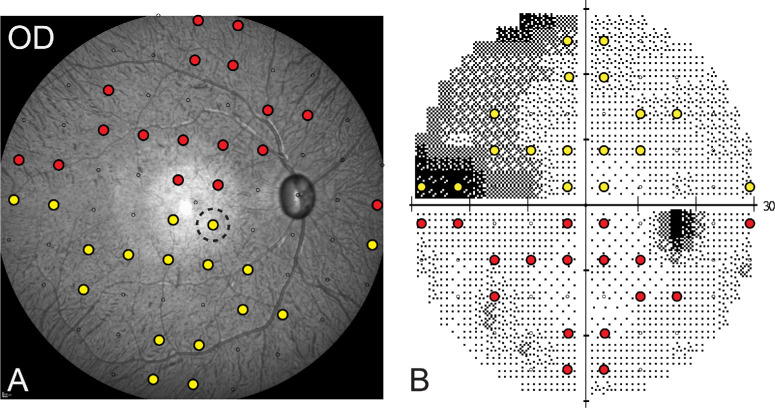
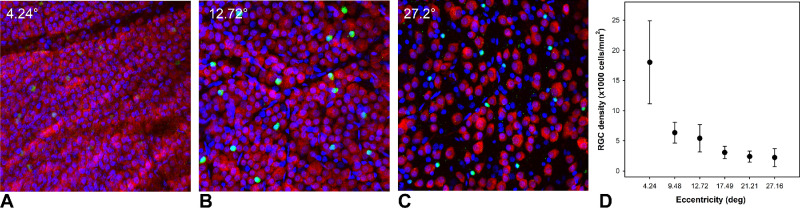
Methods: Normative data were collected from 13 NHPs. Unilateral experimental glaucoma was induced in seven animals with the least variable fields who were monitored using optical coherence tomography and 30-2 full-threshold standard automated perimetry (SAP). At varying endpoints, animals were euthanized followed by perfusion fixation, and 1-mm retinal punches were obtained from 34 corresponding SAP locations. RGCs were immunolabeled with an antibody against an RNA-binding protein (RBPMS) marker and imaged using confocal microscopy. RGC counts from each location were then related to visual sensitivities for each stimulus size, after accounting for ocular magnification.
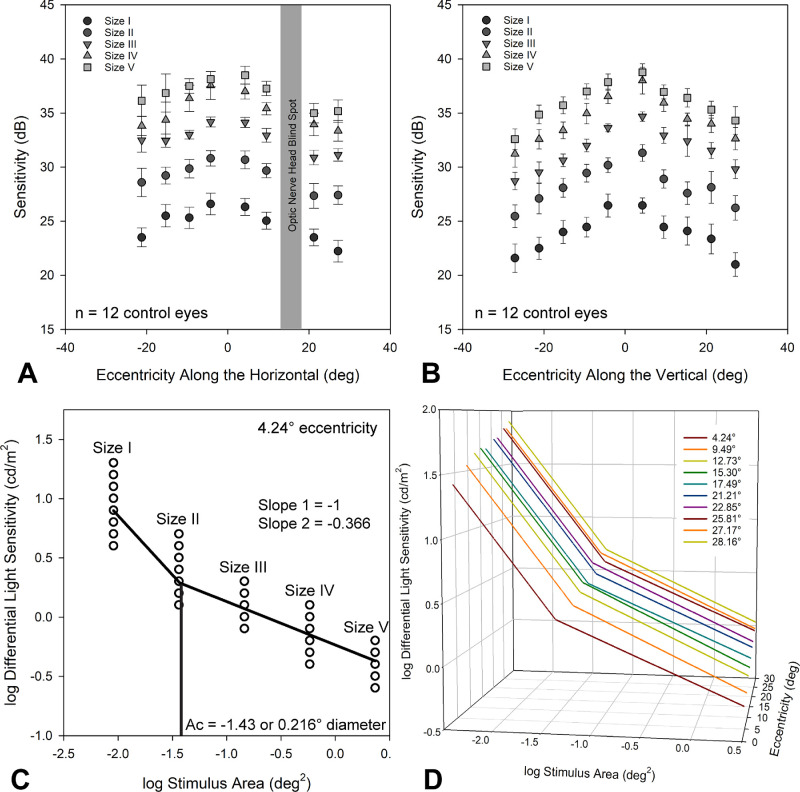
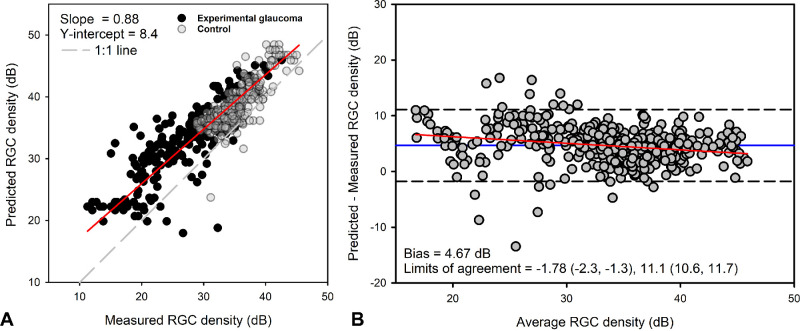
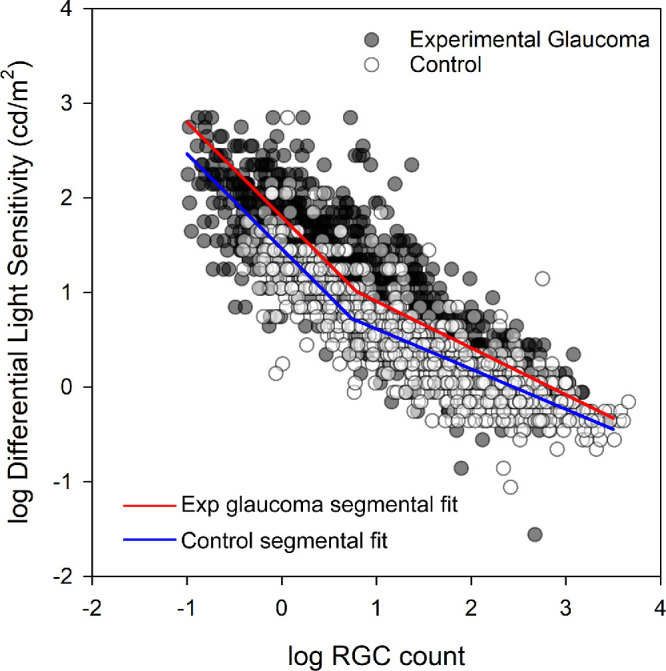
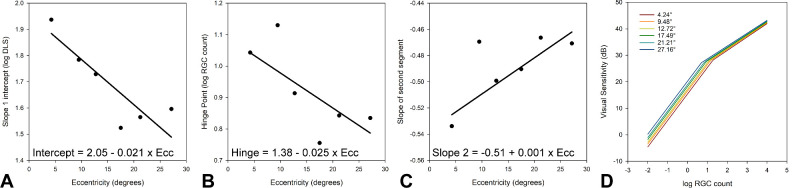
Results: At the endpoint, the circumpapillary retinal nerve fiber layer thickness for experimental glaucoma eyes ranged from 47 to 113 µm. RGC density in control eyes was greatest for the 4.24° sample (18,024 ± 6869 cells/mm2) and decreased with eccentricity. Visual sensitivity at each tested location followed that predicted by spatial summation, with the critical area increasing with eccentricity (slope = 0.0036, R2 = 0.44). The relationship between RGC counts and visual sensitivity was described using a two-line fit, where the intercept of the first segment and hinge points were dependent on eccentricity.
Conclusions: In NHPs, SAP visual thresholds are related to the underlying RGCs. The resulting spatial summation based structure-function model can be used to estimate RGC content from any standard white-on-white stimulus size.
Conflict of interest statement
Disclosure:
Figures
Similar articles
-
The Relationship Between Macula Retinal Ganglion Cell Density and Visual Function in the Nonhuman Primate.Invest Ophthalmol Vis Sci. 2021 Jan 4;62(1):5. doi: 10.1167/iovs.62.1.5. Invest Ophthalmol Vis Sci. 2021. PMID: 33393971 Free PMC article.
-
Retinal ganglion cell count estimates associated with early development of visual field defects in glaucoma.Ophthalmology. 2013 Apr;120(4):736-44. doi: 10.1016/j.ophtha.2012.09.039. Epub 2012 Dec 12. Ophthalmology. 2013. PMID: 23246120 Free PMC article.
-
Structure/Function relationship and retinal ganglion cells counts to discriminate glaucomatous damages.BMC Ophthalmol. 2015 Dec 29;15:185. doi: 10.1186/s12886-015-0177-x. BMC Ophthalmol. 2015. PMID: 26711893 Free PMC article.
-
Evaluating retinal ganglion cell loss and dysfunction.Exp Eye Res. 2016 Oct;151:96-106. doi: 10.1016/j.exer.2016.08.006. Epub 2016 Aug 12. Exp Eye Res. 2016. PMID: 27523467 Free PMC article. Review.
-
Assessment of neuroprotection in the retina with DARC.Prog Brain Res. 2008;173:437-50. doi: 10.1016/S0079-6123(08)01130-8. Prog Brain Res. 2008. PMID: 18929126 Free PMC article. Review.
References
-
- Quigley HA, Addicks EM, Green WR.. Optic nerve damage in human glaucoma: III. Quantitative correlation of nerve fiber loss and visual field defect in glaucoma, ischemic neuropathy, papilledema, and toxic neuropathy. Arch Ophthalmol. 1982; 100: 135–146. - PubMed
-
- Casson RJ, Chidlow G, Wood JP, Crowston JG, Goldberg I.. Definition of glaucoma: clinical and experimental concepts. Clin Exp Ophthalmol. 2012; 40: 341–349. - PubMed
-
- Maurice C, Friedman Y, Cohen MJ, et al. .. Histologic RNFL thickness in glaucomatous versus normal human eyes. J Glaucoma. 2016; 25: 447–451. - PubMed
MeSH terms
Grants and funding
LinkOut - more resources
Full Text Sources
Medical
Miscellaneous
