. 2024 Sep;98(9):3137-3153.
doi: 10.1007/s00204-024-03801-7. Epub 2024 Jul 12.

A multi-biomarker micronucleus assay using imaging flow cytometry

Affiliations

A multi-biomarker micronucleus assay using imaging flow cytometry

Danielle S G Harte et al. Arch Toxicol. 2024 Sep.

Abstract

Genetic toxicity testing assesses the potential of compounds to cause DNA damage. There are many genetic toxicology screening assays designed to assess the DNA damaging potential of chemicals in early drug development aiding the identification of promising drugs that have low-risk potential for causing genetic damage contributing to cancer risk in humans. Despite this, in vitro tests generate a high number of misleading positives, the consequences of which can lead to unnecessary animal testing and/or the abandonment of promising drug candidates. Understanding chemical Mode of Action (MoA) is vital to identifying the true genotoxic potential of substances and, therefore, the risk translation into the clinic. Here we demonstrate a simple, robust protocol for staining fixed, human-lymphoblast p53 proficient TK6 cells with antibodies against ɣH2AX, p53 and pH3S28 along with DRAQ5™ DNA staining that enables analysis of un-lysed cells via microscopy approaches such as imaging flow cytometry. Here, we used the Cytek® Amnis® ImageStream®X Mk II which provides a high-throughput acquisition platform with the sensitivity of flow cytometry and spatial morphological information associated with microscopy. Using the ImageStream manufacturer's software (IDEAS® 6.2), a masking strategy was developed to automatically detect and quantify micronucleus events (MN) and characterise biomarker populations. The gating strategy developed enables the generation of a template capable of automatically batch processing data files quantifying cell-cycle, MN, ɣH2AX, p53 and pH3 populations simultaneously. In this way, we demonstrate how a multiplex system enables DNA damage assessment alongside MN identification using un-lysed cells on the imaging flow cytometry platform. As a proof-of-concept, we use the tool chemicals carbendazim and methyl methanesulphonate (MMS) to demonstrate the assay's ability to correctly identify clastogenic or aneugenic MoAs using the biomarker profiles established.

Keywords: Biomarker; DNA damage; ImageStream; Micronucleus; MoA; NAM.


Conflict of interest statement

None.

Figures

Fig. 1
Fig. 1
DNA structure, micronucleus formation and cell-cycle biomarker relationships. A Schematic showing the primary, secondary and tertiary structure of DNA. DNA wraps around histone octamer protein cores consisting of H2A, H2B, H3 and H4 dimers, forming the nucleosome. Nucleosome folding compacts DNA to form the chromatid arm, yielding a metapahse chromosome formed of two sister chromatids joined at the centromere. B Routes of micronucleus induction. Compound DNA interaction can lead to MN formation by either aneugenic (chromosome loss) or clastogenic (chromosome breakage) routes. Chromosome break or loss results in a MN as the DNA segments are not pulled to the poles and thus remain in the cytoplasm when the nuclear envelope reforms and cytokinesis occurs. The red coloured chromosome/chromosome piece indicates the DNA content that becomes the MN (also shown in red). C Cell cycle and biomarker activation. Upon DNA damage, p53 is phosphorylated resulting activation of DNA damage repair pathways and cell cycle arrest. Double-strand and single-strand breaks lead to the formation of DNA repair complexes signalled by epigenetic modifications such as H2AX phosphorylation. Successful repair of DNA damage may allow the cell cycle to continue. Phosphorylation of H3 signals chromatin re-organisation including prophase initiation, global phosphorylation at metaphase and progression into anaphase (B, C Created with BioRender.com)
Fig. 2
Fig. 2
Nucleus and Micronucleus segmentation strategy in the IDEAS software. af Step-wise approach for generating the masks, ‘MN Mask A’ and ‘MN Mask B’, that combine to make ‘MN Mask 1’. a Intensity thresholding on the DNA stain channel removed 10% of the lower intensity pixels to generate ‘MN Mask A_Step 1’. b/c Shows how the MN events (MN Mask A) in MN Mask 1 were segmented. b The ‘Spot Mask’ function was applied to the pixels within MN MASK A_Step 1. Setting a low spot to background ratio extracted the brightest spots in the image regardless of the intensity differences between them. The minimum and maximum radius settings identified bright spots between 1–6 pixels in diameter (MN MASK A_Step 2). c The Range function was then applied to MN MASK A_Step 2. Setting the area minimum and maximum applied a size limitation to the spots identified, set at 1.25–25 µm. The aspect ratio setting defined criteria for the “roundness” of spots being segmented and was set at 0.4–1. df Demonstrates how the parent nucleus was segmented (MN Mask part B). d Using the ‘Level Set’ function at medium brightness level and contour detail level of 3 set the mask tight to the nuclear morphology (MN MASK B_Step1). e The dilate function was then applied to extend the mask boundary by 1 pixel (MN MASK B_ Step2) to better capture the outer boundary of the nucleus. f The Range function was then used to limit the size and shape range of identified nuclei. The minimum area value was set to the maximum area value in MN Mask A i.e. objects larger than any MN event were masked as parent nuclei. g Shows how MN MASK A and MN MASK B were subtracted using Boolean logic to yield MN MASK 1. This process was repeated for each of the three MN masks. h Combination of the three MN masks yielding the ‘Complete Final MN’ mask used for micronucleus segmentation. Demonstrates the segmentation achieved for each of the three MN masks. Use of the OR command enables all three masks to be used in combination. Use of the AND command restricts MN instances to those within the cytoplasm region. i Demonstrates use of ‘Feature Manager’ to plot a histogram of the number of MN events per cell
Fig. 3
Fig. 3
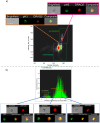
Gating strategy for cell cycle, p53, pH3 and ɣH2AX assessment. a Intensity histogram for DNA-stained cells showing gates for the ‘unstained population’ (UP) and events with DNA staining. b Gates were created for G1, S and G2/M cell cycle positions. The G1 gate (nuclear content n = 1) was positioned over the ‘primary peak’. The G2 gate was set by shifting the G1 gate upward by ~ 1.8–2×. Guided by the pH3 mitotic marker, an M gate was created. Its lower boundary was then combined with the G2 gate, providing the final G2/M population. The S gate was then defined as the region between the G1 and G2/M gates. c Fluorescence histogram for an unstained cell sample enabling positioning of an unstained peak gate. To define a gate for capturing positive PE (P53), AF488 (pH3) and BV421 (gH2AX) events (shown, d, f, i), this unstained peak gate was shifted to the right by a factor of 10. d, e Gating strategy for p53 positive events. d The ‘ Vehicle UP tenfold’ gate lower boundary was set 10% lower than the maximum autofluorescence determined from the US treated peak. e Final gate (‘overall P53’) used for p53 assessment. fh Gating strategy for pH3 gate generation. f The ‘Vehicle SP’ gate was set over the stained secondary peak (shown f). due to the definitive nature of the PH3 biomarker, this gate was then combined with the ‘Average tenfold gate’ lower boundary to give the ‘ + veAF488 (H3 gate)’. g Final gate position defining the ‘pH3 + VE’ population. Underneath, the ‘pH3 −VE’ population is shown. This population is highlighted according to cell cycle position (gates shown in b). The pH3 + ve population is distinctly separated and is seen to sit over the G2/M population as expected. h Cytoplasmic and nuclear pH3 signal was separated using the ‘similarity of morphology’ feature (exemplified, Fig. 4). Increasing signal overlap with the nuclear mask increases the similarity of morphology score. In this way the ‘True Nuclear bound pH3’ population was gated excluding any cytoplasmic or off target signal. ik Gating strategy for ɣH2AX populations. i Relative to cells not expressing gH2AX (primary peak) the + BV421 (gH2AX) and +  + BV421 (gH2AX) were positioned on the secondary peak. The positioning of these gates was informed by samples exposed or unexposed to a clastogen to separate background gH2AX expression from clastogenically-induced DNA damage. j Final gates used for gH2AX assessment. k The gH2AX +  + gated population was carried forward and refined to reflect the nuclear located gH2AX events yielding the ‘True Nuclear bound gH2AX’ population using similarity of morphology feature. Example raw data and a template file enabling reproduction of the gating strategy is provided for download at the BioStudies database under accession number S-BSST1351
Fig. 4
Fig. 4
Use of similarity of morphology to refine nuclear and cytoplasmic signals. A Scatter graph for a carbendazim sample (1.6 µg/mL) showing pH3 gating. The orange inset shows exclusion of events with signal outside the nucleus. However, the pink inset shows that events with cytoplasmic staining are still present. B Similarity of morphology was used to describe the degree of overlap between the signal and nuclear mask. The insets demonstrates events with different similarity of morphology scores. Scores < 0: pH3 signal is predominantly cytoplasmic, this population was termed ‘No Similarity’. Scores 0–1: Partial signal overlap with the nucleus, population termed ‘Intermediate’. Scores > 1: Signal predominantly exhibits nuclear localisation, this population was termed ‘Positive Similarity’
Fig. 5
Fig. 5
Dose–response relationships for carbendazim and methyl methane sulphonate (MMS). a, c MN, ɣH2AX, pH3 and p53 endpoints measured by imaging flow cytometry alongside relative cell growth information established from relative cell counts. Square-root transformations of the raw fold-change values were used to facilitate visualisation. Dashed lines represent the fold change cut offs which could be used to determine positive or negative calls for MN and the biomarkers pH3, p53 and ɣH2AX to inform on MoA. b, d relative proportion of cells at each cell cycle stage measured by imaging flow cytometry from nuclear intensity information. Asterisks indicate the statistical significance of responses relative to vehicle control levels (*p < 0.05 or **p < 0.005, Dunnett’s t-test method)

References

    1. Allemang A, Thacker R, DeMarco RA, Rodrigues MA, Pfuhler S (2021) The 3D reconstructed skin micronucleus assay using imaging flow cytometry and deep learning: a proof-of-principle investigation. Mutat Res Genet Toxicol Environ Mutagen 865:503314. 10.1016/j.mrgentox.2021.503314 10.1016/j.mrgentox.2021.503314 - DOI - PubMed
    1. Ando M, Yoshikawa K, Iwase Y, Ishiura S (2014) Usefulness of monitoring γ-H2AX and cell cycle arrest in HepG2 cells for estimating genotoxicity using a high-content analysis system. J Biomol Screen 19(9):1246–1254. 10.1177/1087057114541147 10.1177/1087057114541147 - DOI - PubMed
    1. Audebert M, Riu A, Jacques C et al (2010) Use of the γH2AX assay for assessing the genotoxicity of polycyclic aromatic hydrocarbons in human cell lines. Toxicol Lett 199(2):182–192. 10.1016/j.toxlet.2010.08.022 10.1016/j.toxlet.2010.08.022 - DOI - PubMed
    1. Avlasevich S, Bryce S, De Boeck M et al (2011) Flow cytometric analysis of micronuclei in mammalian cell cultures: past, present and future. Mutagenesis 26(1):147–152. 10.1093/mutage/geq058 10.1093/mutage/geq058 - DOI - PubMed
    1. Branda RF, O'Neill JP, Brooks EM, Trombley LM, Nicklas JA (2001) The effect of folate deficiency on the cytotoxic and mutagenic responses to ethyl methanesulfonate in human lymphoblastoid cell lines that differ in p53 status. Mutat Res 473(1):51–71. 10.1016/s0027-5107(00)00138-x - PubMed

LinkOut - more resources