

Exploring the Genetic Heterogeneity of Alzheimer's Disease: Evidence for Genetic Subtypes
- PMID: 38995775
- PMCID: PMC11636402
- DOI: 10.3233/JAD-231252
Exploring the Genetic Heterogeneity of Alzheimer's Disease: Evidence for Genetic Subtypes
Abstract
Background: Alzheimer's disease (AD) exhibits considerable phenotypic heterogeneity, suggesting the potential existence of subtypes. AD is under substantial genetic influence, thus identifying systematic variation in genetic risk may provide insights into disease origins.
Objective: We investigated genetic heterogeneity in AD risk through a multi-step analysis.
Methods: We performed principal component analysis (PCA) on AD-associated variants in the UK Biobank (AD cases = 2,739, controls = 5,478) to assess structured genetic heterogeneity. Subsequently, a biclustering algorithm searched for distinct disease-specific genetic signatures among subsets of cases. Replication tests were conducted using the Alzheimer's Disease Neuroimaging Initiative (ADNI) dataset (AD cases = 500, controls = 470). We categorized a separate set of ADNI individuals with mild cognitive impairment (MCI; n = 399) into genetic subtypes and examined cognitive, amyloid, and tau trajectories.
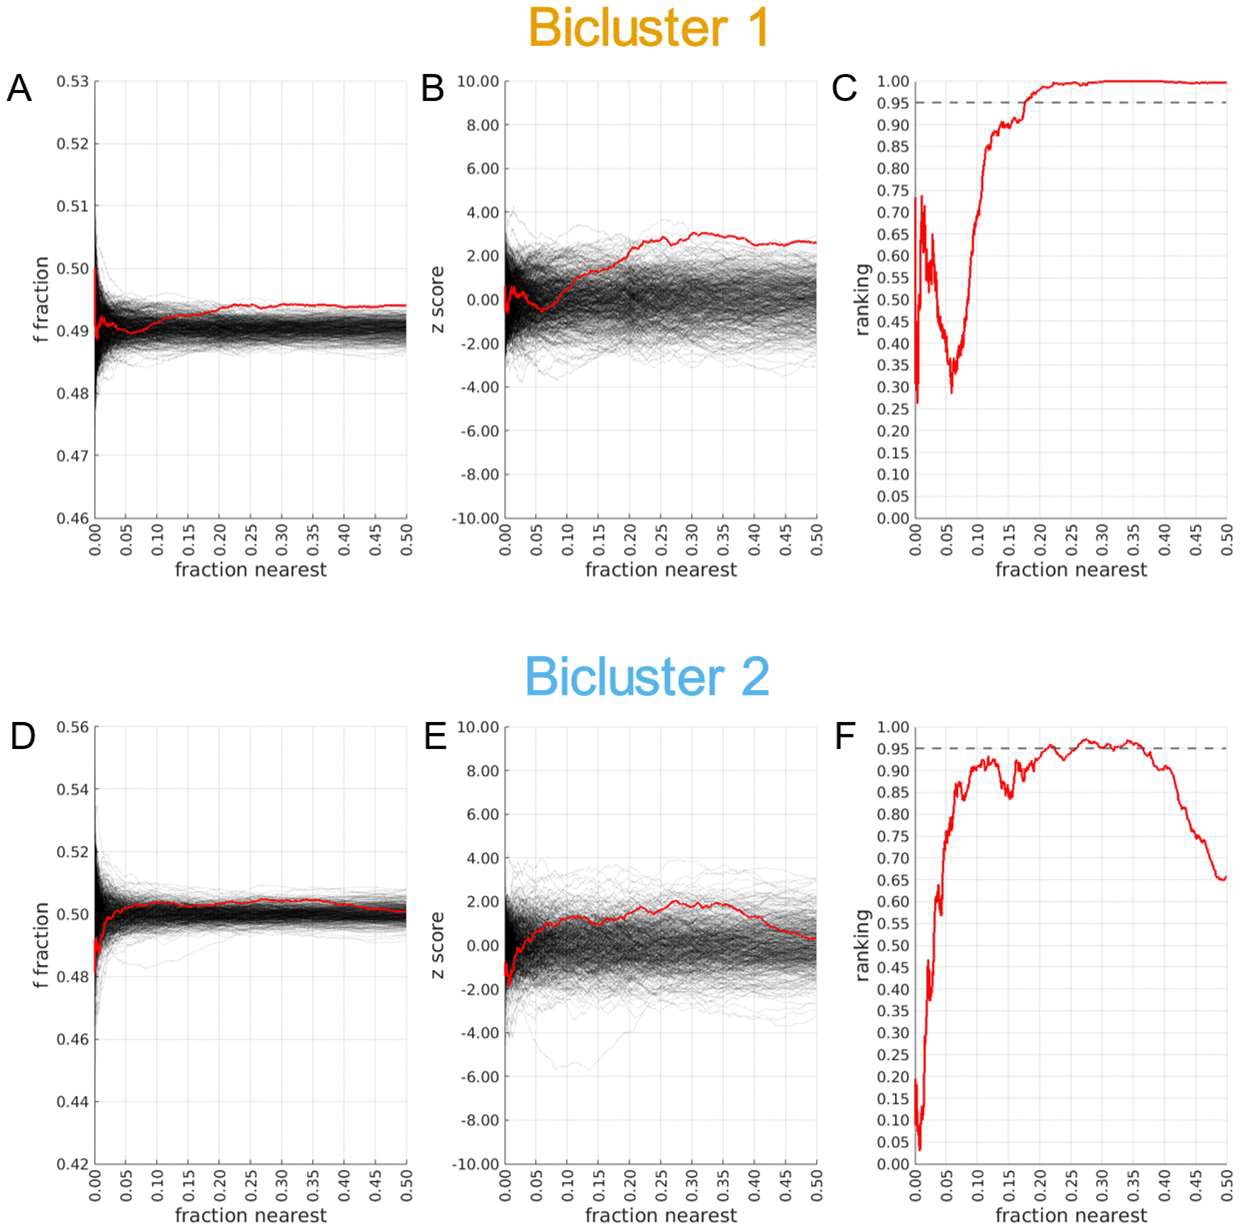
Results: PCA revealed three distinct clusters ("constellations") driven primarily by different correlation patterns in a region of strong LD surrounding the MAPT locus. Constellations contained a mixture of cases and controls, reflecting disease-relevant but not disease-specific structure. We found two disease-specific biclusters among AD cases. Pathway analysis linked bicluster-associated variants to neuron morphogenesis and outgrowth. Disease-relevant and disease-specific structure replicated in ADNI, and bicluster 2 exhibited increased cerebrospinal fluid p-tau and cognitive decline over time.
Conclusions: This study unveils a hierarchical structure of AD genetic risk. Disease-relevant constellations may represent haplotype structure that does not increase risk directly but may alter the relative importance of other genetic risk factors. Biclusters may represent distinct AD genetic subtypes. This structure is replicable and relates to differential pathological accumulation and cognitive decline over time.
Keywords: Alzheimer’s disease; biclustering; genetic risk; genetic subtypes; genotyping.
Conflict of interest statement
Conflict of interest
Jeremy Elman is an Editorial Board Member of this journal but was not involved in the peer-review process of this article nor had access to any information regarding its peer-review. All other authors have no conflict of interest to report.
Figures


Update of
-
Exploring the genetic heterogeneity of Alzheimer's disease: Evidence for genetic subtypes.medRxiv [Preprint]. 2024 May 3:2023.05.02.23289347. doi: 10.1101/2023.05.02.23289347. medRxiv. 2024. Update in: J Alzheimers Dis. 2024;100(4):1209-1226. doi: 10.3233/JAD-231252. PMID: 37205553 Free PMC article. Updated. Preprint.
Similar articles
-
Exploring the genetic heterogeneity of Alzheimer's disease: Evidence for genetic subtypes.medRxiv [Preprint]. 2024 May 3:2023.05.02.23289347. doi: 10.1101/2023.05.02.23289347. medRxiv. 2024. Update in: J Alzheimers Dis. 2024;100(4):1209-1226. doi: 10.3233/JAD-231252. PMID: 37205553 Free PMC article. Updated. Preprint.
-
Pathophysiological subtypes of Alzheimer's disease based on cerebrospinal fluid proteomics.Brain. 2020 Dec 1;143(12):3776-3792. doi: 10.1093/brain/awaa325. Brain. 2020. PMID: 33439986 Free PMC article.
-
Alzheimer's disease susceptibility locus in CD2AP is associated with increased cerebrospinal fluid tau levels in mild cognitive impairment.Neurosci Lett. 2022 Feb 6;771:136419. doi: 10.1016/j.neulet.2021.136419. Epub 2021 Dec 24. Neurosci Lett. 2022. PMID: 34958910
-
Genetic studies of quantitative MCI and AD phenotypes in ADNI: Progress, opportunities, and plans.Alzheimers Dement. 2015 Jul;11(7):792-814. doi: 10.1016/j.jalz.2015.05.009. Alzheimers Dement. 2015. PMID: 26194313 Free PMC article. Review.
-
2014 Update of the Alzheimer's Disease Neuroimaging Initiative: A review of papers published since its inception.Alzheimers Dement. 2015 Jun;11(6):e1-120. doi: 10.1016/j.jalz.2014.11.001. Alzheimers Dement. 2015. PMID: 26073027 Free PMC article. Review.
Cited by
-
On the effect heterogeneity of established disease susceptibility loci for Alzheimer's disease across different genetic ancestries.Alzheimers Dement. 2024 May;20(5):3397-3405. doi: 10.1002/alz.13796. Epub 2024 Apr 2. Alzheimers Dement. 2024. PMID: 38563508 Free PMC article.
-
Synergistic activity of nootropic herbs as potent therapeutics for Alzheimer's disease: A cheminformatics, pharmacokinetics, and system pharmacology approach.J Alzheimers Dis Rep. 2024 Dec 23;8(1):1745-1762. doi: 10.1177/25424823241307019. eCollection 2024. J Alzheimers Dis Rep. 2024. PMID: 40034353 Free PMC article.
-
Heterogeneity analysis provides evidence for a genetically homogeneous subtype of bipolar-disorder.ArXiv [Preprint]. 2024 Oct 27:arXiv:2405.00159v2. ArXiv. 2024. Update in: PLoS One. 2025 Jan 29;20(1):e0314288. doi: 10.1371/journal.pone.0314288. PMID: 38745705 Free PMC article. Updated. Preprint.
References
-
- McKhann GM, Knopman DS, Chertkow H, Hyman BT, Jack CR Jr., Kawas CH, Klunk WE, Koroshetz WJ, Manly JJ, Mayeux R, Mohs RC, Morris JC, Rossor MN, Scheltens P, Carrillo MC, Thies B, Weintraub S, Phelps CH (2011) The diagnosis of dementia due to Alzheimer’s disease: recommendations from the National Institute on Aging-Alzheimer’s Association workgroups on diagnostic guidelines for Alzheimer’s disease. Alzheimers Dement 7, 263–269. - PMC - PubMed
-
- Vogel JW, Young AL, Oxtoby NP, Smith R, Ossenkoppele R, Strandberg OT, La Joie R, Aksman LM, Grothe MJ, Iturria-Medina Y, Alzheimer’s Disease Neuroimaging I, Pontecorvo MJ, Devous MD, Rabinovici GD, Alexander DC, Lyoo CH, Evans AC, Hansson O (2021) Four distinct trajectories of tau deposition identified in Alzheimer’s disease. Nat Med 27, 871–881. - PMC - PubMed
-
- Young AL, Marinescu RV, Oxtoby NP, Bocchetta M, Yong K, Firth NC, Cash DM, Thomas DL, Dick KM, Cardoso J, van Swieten J, Borroni B, Galimberti D, Masellis M, Tartaglia MC, Rowe JB, Graff C, Tagliavini F, Frisoni GB, Laforce R Jr., Finger E, de Mendonca A, Sorbi S, Warren JD, Crutch S, Fox NC, Ourselin S, Schott JM, Rohrer JD, Alexander DC, Genetic FTDI, Alzheimer’s Disease Neuroimaging I (2018) Uncovering the heterogeneity and temporal complexity of neurodegenerative diseases with Subtype and Stage Inference. Nat Commun 9, 4273. - PMC - PubMed
MeSH terms
Substances
Grants and funding
LinkOut - more resources
Full Text Sources
Medical
Research Materials
