. 2024 Jul 12;9(97):eadn0178.
doi: 10.1126/sciimmunol.adn0178. Epub 2024 Jul 12.

Initiator cell death event induced by SARS-CoV-2 in the human airway epithelium

Affiliations

Initiator cell death event induced by SARS-CoV-2 in the human airway epithelium

Kaixin Liang et al. Sci Immunol. .

Erratum in

Abstract

Virus-induced cell death is a key contributor to COVID-19 pathology. Cell death induced by severe acute respiratory syndrome coronavirus 2 (SARS-CoV-2) is well studied in myeloid cells but less in its primary host cell type, angiotensin-converting enzyme 2 (ACE2)-expressing human airway epithelia (HAE). SARS-CoV-2 induces apoptosis, necroptosis, and pyroptosis in HAE organotypic cultures. Single-cell and limiting-dilution analysis revealed that necroptosis is the primary cell death event in infected cells, whereas uninfected bystanders undergo apoptosis, and pyroptosis occurs later during infection. Mechanistically, necroptosis is induced by viral Z-RNA binding to Z-DNA-binding protein 1 (ZBP1) in HAE and lung tissues from patients with COVID-19. The Delta (B.1.617.2) variant, which causes more severe disease than Omicron (B1.1.529) in humans, is associated with orders of magnitude-greater Z-RNA/ZBP1 interactions, necroptosis, and disease severity in animal models. Thus, Delta induces robust ZBP1-mediated necroptosis and more disease severity.


Conflict of interest statement

J.P.-Y.T is a cofounder of IMMvention Therapeutix.

Figures

Figure. 1.
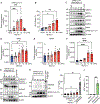
Figure. 1.. SARS-CoV-2 infection activates necroptosis and apoptosis but not pyroptosis in A549-ACE2 cells.
A549-ACE2 cells were infected with SARS-CoV-2 Washington isolate (USA/WA-1/2020; WA-1) at an MOI of 0.5. (A) RT-qPCR of SARS-CoV-2 N expression. (B) LDH release from A549-ACE2 infected with SARS-CoV-2. (C) Immunoblots of indicated proteins in A549-ACE2 cells infected with SARS-CoV-2 or treated with a positive control of necroptosis (TNF 100 ng/mL + SMAC 50 nM +ZVAD 100 μM) for 24 hrs. Asterisk (*) indicates relevant protein band. (D-F) RT-qPCR of indicated gene expressions. (G) Immunoblots of indicated proteins in A549-ACE2 infected with SARS-CoV-2 or treated with a positive control of apoptosis (CHX 10ug/mL + TNF 20ng/mL) for 24 hrs. (H) IL-1β ELISA from A549-ACE2 infected with SARS-CoV-2 or from a positive control of HAE primed with Pam3-CSK4 (10μg/mL for 3hrs) and stimulated with Talabostat (10μM for 18 hrs). Data shown are representative of three independent experiments. Individual replicates are shown as individual points on the bar graphs. Data are shown as mean ± SEM. *p < 0.05, **p<0.01, ***p < 0.001, ****p < 0.0001, ordinary one-way ANOVA followed by Dunnet’s multiple comparison test (A, B, D-F).
Figure 2.
Figure 2.. SARS-CoV-2 infection activates necroptosis and apoptosis in HAE.
HAE were infected with SARS-CoV-2 WA-1 at an MOI of 0.5. (A) RT-qPCR of SARS-CoV-2 N expression. (B) LDH release from HAE infected with SARS-CoV-2. (C) Immunoblots of indicated proteins in HAE infected with SARS-CoV-2 or treated with a positive control of necroptosis (TNF 100 ng/mL + SMAC 50 nM +ZVAD 100 μM) for 24 hrs. Asterisk (*) indicates relevant protein band. (D-F) RT-qPCR of indicated gene expressions. (G) Immunoblots of indicated proteins in HAE infected with SARS-CoV-2 or treated with a positive control of apoptosis (CHX 10ug/mL + TNF 20ng/mL) for 24 hrs. Asterisk (*) indicates relevant protein band. (H, I) Immunoblots of indicated proteins (H) and IL-1β ELISA (I) from HAE infected with SARS-CoV-2 or HAE primed with Pam3-CSK4 (10 μg/mL for 3 hrs) and stimulated with Talabostat (10 μM for18 hrs). Asterisk (*) indicates relevant protein band. (J) Quantification of ASC speck+ cells in total cells. Each data point represents one HAE donor. Representative data or averaged data from three or more independent experiments are shown as mean ±SEM. *p < 0.05, **p < 0.01, ***p < 0.001, ****p < 0.0001, ordinary one-way ANOVA followed by Tukey’s, Dunnet’s, or Dunn’s multiple comparison test (A, B, D-F, I, J).
Figure 3.
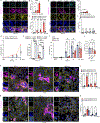
Figure 3.. SARS-CoV-2 infection triggers necroptosis in infected cells and apoptosis in both infected and bystander cells in A549-ACE2 cells.
A549-ACE2 were infected with SARS-CoV-2 WA-1 at an MOI of 0.5 or indicated MOIs for 72 hours. (A) Representative images of pMLKL+/SARS-CoV-2+ cells. (B, C) Quantification of pMLKL+ cells (B), pMLKL+/SARS-CoV-2+ or pMLKL+/SARS-CoV-2-cells (C) in total cells. (D) Representative images of cleaved caspase-3+ (c-casp3+)/SARS-CoV-2-cells. (E, F) Quantification of c-casp3+ cells (E), c-casp3+/SARS-CoV-2+ or c-casp3+/SARS-CoV-2- (F) in total cells. (G) Quantification of indicated protein+ cells in total cells. (H) Quantification of indicated protein+ cells in total cells at 72 HPI. (I, J) LDH release (I) and quantification of indicated protein positive cells in total cells (J) from WT or MLKL KO cells. (K, L) Representative images (K) and quantification (L) of pMLKL+/SARS-CoV-2+ cells with indicated MOIs. (M, N) Representative images (M) and quantification (N) of c-casp3+/SARS-CoV-2-cells with indicated MOIs. Scale bar: 10μm (A, D) or 40μm (K, M). Data are representative of three or more independent replicates with individual points representing individual replicates. Data are shown as mean ± SEM. *p < 0.05, **p < 0.01, ***p < 0.001, ****p < 0.0001, ordinary one-way ANOVA followed by Tukey’s or Dunnet’s multiple comparison test (B, E, J) or two-way ANOVA followed by Sidak’s multiple comparison test (C, F, G-I).
Figure 4.
Figure 4.. SARS-CoV-2 infection triggers necroptosis in infected cells and apoptosis in both infected and bystander cells in HAE and COVID-19 autopsy lungs.
HAE were infected with SARS-CoV-2 WA-1 at an MOI of 0.5. (A) Representative images of pMLKL staining in SARS-CoV-2 infected HAE cells. (B) Quantification of pMLKL+/SARS-CoV-2+ or pMLKL+/SARS-CoV-2-cells in total cells. (C) Representative images of cleaved caspase-3 staining in bystander HAE cells lacking SARS-CoV-2 N protein. (D) Quantification of cleaved caspase-3+/SARS-CoV-2+ or cleaved caspase-3+/SARS-CoV-2-cells in total cells. (E) Representative images of pMLKL staining in COVID-19 autopsy lung. (F) Quantification of pMLKL+/SARS-CoV-2+ or pMLKL+/SARS-CoV-2-cells in total cells. (G) Representative images of cleaved caspase-3 staining in COVID-19 autopsy lung. (H) Quantification of cleaved caspase-3+/SARS-CoV-2+ or cleaved caspase-3+/SARS-CoV-2-cells in total cells. (I) Representative images of ASC speck in COVID-19 autopsy lung. (J) Quantification of ASC+/CD11c+ or ASC+/CD11c-cells in total cells. Scale bar: 10μm (A, C) or 20μm (F, H, J). Data are collected from three or more independent experiments. Individual data points represent individual replicates, HAE donors, or COVID-19 patients. Data are shown as mean ± SEM. *p < 0.05, **p < 0.01, ***p < 0.001, ****p < 0.0001, two-way ANOVA followed by Sidak’s multiple comparison test (B, D) or Student’s t test (F, H, J).
Figure 5.
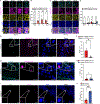
Figure 5.. SARS-CoV-2 activates the necroptotic protein ZBP1 through detection of Z-RNA generated during infection.
(A, B) RT-qPCR of ZBP1 expression in A549-ACE2 cells (A) or HAE (B) infected with SARS-CoV-2. (C, D) Immunoblots of indicated proteins in A549-ACE2 cells (C) and HAE (D) infected with SARS-CoV-2. (E) RT-qPCR of indicated gene expression in HAE infected with SARS-CoV-2 together with ruxolitinib (5 nM), baricitinib (6 nM), or pyridone 6 (15 μM) treatment. (F, G) Representative images (F) and quantification (G) of Z-RNA staining in SARS-CoV-2 infected A549-ACE2 cells. (H) Representative images of Z-RNA staining in HAE infected with SARS-CoV-2. (I, J) Representative image (I) and quantification (J) of PLA between Z-RNA and ZBP1 in A549-ACE2 cells infected with SARS-CoV-2 at 72 HPI. (K) Immunoblots of indicated proteins in WT or ZBP1 KO HAE infected with SARS-CoV-2. Scale bar: 10μm (F, H) or 20μm (I). Each dot represents an individual repeat, HAE donor, or human COVID-19 patient. Data collected from three or more independent experiments are shown as mean ± SEM. *p < 0.05, **p < 0.01, ***p < 0.001, ****p < 0.0001, ordinary one-way ANOVA followed by Dunnet’s multiple comparison test (A, B, E), two-way ANOVA followed by Sidak’s multiple comparison test (G), or two-tailed t test (J).
Figure 6.
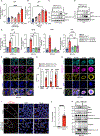
Figure 6.. SARS-CoV-2 delta variant causes exacerbated cell death compared to the Omicron variant.
(A-H) LDH release (A), representative images (B), RT-qPCR of SARS-CoV-2 N (C), plaque assay (D), and RT-qPCR of indicated genes (E-H) in A549-ACE2 cells infected with variants. (I, J) Representative images (I) and quantification (J) of pMLKL in A549-ACE2 cells infected with variants. (K, L) Body weight change (K) and survival (L) of K18-hACE2 infected with variants (8 mice/group). (M, N) Representative image (M) and quantification (N) of PLA between Z-RNA and ZBP1 in lungs from K18-hACE2 mice infected with variants at 4 DPI. (O) RT-qPCR of SARS-CoV-2 N expression in lung homogenates from K18-hACE2 mice infected with variants at 4 DPI. (P) Correlation between PLA puncta and viral titer in COVID-19 autopsy lung with Pearson correlation coefficient (r) shown. Scale bar: 100μm (B), 10μm (I), or 20μm (M). Data are collected from three or more independent experiments with individual data points representing individual experiments, mice, or COVID-19 patients. Data are shown as mean ± SEM. *p < 0.05, **p < 0.01, ***p < 0.001, ****p < 0.0001, two-way ANOVA followed by Sidak’s multiple comparison test (A, C-H, J), Mann-Whitney test for area under the curve (AUC) (K), log-rank (Mantel Cox) test (L), or two-tailed t test (N, O).
Figure 7.
Figure 7.. Proposed mechanism of the cell death responses triggered by SARS-CoV-2.
SARS-CoV-2 infects lung epithelial cells through the ACE2 receptor and generates Z-RNA in the infected cells (labeled in red). The virus-derived Z-RNA is sensed by host protein ZBP1 which initiates necroptosis and phosphorylation and translocation of MLKL. In the bystander cells that are not infected by SARS-CoV-2 (labeled in brown), caspase-3 is activated and cleaves GSDME, and the latter forms GSDME pores on the plasma membrane. Delta (B.1.617.2) and Omicron (B.1.1.529) variants cause necroptosis but in different magnitudes, with Delta being the strongest trigger and Omicron being the weakest trigger of cell death responses.

References

    1. Del Valle DM et al., An inflammatory cytokine signature predicts COVID-19 severity and survival. Nat Med 26, 1636–1643 (2020). - PMC - PubMed
    1. Wang Y, Perlman S, COVID-19: Inflammatory Profile. Annu Rev Med 73, 65–80 (2022). - PubMed
    1. Savan R, Gale M Jr., Innate immunity and interferon in SARS-CoV-2 infection outcome. Immunity 56, 1443–1450 (2023). - PMC - PubMed
    1. Nyberg T. et al., Comparative analysis of the risks of hospitalisation and death associated with SARS-CoV-2 omicron (B.1.1.529) and delta (B.1.617.2) variants in England: a cohort study. Lancet 399, 1303–1312 (2022). - PMC - PubMed
    1. Doll MK et al., Acute and Postacute COVID-19 Outcomes Among Immunologically Naive Adults During Delta vs Omicron Waves. JAMA Netw Open 6, e231181 (2023). - PMC - PubMed

Publication types

Substances

Supplementary concepts