. 2024 Jul 12;10(28):eadm8206.
doi: 10.1126/sciadv.adm8206. Epub 2024 Jul 12.

Melanoma progression and prognostic models drawn from single-cell, spatial maps of benign and malignant tumors

Affiliations

Melanoma progression and prognostic models drawn from single-cell, spatial maps of benign and malignant tumors

Nick R Love et al. Sci Adv. .

Abstract

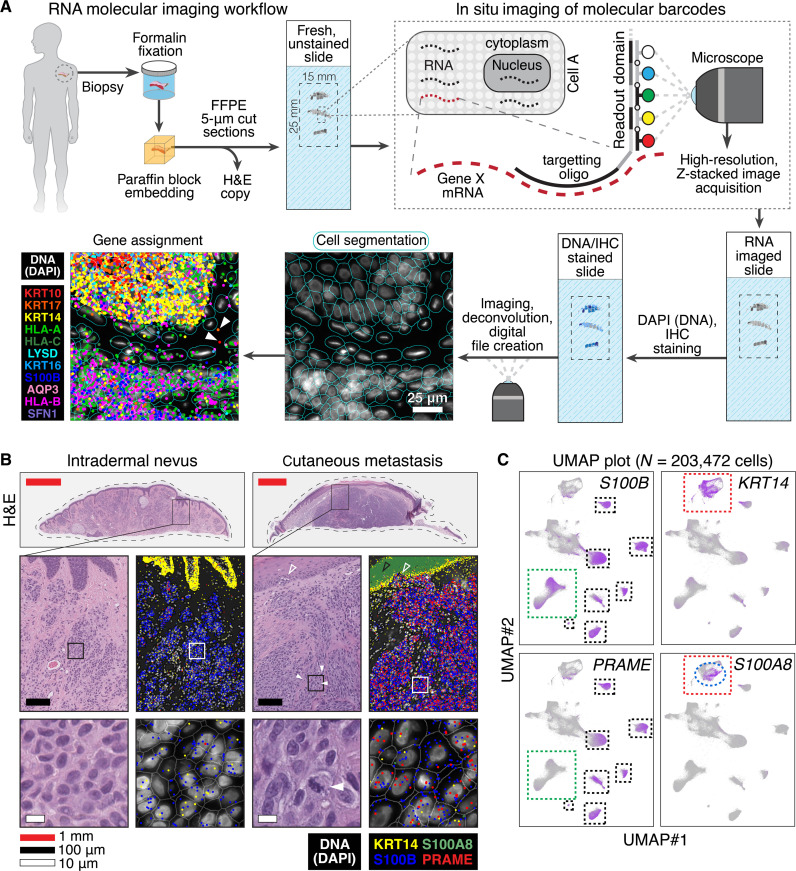
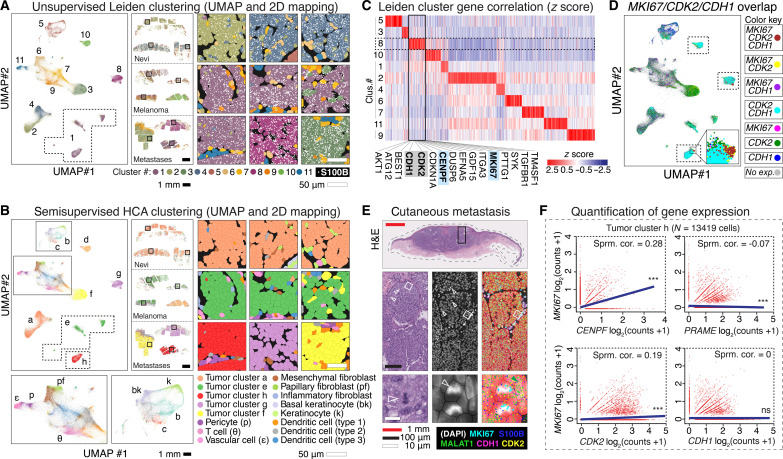
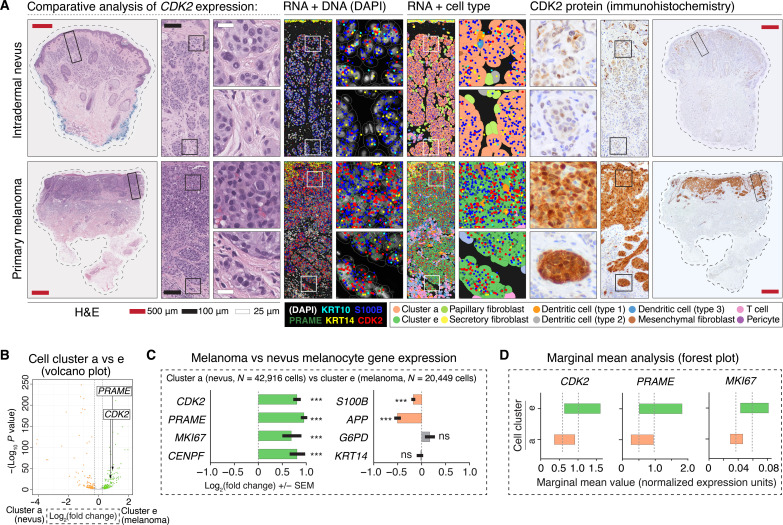
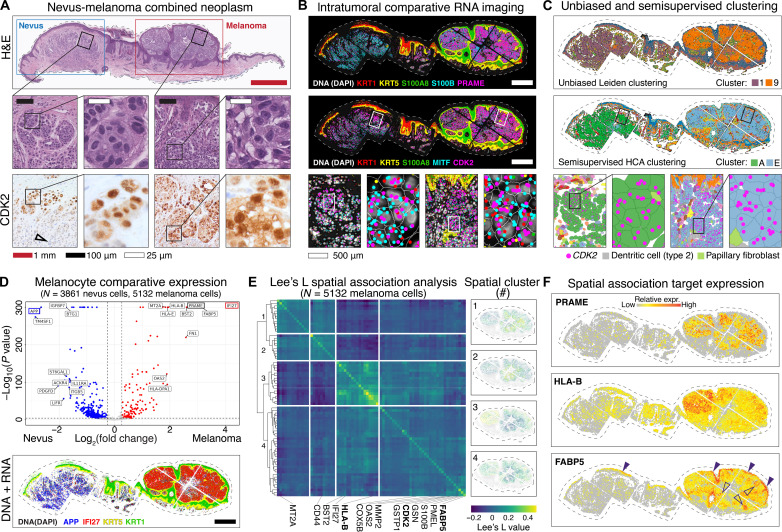
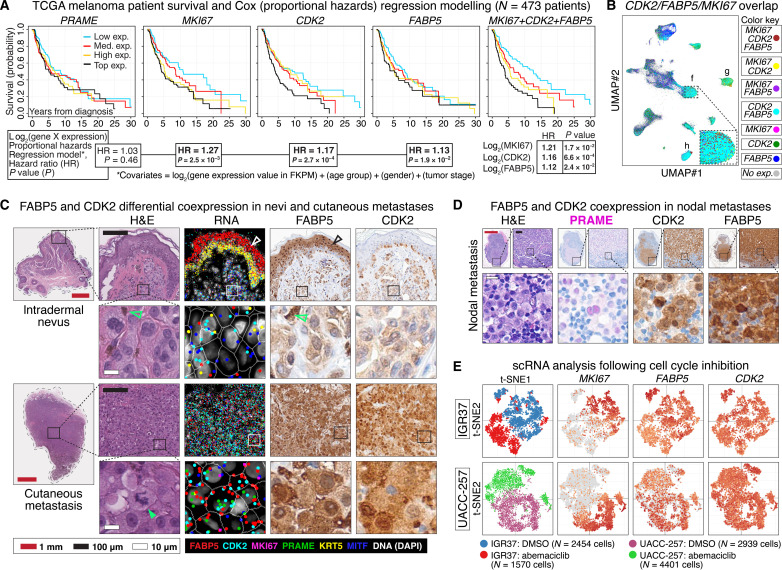
Melanoma clinical outcomes emerge from incompletely understood genetic mechanisms operating within the tumor and its microenvironment. Here, we used single-cell RNA-based spatial molecular imaging (RNA-SMI) in patient-derived archival tumors to reveal clinically relevant markers of malignancy progression and prognosis. We examined spatial gene expression of 203,472 cells inside benign and malignant melanocytic neoplasms, including melanocytic nevi and primary invasive and metastatic melanomas. Algorithmic cell clustering paired with intratumoral comparative two-dimensional analyses visualized synergistic, spatial gene signatures linking cellular proliferation, metabolism, and malignancy, validated by protein expression. Metastatic niches included up-regulation of CDK2 and FABP5, which independently predicted poor clinical outcome in 473 patients with melanoma via Cox regression analysis. More generally, our work demonstrates a framework for applying single-cell RNA-SMI technology toward identifying gene regulatory landscapes pertinent to cancer progression and patient survival.


Figures

Fig. 1.
Fig. 1.. Single-cell RNA-based SMI generates maps of gene expression within benign, malignant, and metastatic melanocytic neoplasms.
(A) FFPE samples are sectioned and undergo SMI (18). Native RNA is hybridized in situ to gene-specific antisense oligonucleotides fused to multiplexed readout domains, which undergo cyclical reactions with four different fluorophores (Alexa Fluor 488, ATTO 532, Dyomics-605, or Alexa Fluor 647) or null, nonfluorescent domain (represented in white). The readout domain length and number of iterative cycles are plexed to allow detection of ~1000 unique genes. Slides are then stained with DAPI to detect nuclei and other IHC markers, which facilitate automated cell segmentation in silico. Segmented cells and nuclei generate a “map” onto which RNA transcripts are assigned. Bottom left panels show epidermis above melanocyte-containing tissue with 11 differentially colored gene transcripts, with DAPI shown in white. The solid white arrows show a detected RNA transcript outside a cell border, which may represent a z-axis out-of-plane RNA or extracellular RNA. (B) H&E and RNA imaging of an intradermal nevus and cutaneous melanoma metastasis. The solid outlined, rectangular boxes in panels show highlighted insets below. The panels show the expected increased detection of melanoma marker PRAME amongst the S100B melanocytes of metastatic melanoma as well as the expected increase in S100A8 (black open arrow) in epidermal keratinocytes (marked by KRT14) overlying the malignant proliferation. Closed arrows show mitotic cells. Open arrow shows malignant melanocytes juxtaposed to the epidermis. (C) UMAP projections of gene expression amongst 203,472 cells analyzed in 10 patient-derived tumors. S100B expression includes melanocytes, a subset of which express melanoma marker PRAME (black versus green dashed boxes); the red dashed box shows epidermal keratinocytes that express KRT14, a subset of which express S100A8 (blue dashed ellipse).
Fig. 2.
Fig. 2.. Clustering analyses identify a proliferative gene signature that includes CDK2.
(A) UMAP projection of 203,472 cells into 11 unsupervised Leiden clusters, 2D mapped onto the nevi, melanoma, and cutaneous metastases samples. Black square insets magnified in right panels, showing portions of melanocytic tumors expressing S100B (white dots). (B) UMAP and 2D mapping with semisupervised clusters using HCA skin reference (solid rectangles magnified below). Black square insets magnified in right panels. (C) Heatmap of normalized gene expression in Leiden clusters. Proliferative markers MKI67 and CENPF localized to cluster 8, which also included melanoma-associated proliferative genes CDK2 and CDH1 (top hits listed below cluster in alphabetical order). (D) UMAP projection with combinatorial overlap of MKI67-, CDK2-, and CDH1-expressing cells; inset shows a portion of cluster h enriched for MKI67, CDK2, and CDH1 coexpression. (E) H&E and RNA-SMI of MKI67, CDK2, CDH1, S100B, and predominately nuclear localized MALAT1 within cutaneous metastasis #1 (predominately composed of tumor cluster h–type cells). Black solid rectangle is magnified in the middle horizontal row; white solid squares magnified in the bottom horizontal row. White open arrows point to mitoses. Green arrow shows predominately nuclear localization of MALAT1. The middle column DAPI panels are overlayed in the right column with semisupervised HCA cell clusters, most of which are tumor cluster h, as shown in (B). Detected RNA transcripts are shown as outlined in the key at bottom right key. Collectively, the panels show expression of MKI67, CDK2, and CDH1 in cells of the mitotically active portion of the tumor. (F) Gene expression correlation of tumor cluster h, showing a positive Spearman correlation (Sprm. cor.) of CENPF and CDK2 with MKI67 (correlation absent with PRAME and CDH1). ***, adjusted P value < 0.0001; ns, P value > 0.05.
Fig. 3.
Fig. 3.. Candidate gene analysis reveals differential tumor-stroma boundary expression of CDK2.
(A) Panels show the comparative loss of CDK2 expression in dermal melanocytes of intradermal nevi versus retained expression of CDK2 in dermally invasive primary melanoma. Left H&E panels have solid rectangular insets subsequently magnified in the rightward panels. H&E stains show characteristic, bland appearing nested melanocytes of an intradermal nevus versus the hyperchromatic, crowded, and pleomorphic cells of primary melanoma. RNA + DNA panels show comparatively increased expression of CDK2 and PRAME in S100B-expressing malignant melanoma melanocytes. RNA + cell type panels show semisupervised HCA clustering of the cells of the tumor, with annotation of intradermal nevus-like melanocytes (cluster a) and malignant melanoma melanocytes (cluster e). Right panels show CDK2 protein expression, which was notable for comparatively increased expression at the deep, tumor-stroma border in malignant melanoma versus nevus. (B) Volcano plot showing quantification of differential gene expression between nevus (cluster a) and melanoma (cluster e) melanocytes. Each dot on this plot represents a gene. The location of PRAME and CDK2 within the plot is shown. Orange dots represent genes with higher expression in nevus (cluster a), whereas green dots represent genes with higher expression in melanoma (cluster e). Gray dots represent genes that failed to reach the FDR threshold of 0.05 (Benjamini-Hochberg correction). (C) Bar graphs highlighting select genes from volcano plot shown in (B). ***P value < 0.0001; ns, P value > 0.05. Error bars show SEM. (D) Forest plots showing marginal means (gray dashed line) with a 95% confidence interval. Note that graphics shown in (B) to (D) are different ways to visualize the same quantification of differential expression of PRAME, CDK2, MKI67, and other genes between clusters a and e.
Fig. 4.
Fig. 4.. Intratumoral spatial analyses reconcile field-level proliferative and metabolic gene expression signatures.
(A) Melanocytic tumor with nevus and malignant melanoma portions, with insets shown as indicated by black squares. Bottom row shows nuclear and cytoplasmic CDK2 protein expression in melanocytes. Black open arrow shows loss of CDK2 expression in deep nevus cells. (B) Top panel shows comparatively increased PRAME and S100A8 in melanoma portion of the tumor. The middle panel shows expression of CDK2 and melanocytic marker MITF, progressively magnified as indicated with white bordered rectangular insets. (C) Unsupervised Leiden (top) and semisupervised HCA (middle) clustering generated nevus-type and melanoma-type melanocyte clusters (clusters A and E, respectively). (D) Top panel shows volcano plot of differential gene expression between nevus (cluster A) and melanoma (cluster E) melanocytes. Blue dots represent genes with higher expression in nevus (cluster A), whereas red dots represent genes with higher expression in melanoma (cluster E). Gray dots represent genes that failed to reach the FDR threshold of 0.05 (Benjamini-Hochberg correction). The top hit in each condition outlined in blue (APP) or red (IFI27) were mapped out in the bottom DNA + RNA imaging panel. Scale bar: 500 μm. (E) Heatmap shows results of Lee’s L spatial association analysis of malignant melanocytes (cluster E), with each row and column representing a spatially patterned gene. Genes clustered into four hierarchical fields as numbered on the left. This spatial analysis used a combination of proximity and differential expression level to define four distinct fields of gene expression within the melanoma. The panels on the right show the normalized expression of all genes in each numbered field. (F) Spatial plots showing relative expression of known gene PRAME as well as immunoregulatory gene HLA-B and metabolic genes FABP5, which spatially clustered with CDK2 [field 4 in (E)].
Fig. 5.
Fig. 5.. Differential expression of MKI67, CDK2, and FABP5 retrospectively predicts melanoma patient survival.
(A) Kaplan-Meier survival curves from 473 patients with melanoma after stratification into low, medium (med.), and high and top expression quartiles of PRAME, MKI67, CDK2, and FABP5. Rightmost curve shows the comparatively increased differential survival stratification using the sum of log2 MKI67, CDK2, and FABP5 expression. Cox (proportional hazards) regression analyses HRs with their respective P values are shown below each Kaplan-Meier curve. The Cox regression analyses were based on a model that included gene expression values, patient age, gender, and tumor stage as covariates. The analysis showed that expression of MKI67, CDK2, and FABP5 was statistically significant and independent predictors of poor prognosis. (B) UMAP shows combinatorial overlap of MKI67-, CDK2-, and FABP5-expressing cells enriched in the metastatic melanoma cell clusters f, g, and h identified in Fig. 2. (C) The panels show comparative increased expression of CDK2 and FABP5 in metastatic melanoma compared to nevus, both at the RNA and protein level. White and black bordered rectangles are magnified in adjacent panels as shown. White open and black arrowheads show expression of FABP5 RNA and protein in the upper layers of the epidermis. Green open arrows show normal, physiologic melanin visible in both H&E- and IHC-processed tissue sections. Green closed arrow shows atypical mitotic figure within metastatic melanoma. (D) Protein expression of PRAME, CDK2, and FABP5 highlight malignant melanoma metastasized to lymph node. (E) scRNA expression following cell cycle inhibition using CDK4/6 inhibitor abemaciclib or control (DMSO) in melanoma IGR37 (top row) and UACC-257 (bottom row) cell lines. The t-SNE plots show loss of MKI67 expression, partial loss of FABP5, and comparatively little change in CDK2 expression in abemaciclib-treated cells versus control.

References

    1. Yeh I., Bastian B. C., Melanoma pathology: New approaches and classification. Br. J. Dermatol. 185, 282–293 (2021). - PMC - PubMed
    1. Yeh I., Update on classification of melanocytic tumors and the role of immunohistochemistry and molecular techniques. Semin. Diagn. Pathol. 39, 248–256 (2022). - PubMed
    1. Widmer D. S., Cheng P. F., Eichhoff O. M., Belloni B. C., Zipser M. C., Schlegel N. C., Javelaud D., Mauviel A., Dummer R., Hoek K. S., Systematic classification of melanoma cells by phenotype-specific gene expression mapping. Pigment Cell Melanoma Res. 25, 343–353 (2012). - PubMed
    1. Hoek K. S., Eichhoff O. M., Schlegel N. C., Döbbeling U., Kobert N., Schaerer L., Hemmi S., Dummer R., In vivo switching of human melanoma cells between proliferative and invasive states. Cancer Res. 68, 650–656 (2008). - PubMed
    1. Hossain S. M., Eccles M. R., Phenotype switching and the melanoma microenvironment; impact on immunotherapy and drug resistance. Int. J. Mol. Sci. 24, 1601 (2023). - PMC - PubMed

Publication types

MeSH terms