. 2024 Oct 3;36(10):4457-4471.
doi: 10.1093/plcell/koae200.

PHOSPHATASE 2A dephosphorylates PHYTOCHROME-INTERACTING FACTOR3 to modulate photomorphogenesis in Arabidopsis

Affiliations

PHOSPHATASE 2A dephosphorylates PHYTOCHROME-INTERACTING FACTOR3 to modulate photomorphogenesis in Arabidopsis

Xingbo Cai et al. Plant Cell. .

Abstract

The phytochrome (phy) family of sensory photoreceptors modulates developmental programs in response to ambient light. Phys also control gene expression in part by directly interacting with the bHLH class of transcription factors, PHYTOCHROME-INTERACTING FACTORS (PIFs), and inducing their rapid phosphorylation and degradation. Several kinases have been shown to phosphorylate PIFs and promote their degradation. However, the phosphatases that dephosphorylate PIFs are less understood. In this study, we describe 4 regulatory subunits of the Arabidopsis (Arabidopsis thaliana) protein PHOSPHATASE 2A (PP2A) family (B'α, B'β, B″α, and B″β) that interact with PIF3 in yeast 2-hybrid, in vitro and in vivo assays. The pp2ab″αβ and b″αβ/b'αβ mutants display short hypocotyls, while the overexpression of the B subunits induces longer hypocotyls compared with the wild type (WT) under red light. The light-induced degradation of PIF3 is faster in the b″αβ/b'αβ quadruple mutant compared with that in the WT. Consistently, immunoprecipitated PP2A A and B subunits directly dephosphorylate PIF3-MYC in vitro. An RNA-sequencing analysis shows that B″α and B″β alter global gene expression in response to red light. PIFs (PIF1, PIF3, PIF4, and PIF5) are epistatic to these B subunits in regulating hypocotyl elongation under red light. Collectively, these data show an essential function of PP2A in dephosphorylating PIF3 to modulate photomorphogenesis in Arabidopsis.


Conflict of interest statement

Conflict of interest statement. None declared.

Figures

Figure 1.
Figure 1.
PIF3 interacts with PP2A B″α and B″β in vitro and in vivo. A) Y2H assays of the interaction between full-length PIF3 and PP2A B″α and B″β subunits. The B″α- and B″β-GAL4-DNA-binding domain (BD-B″α and BD-B″β) fusion was coexpressed with the GAL4-activation domain (AD) fused to full-length PIF3 or AD by itself as a negative control. Yeast cells were grown on selective media lacking histidine, supplemented with an increasing concentration of the histidine biosynthesis inhibitor 3-amino triazole (3-AT). B) A semi-in vivo pull-down assay shows the interaction between PIF3-MYC and MBP-B″α and MBP-B″β. MBP-B″α and MBP-B″β proteins were incubated with extracts from 4-d-old dark-grown seedlings of the PIF3-MYC transgenic line (dark- or red-light treated) and then were pulled down by MBP beads. Finally, PIF3-MYC signals were detected by a-Myc. MBP only as a negative control. Inputs from dark- and red-light-treated extracts as positive controls. C) An in vivo co-IP assay shows that PIF3-MYC interacts with B″α-GFP and B″β-GFP in response to red light or in dark conditions. Four-day-old dark-grown seedlings of 35s:B″α-GFP/PIF3-MYC, 35s:B″β-GFP/PIF3-MYC, PIF3-MYC, and Col-0 were used. PIF3-MYC and Col-0 were used as negative controls. All the seedlings were treated with 100 μm Bortezomib for 4 h in darkness. One batch was kept in the dark condition and the other batch was treated with red light. An a-GFP antibody was used to immunoprecipitate B″α-GFP and B″β-GFP and an a-MYC antibody was used to detect the PIF3-MYC protein. CBB, Coomassie brilliant blue stain; D, dark; R, red light.
Figure 2.
Figure 2.
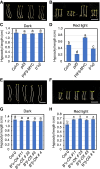
PP2A B″α and B″β promote hypocotyl elongation in red-light conditions. A and B) The photographs showing the seedling phenotypes of pp2abαβ grown in darkness (A) and red-light (8 μmol m−2 s−1) conditions (B), respectively, for 4 d. The seedling order in the image from left to right is: Col-0, pif3, PIF3-MYC, and pp2abαβ. Scale bar in A and B: 5 mm. C and D) The bar graphs show the hypocotyl lengths of seedlings shown in A and B (n ≥ 24). The error bars represent Se. A 1-way ANOVA was performed. Statistically significant differences are indicated by different lowercase letters (P < 0.05). E and F) Photographs showing the seedling phenotypes of B″α overexpression lines (Ba #11 and #23) and B″β overexpression lines (Bβ #3 and #4) grown in darkness (E) and red-light conditions (8 μmol m−2 s−1), respectively, for 4 d. The seedling order in the image from left to right is: Col-0, B″α overexpression Lines #11 and #23, and B″β overexpression Lines #3 and #4. Scale bar in E and F: 5 mm. G and H) The bar graphs show the hypocotyl lengths of seedlings shown in E and F (n ≥10). The error bars represent Se. A 1-way ANOVA was performed. Statistically significant differences are indicated by different lowercase letters (P < 0.05).
Figure 3.
Figure 3.
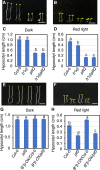
PP2A B″α and B″β and PIFs act in the same genetic pathway to regulate hypocotyl elongation in Arabidopsis. A and B) Photographs showing the seedling phenotypes grown in darkness (A) and red-light conditions (B, 8 μmol m−2 s−1), respectively, for 4 d. The seedling order in the image from left to right is: Col-0, pp2abαβ, pifQ, and bαβpifQ. Scale bar in A and B: 5 mm. C and D) The bar graphs exhibit the hypocotyl lengths of seedlings shown in A and B (n ≥ 30). The error bars represent Se. A 1-way ANOVA was performed. Statistically significant differences are indicated by different lowercase letters (P < 0.05). E and F) Photographs showing the seedling phenotypes grown in darkness (A) and red-light conditions (B, 8 μmol m−2 s−1), respectively, for 4 d. The seedling order in the image from left to right is: Col-0, pif3, Bβ-OX/Col-0, and Bβ-OX/pif3. Scale bar in A and B: 5 mm. G and H) The bar graphs display the hypocotyl lengths of seedlings shown in E and F (n ≥ 20). The error bars represent Se. A 1-way ANOVA was performed. Statistically significant differences are indicated by different lowercase letters (P < 0.05).
Figure 4.
Figure 4.
PP2A controls the PIF3 level under red light by dephosphorylation. A) Immunoblots showing the light-induced degradation of native PIF3 in the pp2abαβbαβ mutant compared with the WT. Four-day-old dark-grown seedlings were either kept in darkness or exposed to red light (20 μmol m−2 s−1) for the duration indicated before being sampled for protein extraction. RPN6 blot was used as the loading control. The numbers show the abundance of the native PIF3 protein after calibrating with RPN6 bands. The assay was repeated independently twice with similar results. B) The line graphs show the native PIF3 degradation rate after red-light exposure in the WT and pp2abαβbαβ mutant backgrounds based on 3 independent blots. **P < 0.01 and ***P < 0.001, based on Student's t-test. The error bars represent se (n = 3). C) The immunoblots show the light-induced phosphorylation of PIF3-MYC in the cr-bαβ #32 mutant and the WT. Four-day-old dark-grown seedlings were treated with 100 μm Bortezomib for 4 h and then either kept in darkness or exposed to red light (20 μmol m−2 s−1) for 20 min. Four-day-old dark-grown seedlings of WT (Col-0) samples were loaded at the first lane and last lane to keep the PIF3-MYC bands running properly. The Tubulin blot shows the loading control. The asterisks indicate the PIF3-MYC upper and lower bands in the WT and #32 mutant. The values show the ratio of the upper/lower band. D) A quantification of the relative PIF3-MYC upper/lower band ratio in the WT and #32 after red-light treatment in immunoblots shown in (C). The relative PIF3-MYC upper/lower band ratio in the WT was set as 1. **P < 0.01, based on Student's t-test. The error bars represent Se (n = 6). E) PP2A dephosphorylates PIF3 in vitro. A dephosphorylation assay was performed by using immunoprecipitated PIF3-MYC and PP2A proteins from PIF3-MYC plants and RCN1-GFP, YFP-B′α, and YFP-B′β transgenic plants, respectively. PIF3-MYC proteins from 4 dark-grown seedlings of PIF3-MYC, treated with 100 μm Bortezomib for 4 h in darkness and exposed to red light before the IP process. RCN1-G, YFP-B′α, and YFP-B′β IP products as PP2A phosphatase incubate with immunoprecipitated PIF3-MYC for 1 h at 30 ℃. CIP as a positive control. Boiled CIP and IP products from Col-0 as negative controls. CIP and boiled CIP treatments were performed at 37 ℃ for 1 h. A Western blot analysis was performed with anti-Myc on SDS–PAGE. CIP, calf intestine phosphatase; D, dark; R, red light.
Figure 5.
Figure 5.
RNA-seq revealing unique roles of PP2A B″α and B″β in gene expression after red-light exposure. A) A Venn diagram shows differentially expressed genes (DEGs) in the WT vs. the pp2abαβ mutant after red-light exposure. Four-day-old dark-grown seedlings were exposed to continuous red light (20 μmol m−2 s−1) for 1 h or kept in darkness and total RNA was extracted from 3 biological replicates for RNA-seq analyses. B) A hierarchical clustering from 1,359 DEGs from the WT shows a distinct pattern in the pp2abαβ mutant after red-light exposure. C) A GO analysis of PP2A B″α and B″β-dependent 512 genes. D) A RT-qPCR analysis using MYB61, AT5G40500, and CBF1. RT-qPCR samples were extracted from 4-d-old dark-grown seedlings of Col-0, pp2abαβ, and pif3 and then were either kept in the dark or exposed to continuous red light (20 μmol m−2 s−1) for 1 h. Three biological repeats were performed. The error bars represent Se (n = 3). Relative gene expression levels were normalized using the expression level of ACT2 and the values of those genes in dark conditions. Student’s t-test was performed. *P < 0.05, **P < 0.01. D, dark; FC, fold change; R, red light.
Figure 6.
Figure 6.
The B subunits are located in both the nucleus and the cytoplasm. Confocal images showing the subcellular localization of YFP-B′α, YFP-B′β, YFP-B″α, and YFP-B″β, in the primary root of 4-d-old seedlings grown on an MS medium in white light conditions. DAPI was used to show the nucleus. The white arrows show the nucleus. Scale bar is 5 μm.
Figure 7.
Figure 7.
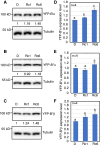
PP2AB′α and B″β protein levels were induced by red light. Immunoblots showing the expression of YFP-B′α (A), YFP-B″α (B), and YFP-B″β (C) after red-light treatment. Four-day-old dark-grown seedlings were either kept in darkness or exposed to red light (20 μmol m−2 s−1) for 1 h (Rc1) or 6 h (Rc6) before being sampled for protein extraction. A tubulin blot was used as the loading control. The numbers show the abundance of the YFP-B′α, YFP-B″α, and YFP-B″β proteins after calibrating with Tubulin bands, respectively. The bar graphs show the expression levels of PP2AYFP-B′α (D), YFP-B″α (E), and YFP-B″β (F) after red-light exposure based on 4 independent blots. The error bars represent Se (n = 4). A one-way ANOVA analysis was performed. Statistically significant differences are indicated by different lowercase letters (P < 0.05). D, dark; R, red light.
Figure 8.
Figure 8.
A model of the phy signaling pathway. (Left) In the dark, phys are in an inactive Pr form and stay in the cytosol. The nuclear-localized PIFs can form homodimers, heterodimers, or tetramers to bind to the promoter region of their target genes to repress their expression and prevent photomorphogenesis. In addition, 2 kinases (CK2 and BIN2) can phosphorylate PIFs to promote their degradation in the dark, while PP6 dephosphorylates PIFs to stabilize them, thereby inhibiting photomorphogenesis. (Right) Upon light exposure, phys convert from a Pr form to an active Pfr form and translocate into the nucleus. In the nucleus, the interaction between phys and PIFs triggers the rapid phosphorylation of PIFs by several kinases (SPA1, CK2, and PPKs). The phosphorylated PIFs will be degraded by the 26S proteasome pathway. The degradation of the PIFs promotes a light-regulated gene expression and photomorphogenesis. Conversely, PP2A with other phosphatases (TOPP4 and PP6) can dephosphorylate PIFs to inhibit their degradation to fine-tune photomorphogenesis.

References

    1. Al-Sady B, Ni W, Kircher S, Schäfer E, Quail PH. Photoactivated phytochrome induces rapid PIF3 phosphorylation prior to proteasome-mediated degradation. Mol Cell. 2006:23(3):439–446. 10.1016/j.molcel.2006.06.011 - DOI - PubMed
    1. Anders S, Pyl PT, Huber W. HTSeq—a Python framework to work with high-throughput sequencing data. Bioinformatics. 2015:31(2):166–169. 10.1093/bioinformatics/btu638 - DOI - PMC - PubMed
    1. Bae G, Choi G. Decoding of light signals by plant phytochromes and their interacting proteins. Annu Rev Plant Biol. 2008:59(1):281–311. 10.1146/annurev.arplant.59.032607.092859 - DOI - PubMed
    1. Bernardo-García S, de Lucas M, Martínez C, Espinosa-Ruiz A, Daviere J-M, Prat S. BR-dependent phosphorylation modulates PIF4 transcriptional activity and shapes diurnal hypocotyl growth. Genes Dev. 2014:28(15):1681–1694. 10.1101/gad.243675.114 - DOI - PMC - PubMed
    1. Bheri M, Mahiwal S, Sanyal SK, Pandey GK. Plant protein phosphatases: what do we know about their mechanism of action? FEBS J. 2021:288(3):756–785. 10.1111/febs.15454 - DOI - PubMed

MeSH terms

Substances