. 2024 Jul 11;187(14):3541-3562.e51.
doi: 10.1016/j.cell.2024.06.002.

Three-dimensional genome architecture persists in a 52,000-year-old woolly mammoth skin sample

Affiliations

Three-dimensional genome architecture persists in a 52,000-year-old woolly mammoth skin sample

Marcela Sandoval-Velasco et al. Cell. .

Abstract

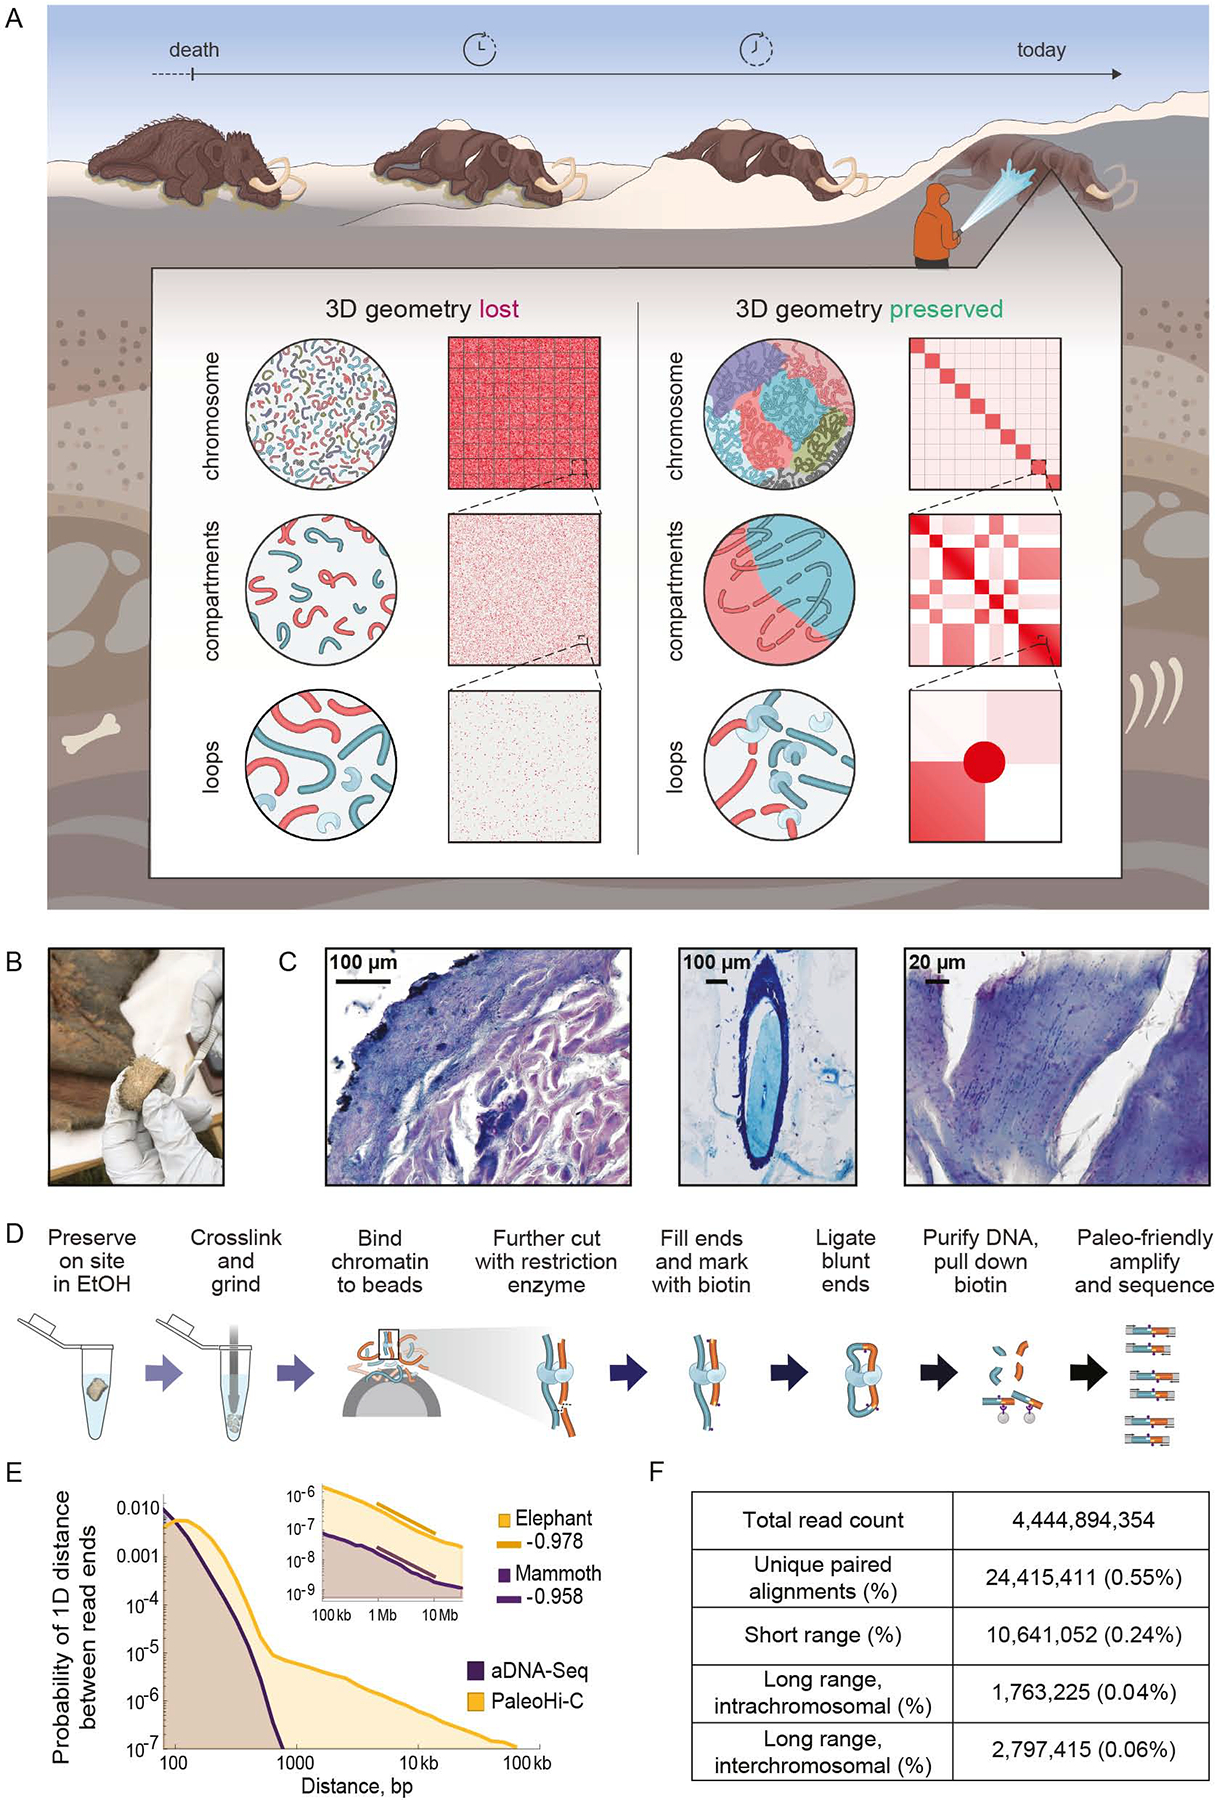
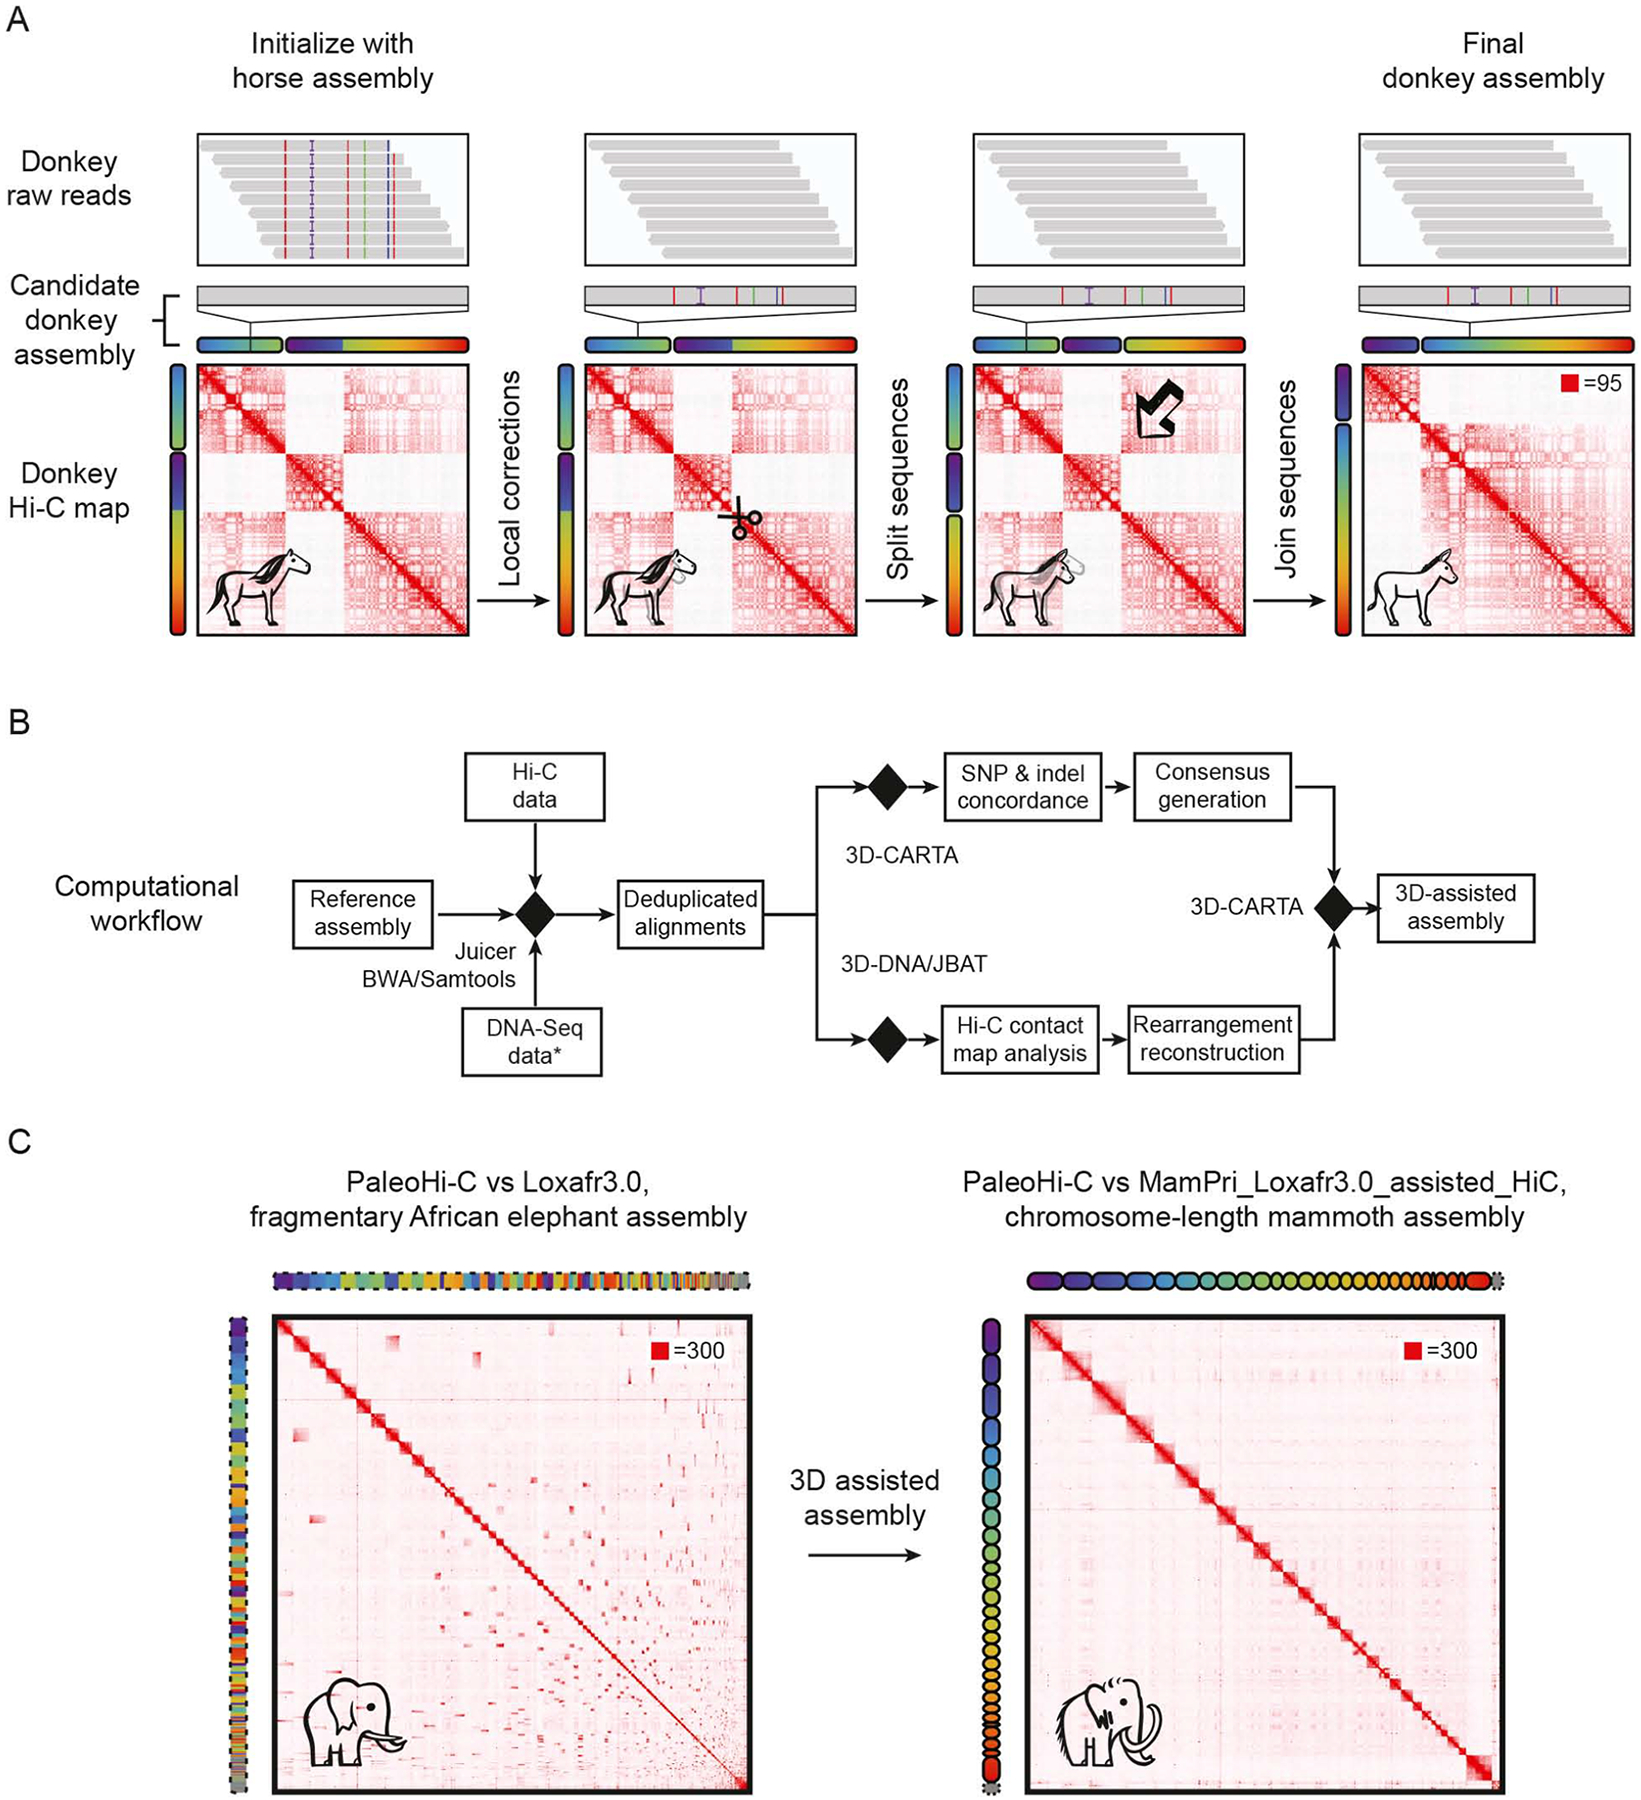
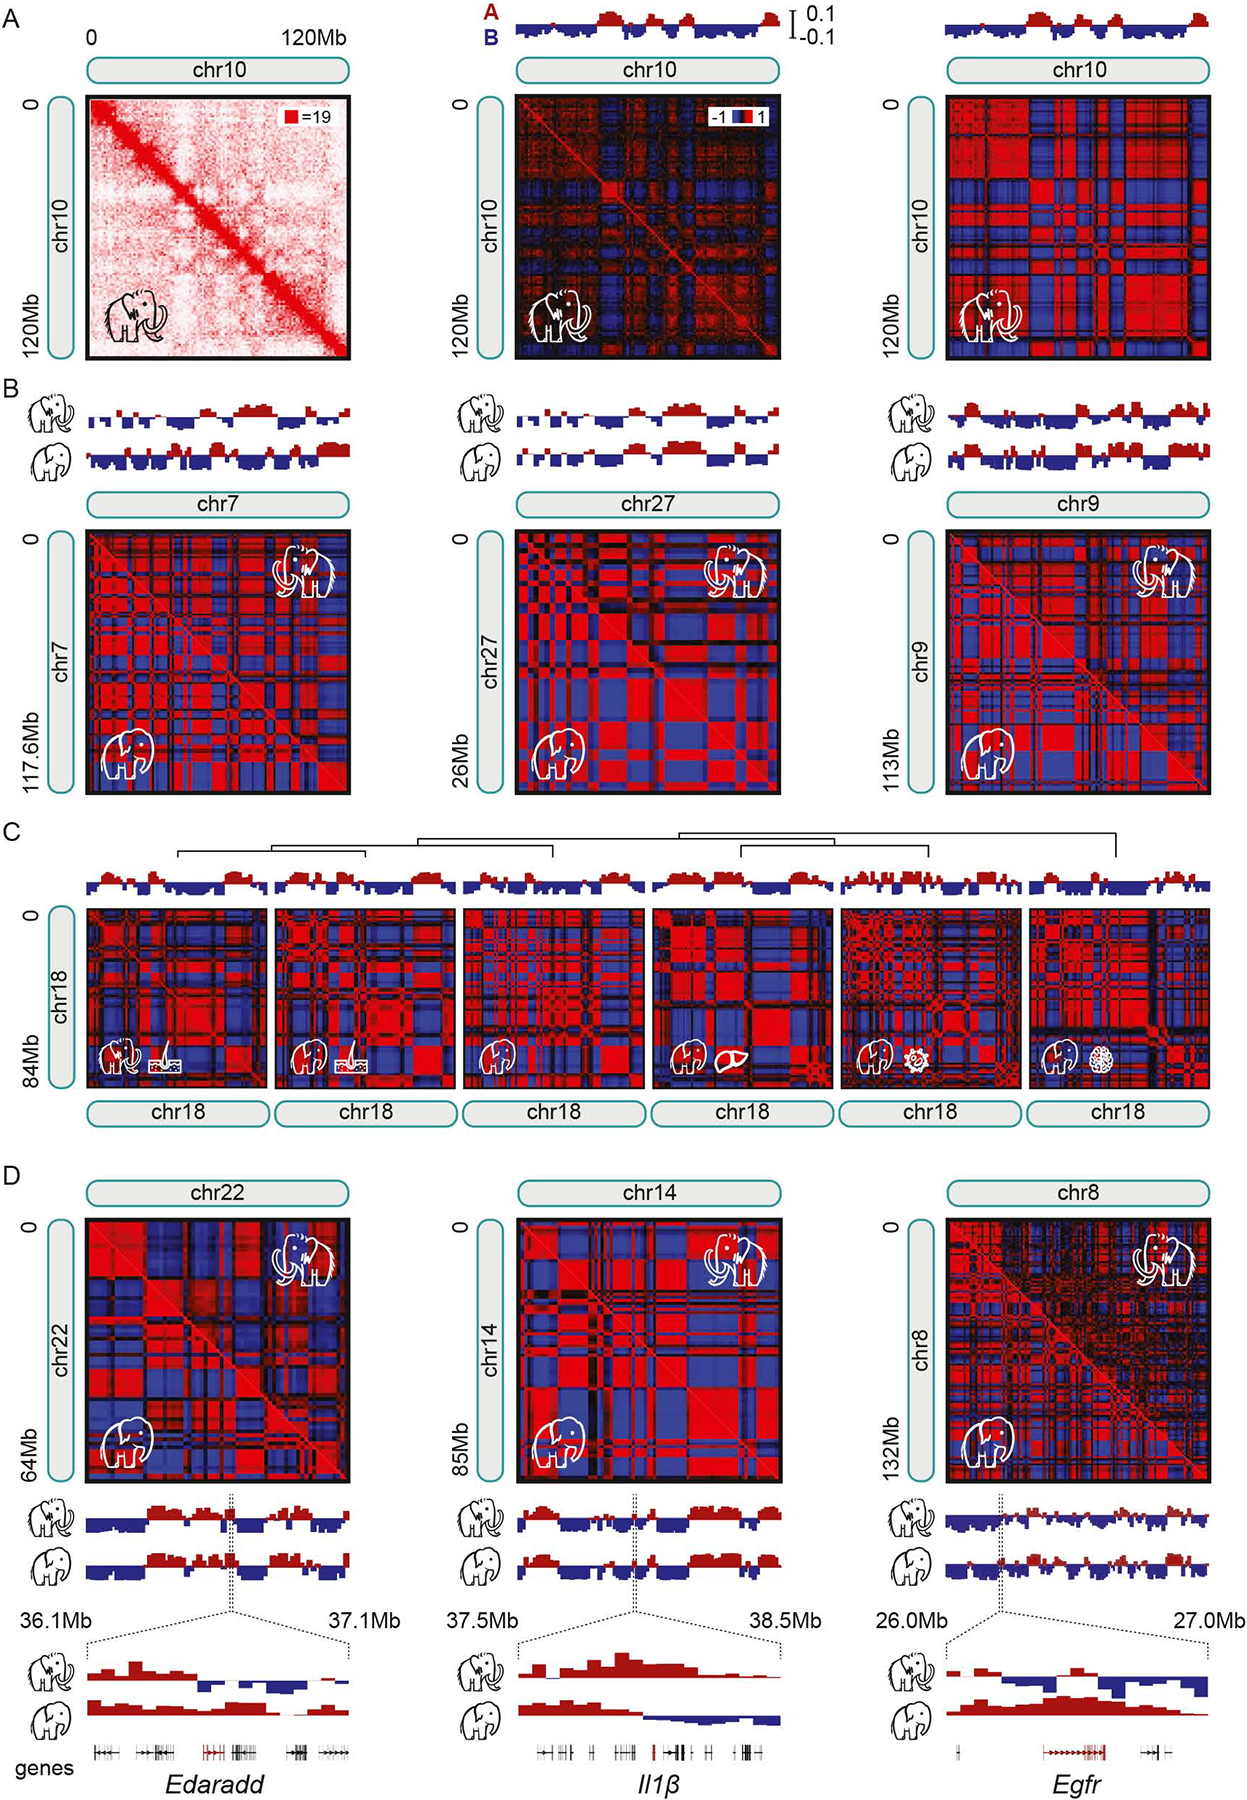
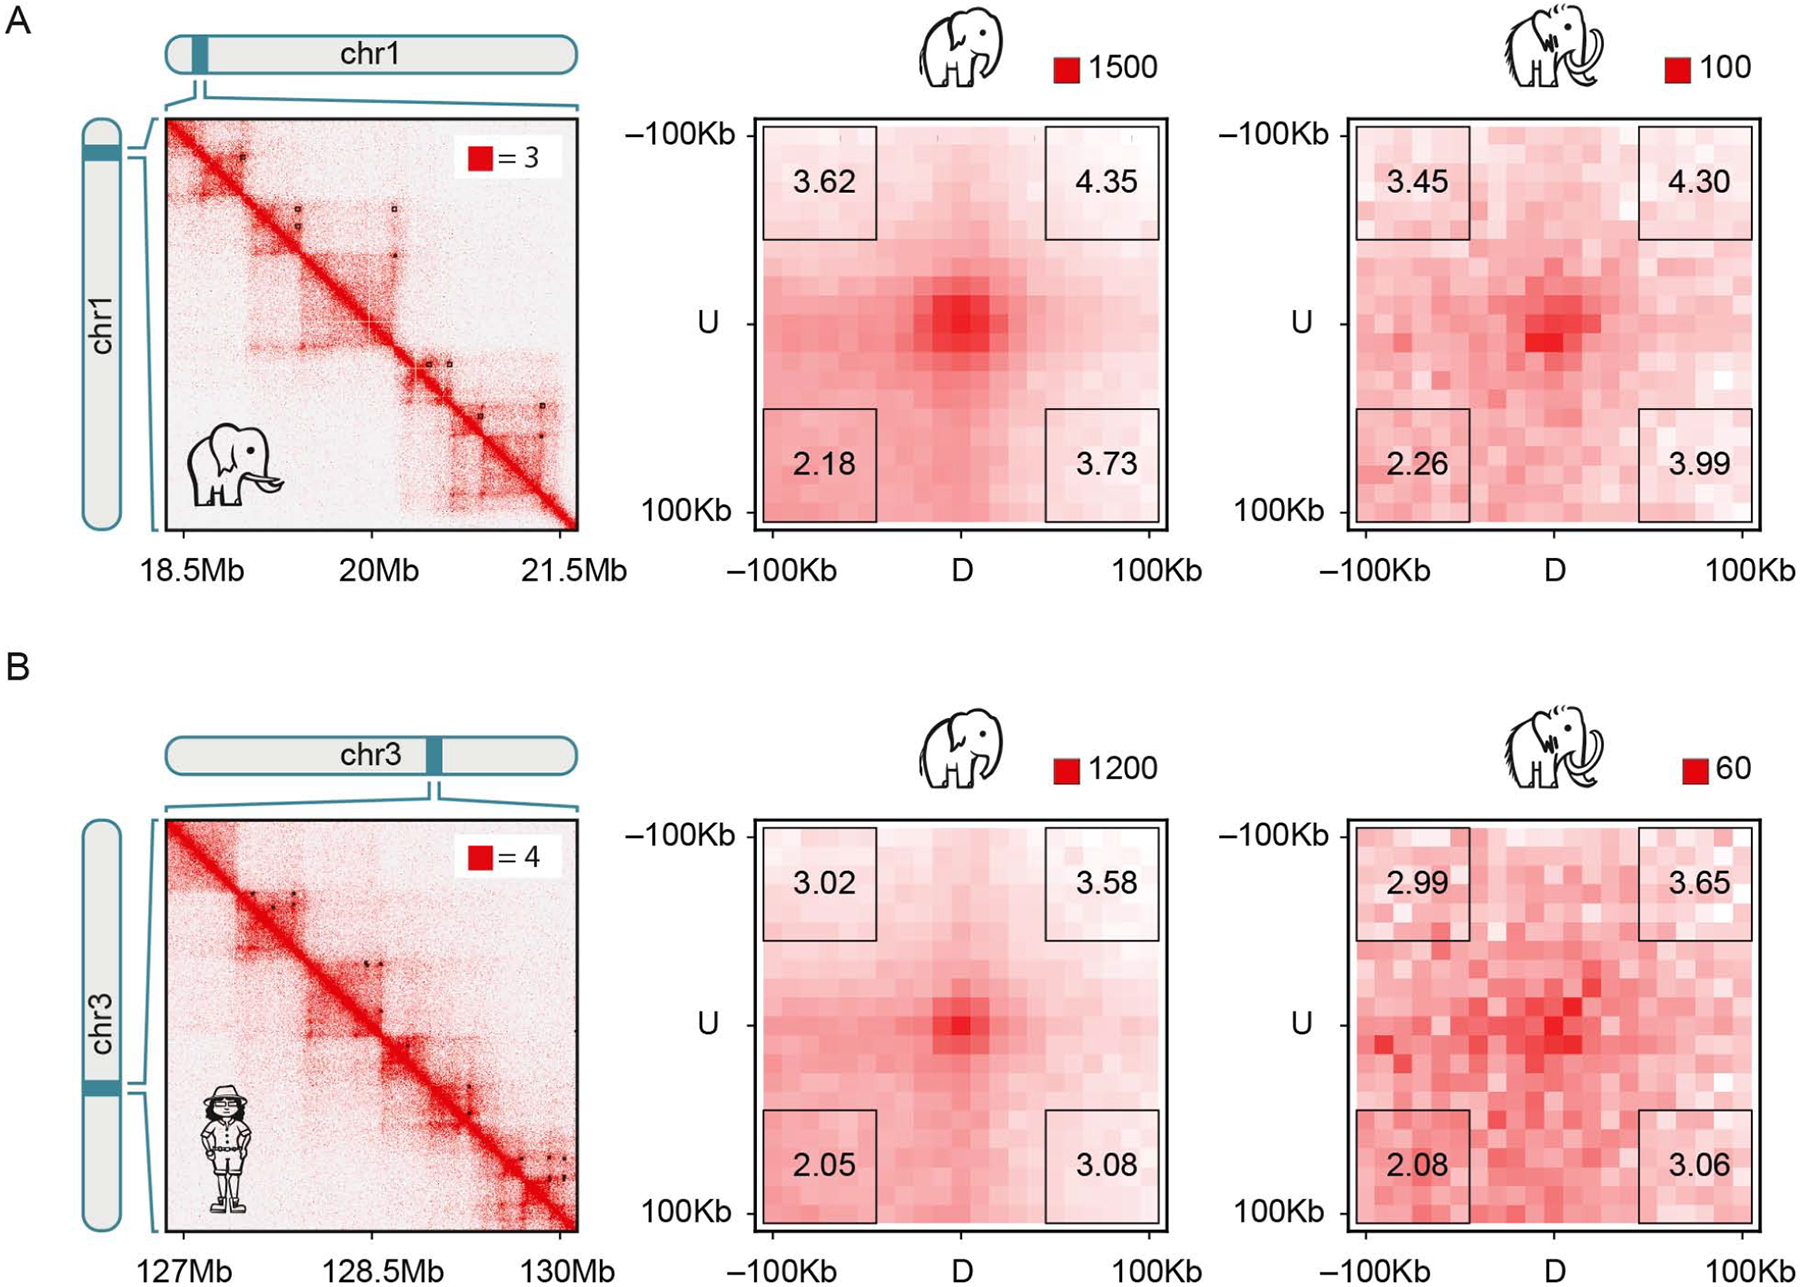
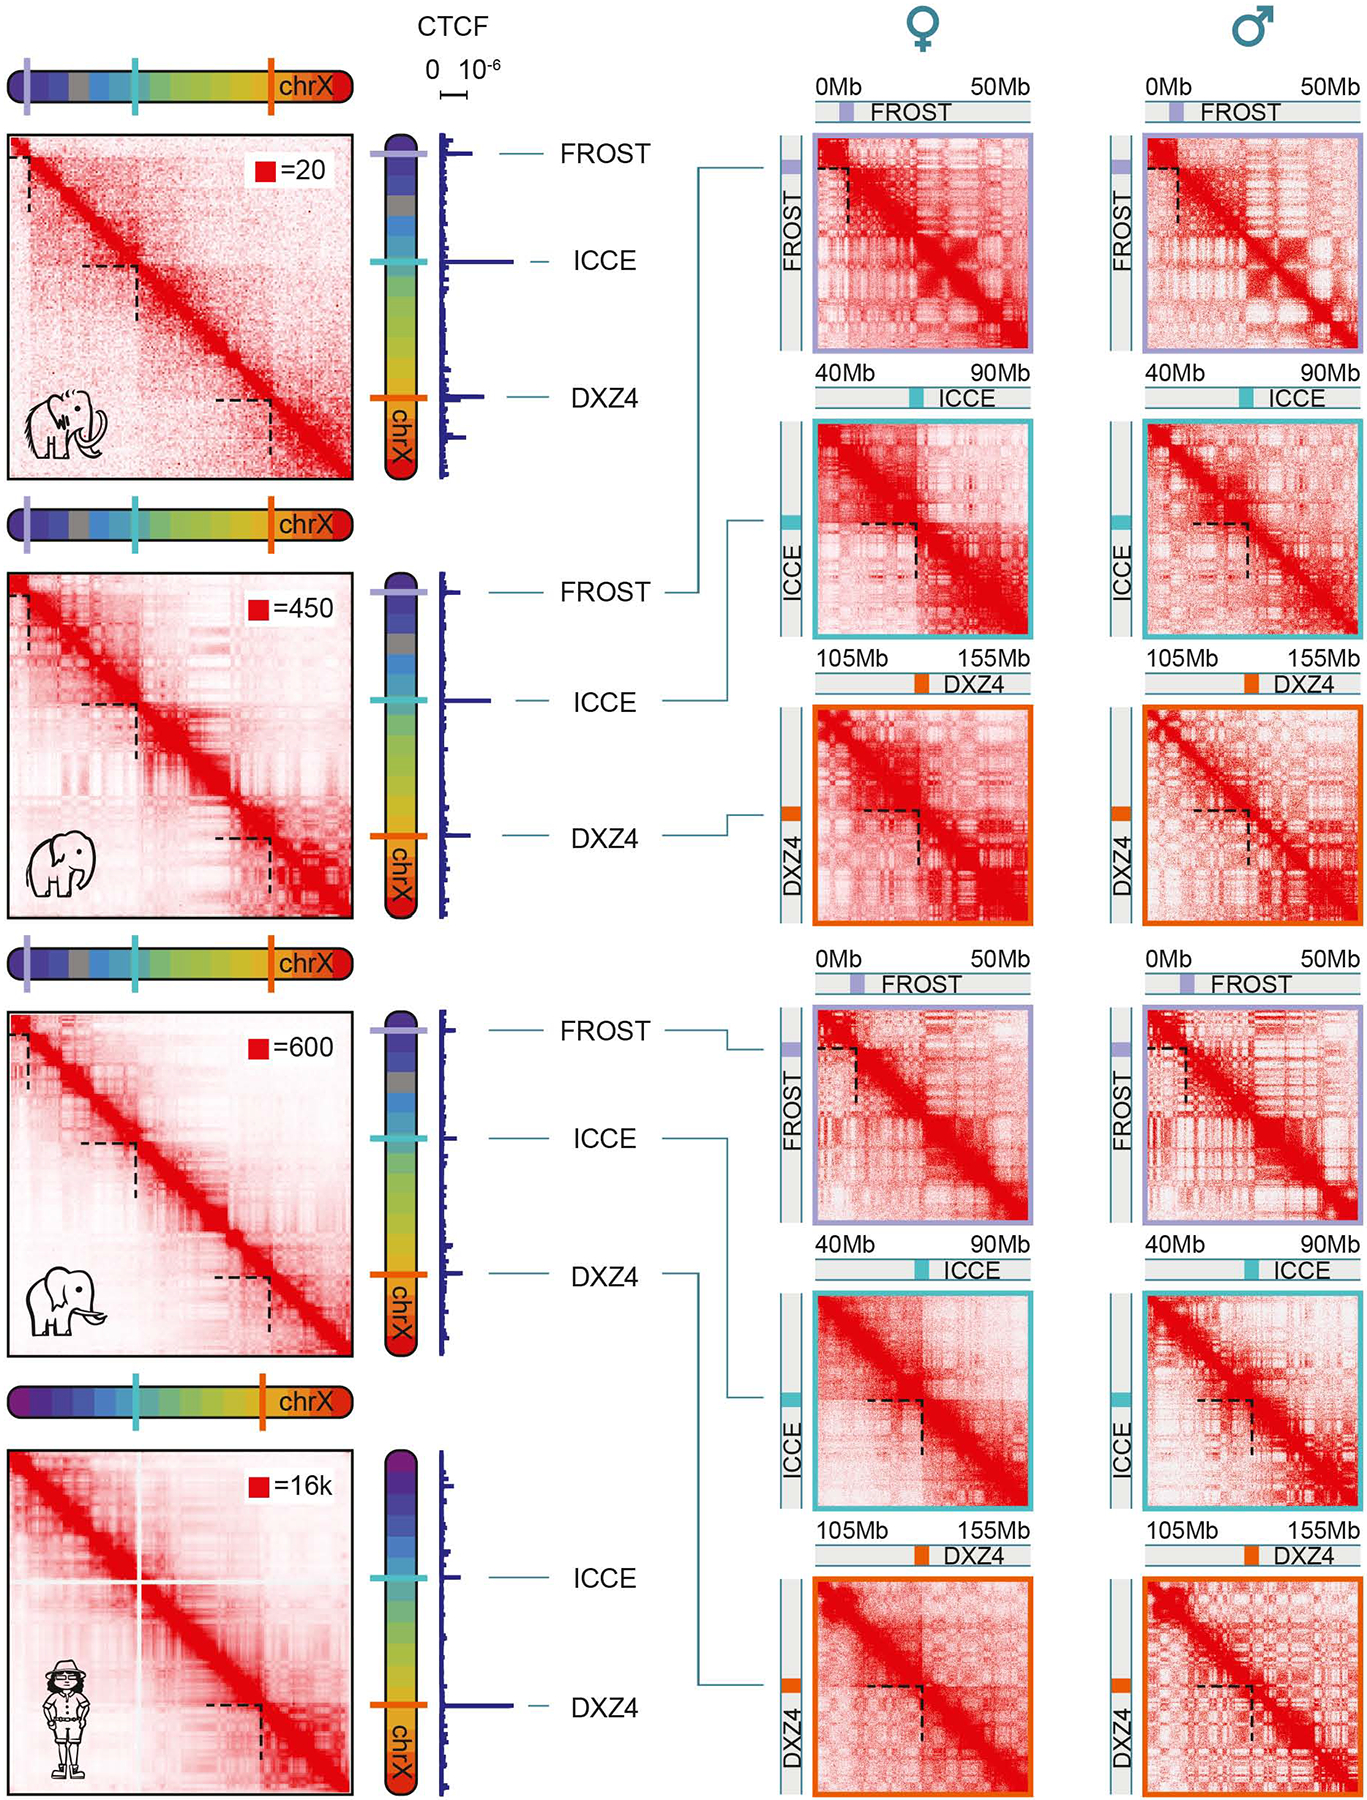
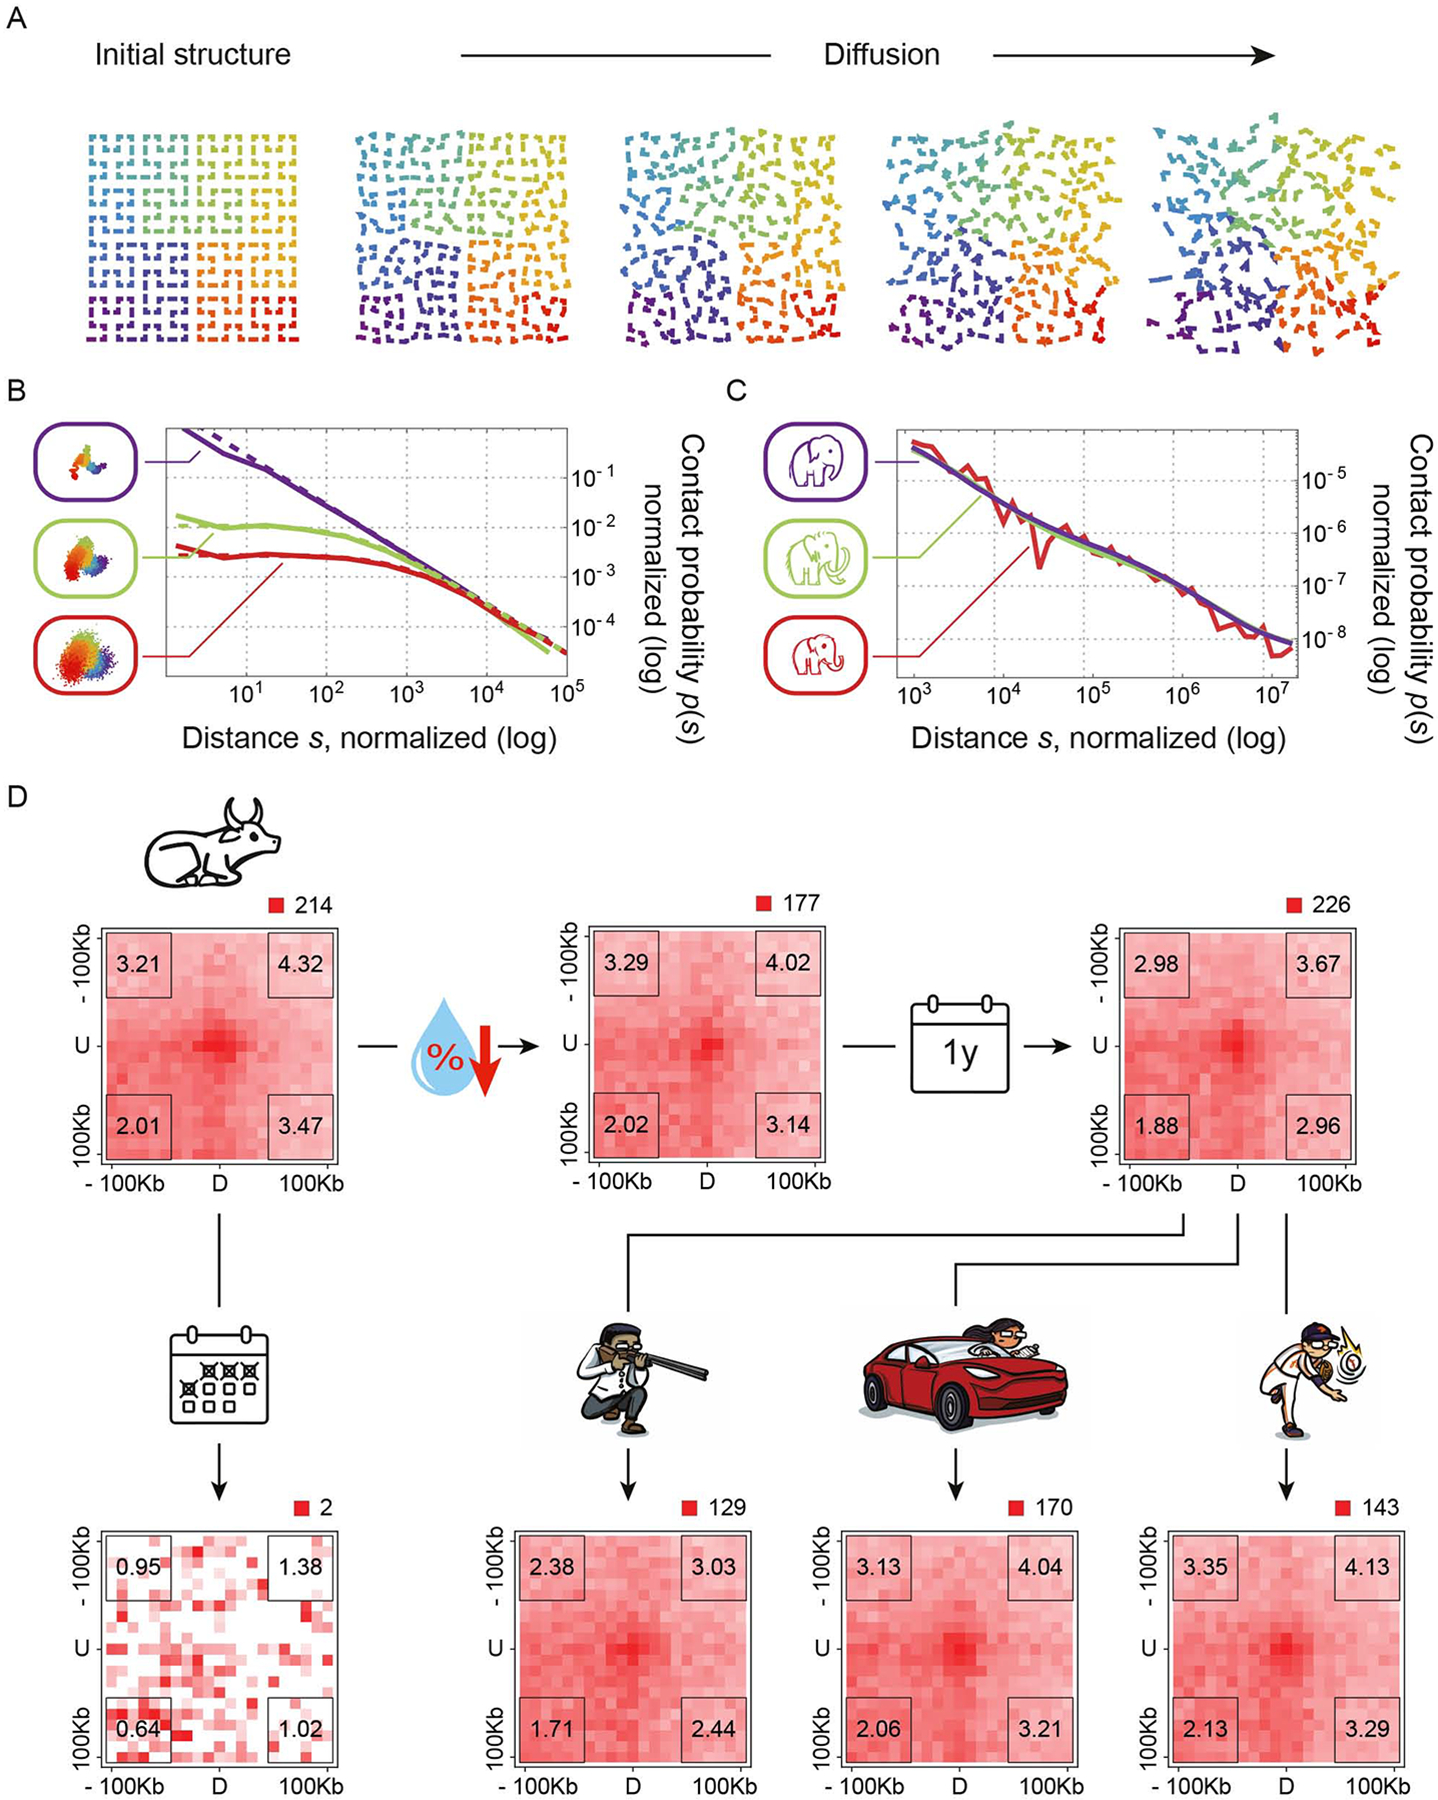
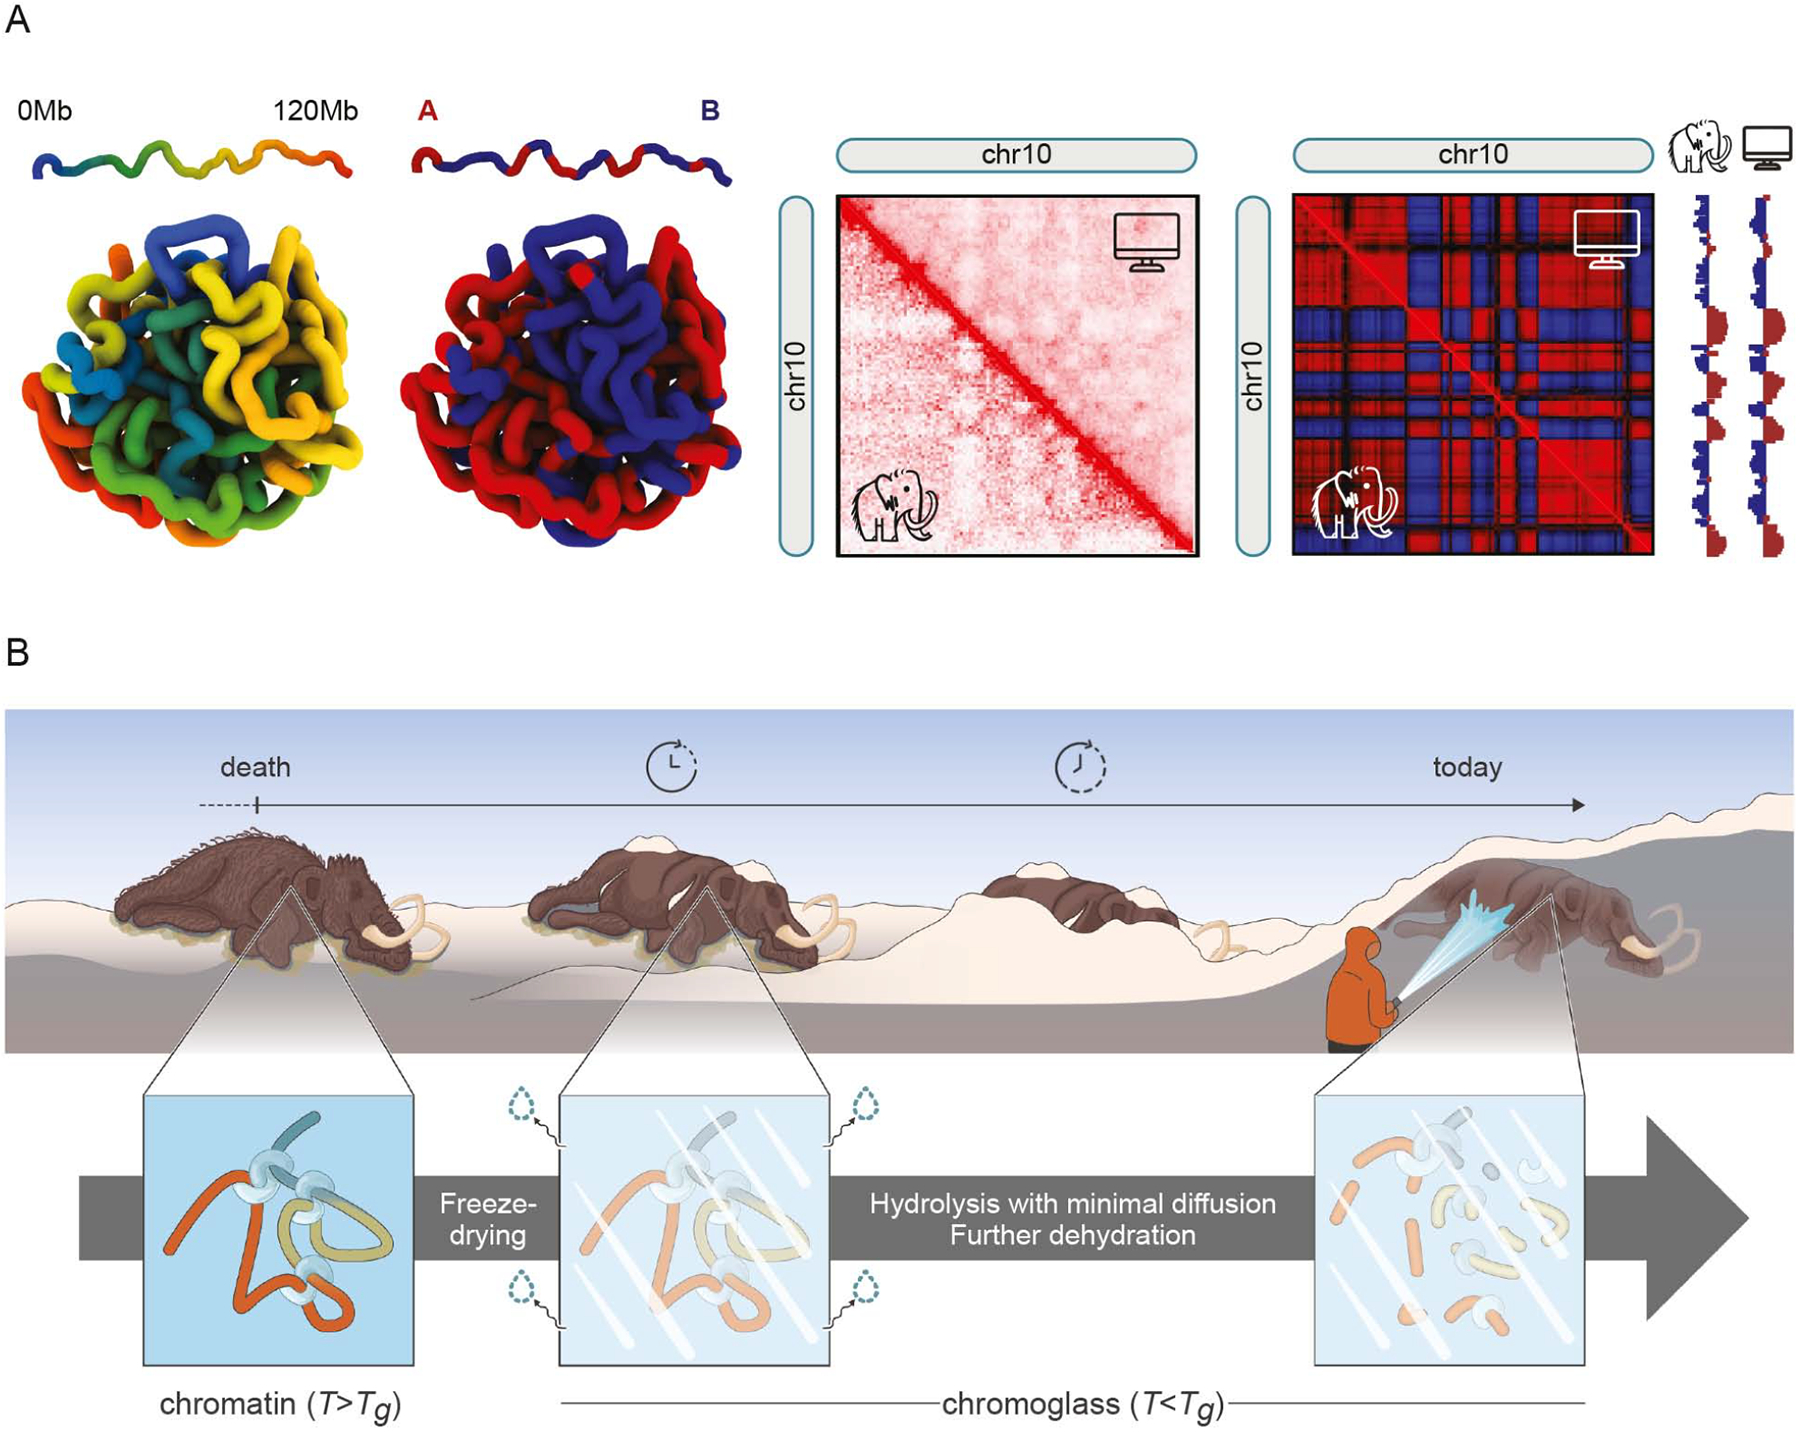
Analyses of ancient DNA typically involve sequencing the surviving short oligonucleotides and aligning to genome assemblies from related, modern species. Here, we report that skin from a female woolly mammoth (†Mammuthus primigenius) that died 52,000 years ago retained its ancient genome architecture. We use PaleoHi-C to map chromatin contacts and assemble its genome, yielding 28 chromosome-length scaffolds. Chromosome territories, compartments, loops, Barr bodies, and inactive X chromosome (Xi) superdomains persist. The active and inactive genome compartments in mammoth skin more closely resemble Asian elephant skin than other elephant tissues. Our analyses uncover new biology. Differences in compartmentalization reveal genes whose transcription was potentially altered in mammoths vs. elephants. Mammoth Xi has a tetradic architecture, not bipartite like human and mouse. We hypothesize that, shortly after this mammoth's death, the sample spontaneously freeze-dried in the Siberian cold, leading to a glass transition that preserved subfossils of ancient chromosomes at nanometer scale.

Keywords: Hi-C; X inactivation; ancient DNA; chromatin loops; fossil; genome architecture; genome assembly; glass transition; vitrification; woolly mammoth.


Conflict of interest statement

Declaration of interests E.L.A., M.T.P.G., and L.D. are on the scientific advisory board of Colossal Biosciences and hold stock options. From 2021 to 2023, M.A.M.-R. received consulting honoraria from Acuity Spatial Genomics. E.L.A. and O.D. are inventors on US provisional patent applications 16/308,386 (E.L.A. and O.D., filed 12/7/2018), 16/247,502 (E.L.A. and O.D., 1/14/2019), and PCT/US2020/064704 (E.L.A., 12/11/2020) by the Baylor College of Medicine and the Broad Institute, relating to the assembly methods in this manuscript.

Figures

Figure 1.
Figure 1.. PaleoHi-C reveals that the morphology of chromosomes is preserved in a 52,000-year-old sample of woolly mammoth skin.
A. Ancient DNA is fragmented. The fragments may be free to diffuse through space, erasing the 3D morphology of ancient chromosomes (left), including chromosome territories (top), chromatin compartments (middle), and point-to-point loops (bottom). If so, assays like Hi-C will fail. If diffusion is limited, these features may survive (right) and potentially be examined using Hi-C. B. Primary mammoth sample used in this study. C. Histology of skin (left), hair follicles (center) and subdermal muscle (right). D. PaleoHi-C overview. Samples are collected into ethanol in the field. In the laboratory, samples are crosslinked with formaldehyde. Tissue is disrupted and ground. Instead of isolating nuclei, as in in situ Hi-C, chromatin bodies are bound to beads and cut with a restriction enzyme. Ends are repaired and blunted, introducing biotin. After DNA-DNA proximity ligation, junctions are captured onto streptavidin beads, built into libraries using a paleo-compatible workflow, and sequenced. E. PaleoHi-C data (yellow) and aDNA-seq data (purple) for the same sample were aligned to African elephant. The log-log histogram shows relative contact probability vs. 1D genomic distance between read ends. A fraction of PaleoHi-C reads reflect contacts between loci that lie far away in 1D. Not so for aDNA-Seq. E, inset. Similar plot comparing PaleoHi-C on woolly mammoth skin vs. in situ Hi-C on Asian elephant skin. Power laws are seen in the 1Mb to 10Mb distance range (solid lines), with nearly identical scalings (Mammoth: −0.96; Elephant: −0.98). F. PaleoHi-C summary statistics.
Figure 2.
Figure 2.. We developed reference-assisted 3D genome assembly and used it to assemble a woolly mammoth genome with chromosome-length scaffolds.
A. Schematic showing 3D genome assembly of donkey using horse (EquCab2.0) to assist. We initially assume that the donkey genome is identical to EquCab2.0 (leftmost column), and correct this assumption step-by-step, generating intermediate assemblies (columns 2 and 3), and finally a donkey genome assembly with accurate local sequence and chromosome-length scaffolds (column 4). We illustrate using two representative horse sequences, chr8 and chr24. Bottom row: Contact maps showing reads from donkey aligned to genome assemblies from each step. 2nd-to-last row: Chromograms illustrating locus order, with respect to the final (correct) order, which begins with blue and ends with red. 2nd row: Zooming in on DNA sequence for each step. Gray indicates that the current assembly sequence matches the initial, horse, sequence. Mismatches are shown in color: A (green), C (blue), G (yellow) and T (red). The ‘I’ icon indicates insertions. Top row: Donkey sequence reads aligned to the current draft. Differences shown as in the 3rd row. The procedure for 3D assisted assembly is as follows. (1st column). DNA-Seq and Hi-C reads from the donkey are aligned to the assisting horse genome assembly, EquCab2.0 (top two rows), making a contact map for the donkey with respect to EquCab2.0 (bottom row). Small-scale differences between aligned reads and EquCab2.0 are apparent (top two rows). (2nd column) Individual read alignments are examined and corresponding changes are introduced, as in traditional DNA resequencing. The result is a locally-corrected genome assembly. Subsequent steps focus on constructing accurate chromosome-length scaffolds for donkey by looking for inconsistencies between donkey Hi-C and the candidate donkey genome assembly. In the bottom row, an inconsistency is highlighted with a pair of scissors: contacts are rare between two long sequences which are adjacent to each other on a single chromosome in EquCab2.0 (see chromogram), indicating positions on different chromosomes in donkey. As such, they should be placed on separate scaffolds, and this is done in the next step. The resulting assembly (3rd column) contains three long scaffolds. The Hi-C map indicates that the first and last of these scaffolds are in frequent 3D contact, indicating that they are adjacent in the donkey genome. This change is made in the final donkey genome assembly (4th column). This strategy requires very little Hi-C data, compatible with PaleoHi-C, and yields a genome assembly that matches the true donkey genome both at single-base and chromosome scales. B. Workflow for reference-assisted 3D assembly. Hi-C data (and, optionally, DNA-Seq) aligned to assisting assembly and deduplicated. Alignments analyzed with 3D-DNA and Juicebox Assembly Tools to correct scaffolds, and with 3D-CARTA (see STAR Methods) to correct local sequences. C. Combining PaleoHi-C data and African elephant draft genome assembly Loxafr3.0 (left) enables assembly of woolly mammoth genome with 28 chromosome-length scaffolds (right). Interactive map at https://t.3dg.io/3d-mammoth-Fig-2C.
Figure 3.
Figure 3.. Segregation between active (A) and inactive (B) genome compartments can survive in ancient samples, enabling comparison of gene activity in woolly mammoth and Asian elephant skin.
To facilitate comparisons, panels are with respect to the African elephant genome assembly Loxafr3.0_HiC. A. Raw contact data corresponding to chr10 (left) as well as 1st- (center) and 2nd-order (right) autocorrelation matrices, which can help enhance signal. The principal eigenvector of the autocorrelation matrix (above) can distinguish between A (active) and B (inactive) chromatin compartments. We adopt the sign convention where positive values (red) correspond to A, and negative (blue) to B. B. 2nd-order autocorrelation matrices and A/B eigenvectors for chr7, chr27 & chr9 in skin from mammoth (above diagonal) and modern Asian elephant (below diagonal) are highly similar. C. 2nd-order autocorrelation matrices and A/B eigenvectors for chr18. From left-to-right: woolly mammoth skin PaleoHi-C; and Asian elephant in situ Hi-C for skin, ovary, liver, blood, and brain. Above, dendrogram reflecting Euclidean distances between eigenvectors. D. Comparison of skin from mammoth (above diagonal) and Asian elephant (below diagonal) for chr22, chr14 and chr8. Zoom-in: CRUSH annotations of A/B compartments at 50Kb resolution using PaleoHi-C reflect differences at genes Edaradd (on chr22, left), Il1β (chr14, center), and Egfr (chr8, right). Other matrices and eigenvectors are 1Mb resolution.
Figure 4.
Figure 4.. Chromatin loops can survive after 52,000 years in permafrost.
A. Left: Representative loop calls (black boxes) in Hi-C map from African elephant primary fibroblasts, chr1:18.5–21.5Mb, available interactively at https://t.3dg.io/3d-mammoth-Fig-4A. Center: Aggregate Peak Analysis (APA) of in situ Hi-C data from Asian elephant skin using African elephant loop list at 10Kb resolution. The central bin sums contacts from 10Kb-by-10Kb pixels surrounding each loop; other bins correspond to translations of the loop pixel set. Enrichments of the central bin vs. the average for each corner (black box) are shown, indicating presence of loops in aggregate. Right: APA using the same loop list repeated on mammoth PaleoHi-C data. B. Left: Representative loop calls (black boxes) from chr3:127–130Mb in Hi-C maps from human skin, downloaded from ENCODE (https://www.encodeproject.org), available interactively at https://t.3dg.io/3d-mammoth-Fig-4B. Center: APA for Asian elephant skin Hi-C using loops from human skin. Right: APA for mammoth skin PaleoHi-C using the same loop set.
Figure 5.
Figure 5.. The inactive X chromosome in woolly mammoths exhibits a tetradic structure, with 4 superdomains, distinct from the bipartite structure in humans.
1st column, top to bottom: Contact maps for female mammoth, Asian elephant blood, African elephant fibroblasts and human GM12878 B-lymphoblastoid cells. Chromosome orientation and chromogram color scheme (indicating locus order) are based on human chrX, purple (p-terminus) to red (q-terminus). (X-chromosome locus order is highly conserved from human to elephantids.) Purple, cyan, and orange ticks indicate FROST, ICCE, and DXZ4 repeats (respectively). Tracks show how many reads align to the DXZ4/ICCE-associated CTCF binding motif. Peaks correspond to CTCF-binding tandem repeats. Dashed lines indicate superdomain boundaries. Resolution: 1Mb. 2nd & 3rd columns: Zoom-in on FROST, ICCE, and DXZ4 in Asian and African Elephant females (2nd column) and males (3rd). The superdomain boundaries are female-specific. Interactive maps: https://t.3dg.io/3d-mammoth-Fig-5.
Figure 6.
Figure 6.. The mammoth DNA in our sample has diffused minimally, in line with the resilience of chromatin architecture in modern dehydrated samples.
A. To theoretically model how chromosome architecture in ancient remains is affected by the passage of millennia, we begin with an initial, large chromatin chain; degradation is modeled as dissection of this chain into many short chains, whose subsequent diffusion is modeled as simple diffusion of phantom chains. This schematic illustrates the diffusion process. Here we use a space-filling Hilbert curve as the initial chromatin conformation. 1D position along the trajectory is indicated using the color, from purple to red. As particles diffuse, fine structure is disturbed, but coarse-scale co-localization persists, visible as monochromatic clusters. Eventually, the initial conformation is erased at all scales. B. The effects of diffusion are visible using contact data. Here, the initial chromatin conformation is modeled as a 3D random walk. Without diffusion (purple), random walks yield a power law relating distance along the polymer chain, measured in monomers, s, to the probability that two monomers are in contact, p(s). Diffusion erases the power law up to the scale of the RMSD (lower: green; higher: red). Theoretical calculations (solid) match simulations (dashed). As particles diffuse, they again erase the initial conformation at increasingly large scales. C. Scalings for Asian elephant in situ Hi-C (purple), IN18–032 PaleoHi-C (green), and Yuka PaleoHi-C (red) are well-preserved down to 500bp, the smallest distance assayable using our current method. D. Genome architecture in modern dehydrated samples is extremely resilient. For example, APA shows that chromatin loops present in fresh cow liver (top-left), are gone after 96 hours at room temperature (bottom-left). But after dehydration, loops remain (top-middle), even after a year at room temperature (top-right), and even if (bottom-right) the sample is subsequently blasted with a shotgun, run over by a car, or hit with a fastball.
Figure 7.
Figure 7.. We hypothesize that the woolly mammoth samples studied here contain chromoglass - chromatin trapped in a glassy state, where molecular diffusion is minimal.
A. We combined polymer physics and PaleoHi-C data to infer 3D structures of woolly mammoth chromosomes. Shown is a representative structure from the simulated ensemble generated for mammoth chr10, colored by genomic position (1st panel) and A/B type (2nd). A contact map (3rd) and Pearson’s autocorrelation matrix (4th) from the simulated structures (above diagonal) is compared to mammoth PaleoHi-C (below diagonal). Resolution: 1Mb. The structures can be explored using Spacewalk at https://t.3dg.io/3d-mammoth-Fig-7A. B. We also propose a physical model for how the morphology of chromosomes can persist in ancient samples: the chromatin is contained in a glassy, non-crystalline, solid state. In this state, molecular diffusion, such as the diffusion of short aDNA fragments, is minimal. The glass transition might have been brought about by spontaneous freeze-drying: the gradual sublimation of the sample’s water into the cold Siberian atmosphere. This could explain the preservation of morphological features across at least eight orders-of-magnitude in size: from the mammoth carcass (meters in length), to histological features (10s of microns), to loops (50nm).

Similar articles

Cited by

References

    1. Higuchi R, Bowman B, Freiberger M, Ryder OA, and Wilson AC (1984). Dna-Sequences From the Quagga, an Extinct Member of the Horse Family. Nature 312, 282–284. - PubMed
    1. Pääbo S. (1985). Molecular cloning of Ancient Egyptian mummy DNA. Nature 314, 644–645. - PubMed
    1. Green RE, Krause J, Briggs AW, Maricic T, Stenzel U, Kircher M, Patterson N, Li H, Zhai W, Fritz MH-Y, et al. (2010). A draft sequence of the Neandertal genome. Science 328, 710–722. - PMC - PubMed
    1. Rasmussen M, Li Y, Lindgreen S, Pedersen JS, Albrechtsen A, Moltke I, Metspalu M, Metspalu E, Kivisild T, Gupta R, et al. (2010). Ancient human genome sequence of an extinct Palaeo-Eskimo. Nature 463, 757–762. - PMC - PubMed
    1. Miller W, Drautz DI, Ratan A, Pusey B, Qi J, Lesk AM, Tomsho LP, Packard MD, Zhao F, Sher A, et al. (2008). Sequencing the nuclear genome of the extinct woolly mammoth. Nature 456, 387–390. - PubMed

LinkOut - more resources