. 2024 Sep 5;187(18):5081-5101.e19.
doi: 10.1016/j.cell.2024.06.022. Epub 2024 Jul 11.

Molecular and cellular mechanisms of teneurin signaling in synaptic partner matching

Affiliations

Molecular and cellular mechanisms of teneurin signaling in synaptic partner matching

Chuanyun Xu et al. Cell. .

Abstract

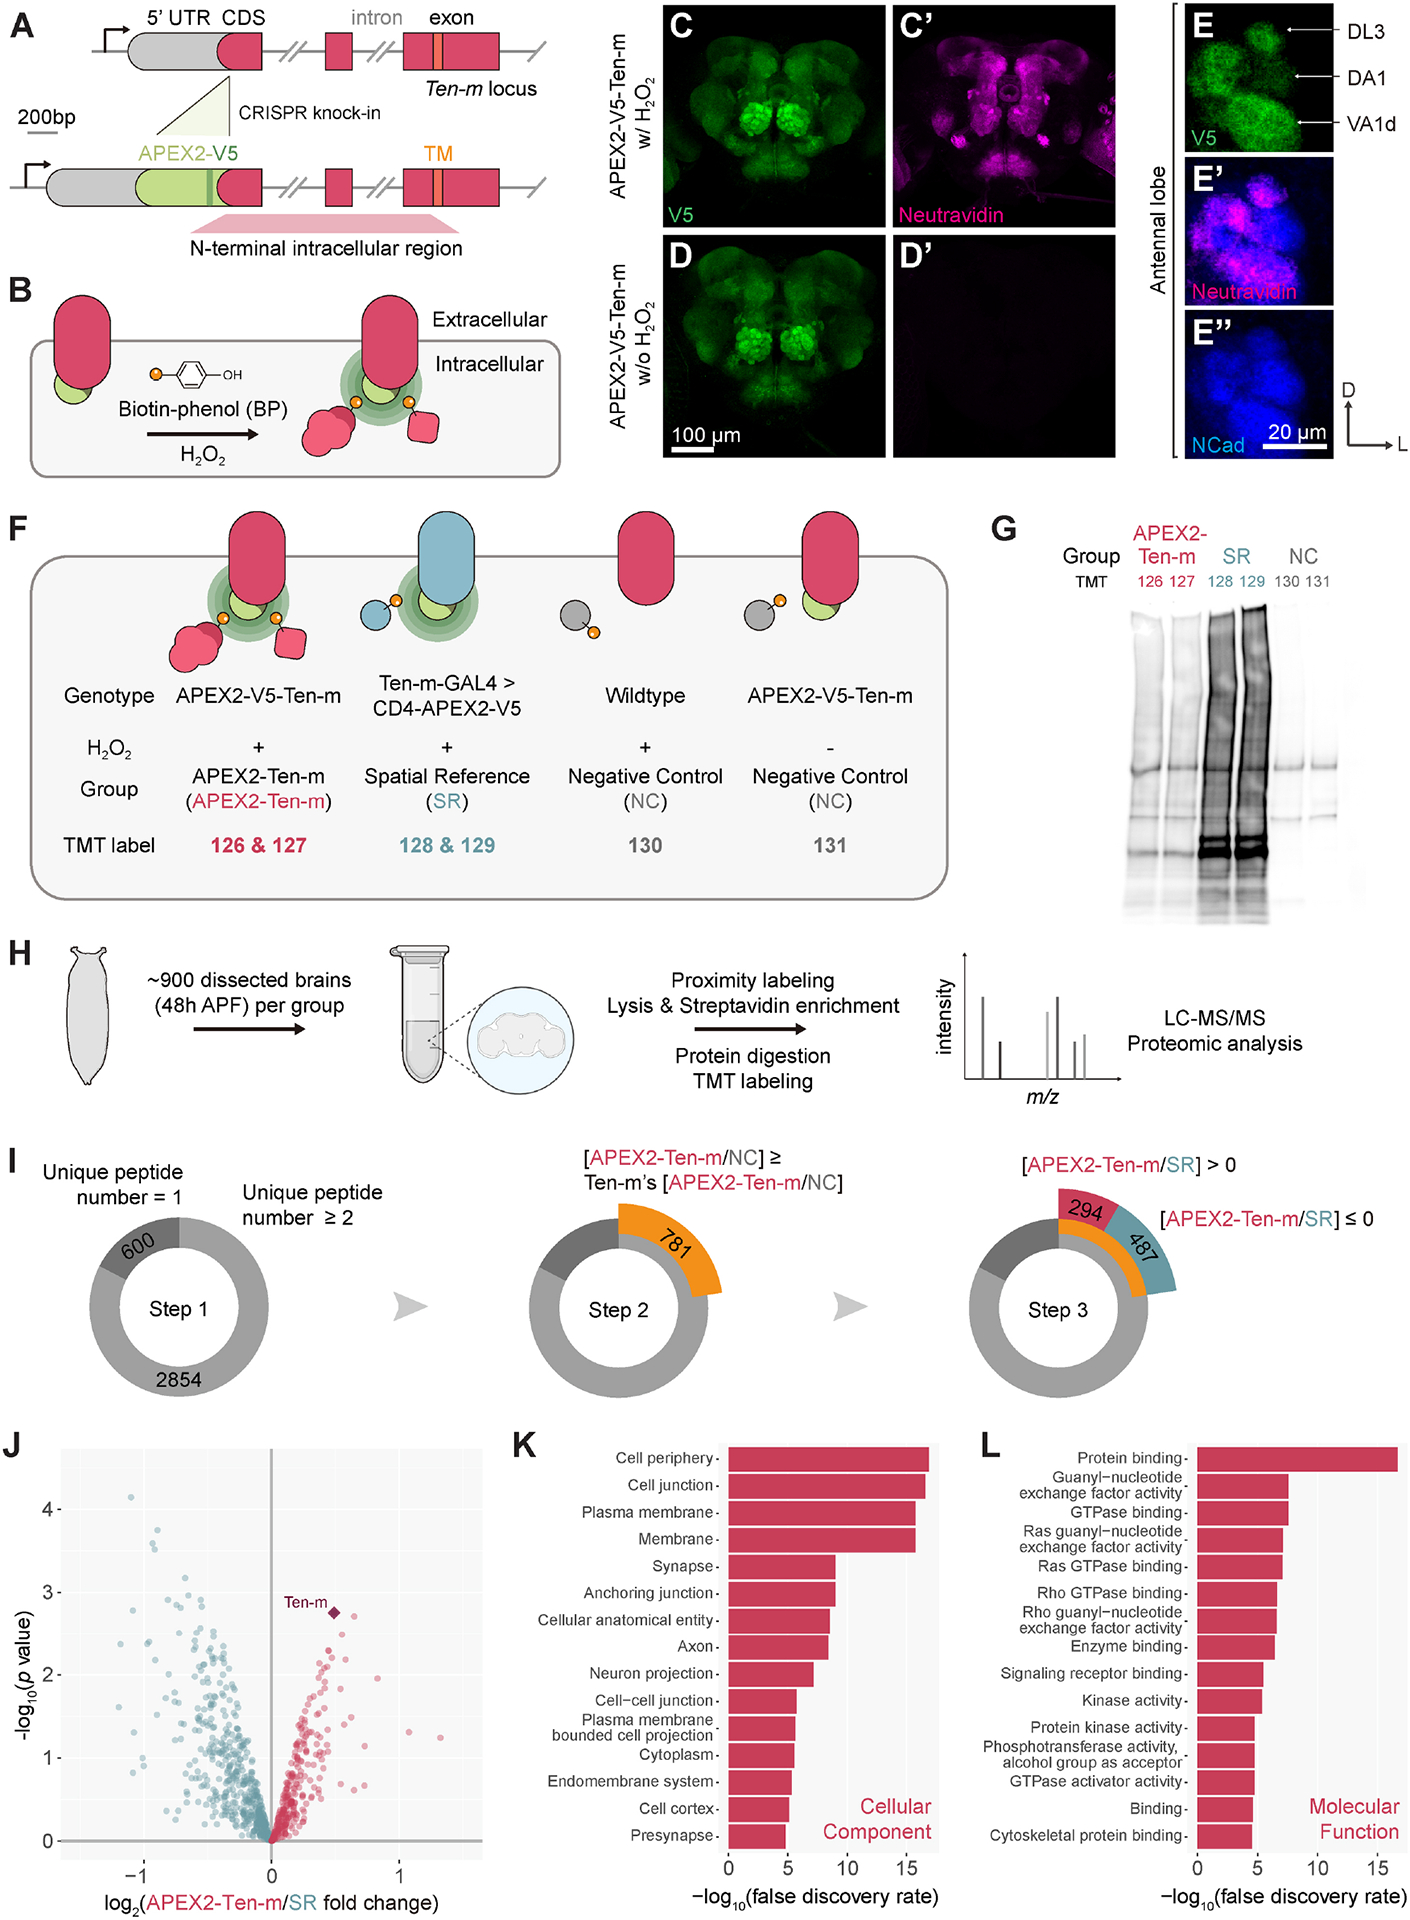
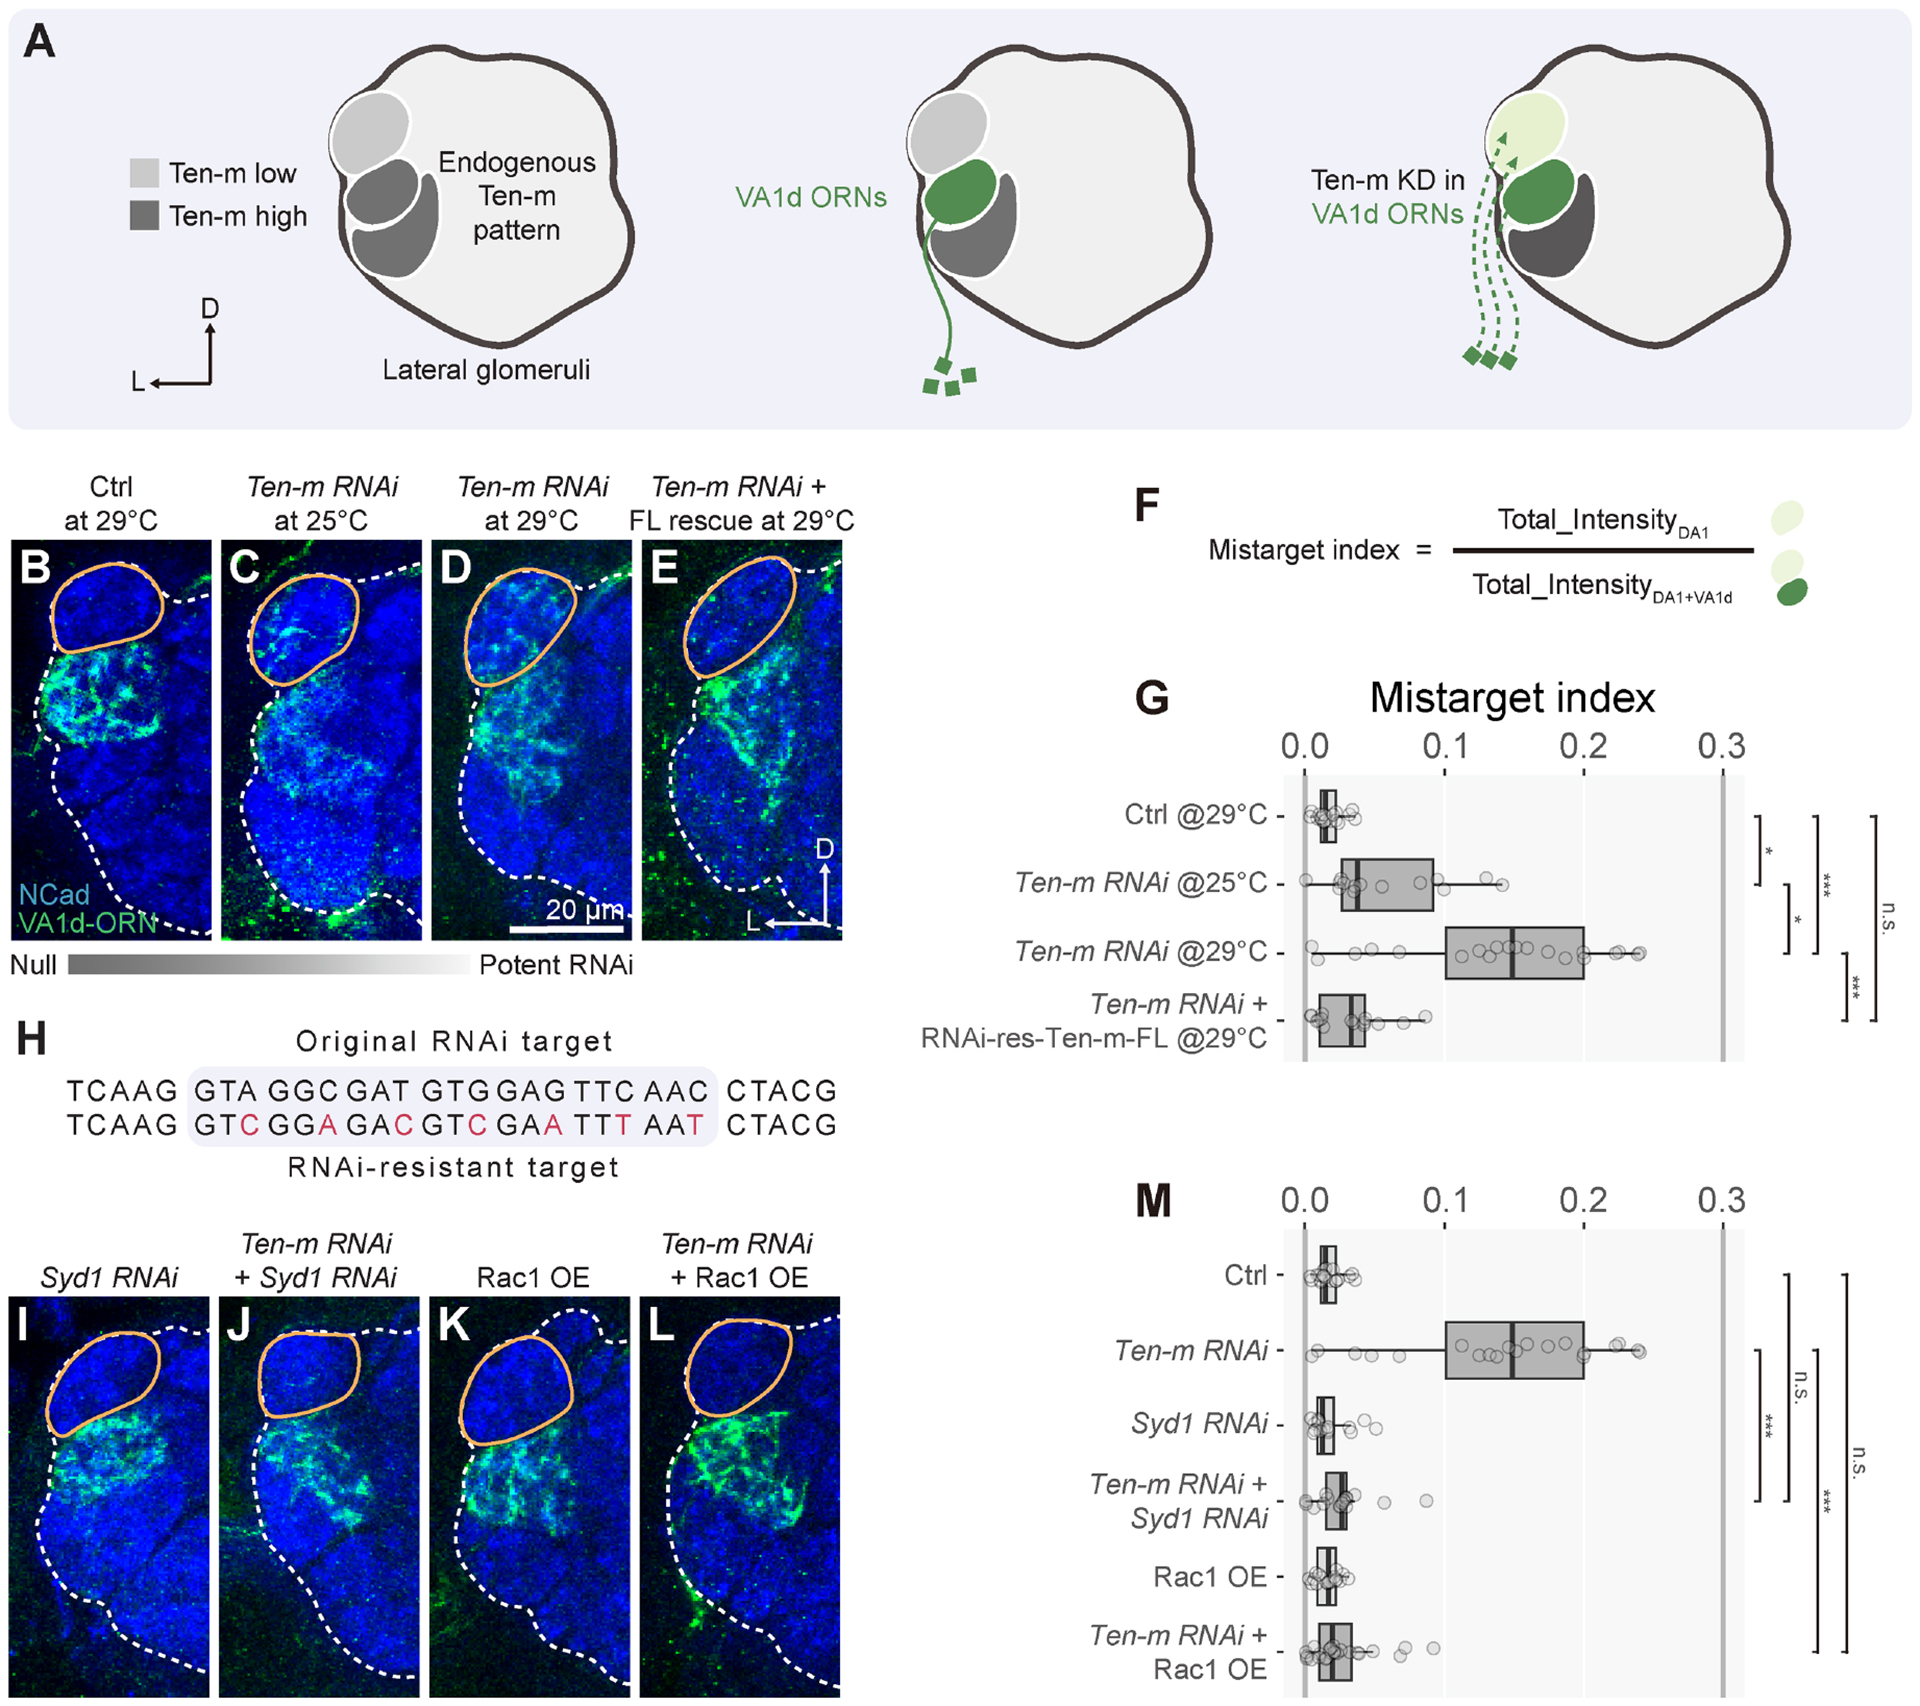
In developing brains, axons exhibit remarkable precision in selecting synaptic partners among many non-partner cells. Evolutionarily conserved teneurins are transmembrane proteins that instruct synaptic partner matching. However, how intracellular signaling pathways execute teneurins' functions is unclear. Here, we use in situ proximity labeling to obtain the intracellular interactome of a teneurin (Ten-m) in the Drosophila brain. Genetic interaction studies using quantitative partner matching assays in both olfactory receptor neurons (ORNs) and projection neurons (PNs) reveal a common pathway: Ten-m binds to and negatively regulates a RhoGAP, thus activating the Rac1 small GTPases to promote synaptic partner matching. Developmental analyses with single-axon resolution identify the cellular mechanism of synaptic partner matching: Ten-m signaling promotes local F-actin levels and stabilizes ORN axon branches that contact partner PN dendrites. Combining spatial proteomics and high-resolution phenotypic analyses, this study advanced our understanding of both cellular and molecular mechanisms of synaptic partner matching.

Keywords: Drosophila; Rho GTPases; RhoGAP; branch stabilization; homophilic attraction; olfactory circuit; olfactory receptor neurons; projection neurons; synaptic partner matching; teneurin.


Conflict of interest statement

Declaration of interests L.L. is a member of the advisory board for Cell.

Figures

Figure 1.
Figure 1.. A quantitative gain-of-function assay for synaptic partner matching
(A) Adult Drosophila brain schematic highlighting antennal lobes and locations of the DA1 and DL3 glomeruli. Left, DA1-ORN axons (green) synapse with DA1-PN dendrites (purple, contralateral projection omitted). Right, endogenous Ten-m levels are low in DA1-ORNs and DA1-PNs, but high in DL3-ORNs and DA1-PNs. (B) Schematic of sequential developmental steps of DA1 ORN-PN pairing. (C) Time course of control DA1-ORN axons (green, labeled by a membrane marker mCD8-GFP driven by DA1-ORN-GAL4, a split GAL4) innervating, elaborating, and coalescing with DA1-PN dendrites (magenta, labeled by a membrane-tagged tdTomato, driven by Mz19-QF2). APF, after puparium formation. (D) Ten-m overexpression causes DA1-ORNs to elaborate more dorsomedially, resulting in only partial overlap between DA1-ORN axons and DA1-PN dendrites. (E) “Match index” definition. (F–H) Confocal sections of adult antennal lobes showing DA1-ORN axons (green) of control (F), Ten-m-overexpression at 25°C (G) and 29°C (H), and DA1-PN dendrites (magenta). (I) Match indices for (F–H). (J) Domain organization of Ten-m, Ten-m-ΔECD, and Ten-m-ΔICD. TM, transmembrane domain; see Methods for domain abbreviations. (K, L) Confocal sections of adult antennal lobes showing DA1-ORN axons (green) overexpressing Ten-m-ΔECD (K) or Ten-m-ΔICD (L) at 29°C, and DA1-PN dendrites (magenta). (M) Match indices for (K) and (L). In this and all subsequent figures: D, dorsal; L, lateral. Dashed outlines, antennal lobe. NCad (N-cadherin) and BRP (Bruchpilot) are general neuropil markers. * p < 0.05; ** p < 0.01; *** p < 0.001; n.s., not significant. One-way ANOVA (with Tukey’s test) was used in (I) and (M). See Figures S1, S2 for additional data.
Figure 2.
Figure 2.. In situ spatial proteomics to identify proteins in physical proximity to Ten-m-ICD
(A) CRISPR-knockin at the Ten-m gene locus. APEX2-V5 is N-terminal to the Ten-m coding sequence (CDS). TM, transmembrane domain. (B) Schematic of APEX2-based in situ proximity labeling for profiling the Ten-m intracellular interactome. (C and C’) V5 and Neutravidin staining of APEX2-V5-Ten-m fly brain after proximity labeling. (D and D’) Same as C and C’ without H2O2. (E–E”) Representative confocal images of an antennal lobe showing that Ten-m expression and APEX2 activity are high in the DL3, VA1d, and VA1v glomeruli but low in the DA1 glomerulus. (F) Design of the quantitative proteomic experiment. TMT labels indicate the TMT tags (e.g., 126) used in all groups. The APEX2-Ten-m and SR groups each contains two replicates. (G) Streptavidin blot of the post-enrichment bead elute. (H) Workflow of the Ten-m intracellular interactome profiling. (I) Numbers of proteins after each step of the ratiometric and cutoff analysis. (J) Volcano plot showing all proteins at step 3. Each dot represents a protein; Diamond, Ten-m. Proteins in red constitute the Ten-m intracellular interactome. (K, L) Top 15 Gene Ontology terms for cellular component (K) or molecular function (L) in the Ten-m intracellular interactome. See Figure S3 and Tables S1, S2 for additional data.
Figure 3.
Figure 3.. Ten-m interacts with Syd1 RhoGAP and Rac1 GTPase in ORNs
(A) Selection criteria for the top candidate Ten-m-interacting proteins. Ten-m, Syd1, and Gek are highlighted with diamonds. (B) Domain organization of Syd1. *, a critical amino acid for RhoGAP activity. (C) The Rho GTPase cycle. Plasma membrane receptors control Rho GTPases through regulating guanine-nucleotide exchange factors (GEFs) or GTPase-activating proteins (GAPs), which switch Rho GTPases on or off, respectively. When GTP-bound, Rho GTPases bind to and activate effectors to regulate cytoskeletal dynamics. (D) Co-immunoprecipitation of V5-tagged Ten-m and FLAG-tagged Syd1 proteins from co-transfected S2 cells. MW, molecular weight. The low MW plot shows Ten-m-ΔECD (right) or proteolytic products of full-length (FL) Ten-m (middle). (E–I) Representative confocal images of DA1-PN dendrites (magenta) and DA1-ORN axons (green) of control (E), Ten-m overexpression (F), Syd1-RNAi alone (G), and Ten-m overexpression with Syd1-RNAi (H). Match indices in (I). (J–N) Representative confocal images of DA1-PN dendrites (magenta) and DA1-ORN axons (green) of Syd1 overexpression (J), Syd1 and Ten-m co-overexpression (K), Syd1-R979A overexpression (L), and Syd1-R979A and Ten-m co-overexpression (M). Match indices in (N). (O–S) Representative confocal images of DA1-PN dendrites (magenta) and DA1-ORN axons (green) of Rac1-RNAi (O), Ten-m overexpression with Rac1-RNAi (P), Rac1 overexpression (Q), and Ten-m and Rac1 co-overexpression (R). Match indices in (S). Kruskal-Wallis test with Bonferroni post-hoc correction for multiple comparisons was used in (I), (N), and (S). See Figure S4 for additional data.
Figure 4.
Figure 4.. Ten-m interacts with Syd1 and Rac1 in PNs
(A) Genetic interaction assay for Ten-m signaling in PN dendrites. Left, endogenous Ten-m levels. Mz19-GAL4 is expressed in VA1d-PNs and DA1-PNs (green), whose dendrites do not overlap with VA1v-ORN axons (purple) in control (middle) but overlap with VA1v-ORN axons when overexpressing Ten-m (right). (B–E) Representative confocal images of VA1v-ORN axons (magenta) and Mz19-PN dendrites (green) of control (B), Ten-m overexpression (C), Syd1-RNAi (D), and Ten-m overexpression with Syd1-RNAi (E). (F, G) Mismatch index (F) for experiments in Panels B–E (G). (H–L) Representative confocal images of VA1v-ORN axons (magenta) and Mz19-PN dendrites (green) of Syd1 overexpression (H), Syd1 and Ten-m co-overexpression (I), Syd1-R979A overexpression (J), and Syd1-R979A and Ten-m co-overexpression (K). Quantified in (L). (M–Q) Representative confocal images of VA1v-ORN axons (magenta) and Mz19-PN dendrites (green) of Rac1-RNAi (M), Ten-m overexpression with Rac1-RNAi (N), Rac1 overexpression (O), and Ten-m and Rac1 co-overexpression (P). Quantified in (Q). (R, S) Summary and working models for Ten-m signaling in ORN axons (R) and PN dendrites (S). In both cases, Ten-m negatively regulates Syd1, and in turn activates Rac1 GTPase. Ten-m exhibits negative genetic interactions with Gek and Cdc42 only in PN dendrites. Arrowheads indicate overlap regions between Mz19-PNs and VA1v-ORNs. Kruskal-Wallis test with Bonferroni post-hoc correction for multiple comparisons was used in (G), (L), and (Q). See Figures S4, S5 for additional data.
Figure 5.
Figure 5.. Syd1 and Rac1 modify Ten-m loss-of-function phenotypes
(A) Loss-of-function assay for Ten-m signaling. Left, Ten-m expression levels. Ten-m knockdown using a split-GAL4 in VA1d-ORNs (middle) causes partial mistargeting of VA1d-ORNs to the DA1 glomerulus (right). (B–E) Representative confocal images of VA1d-ORN axons of control (B), Ten-m-RNAi at 25°C (C), Ten-m-RNAi at 29°C (D), and Ten-m-RNAi with RNAi-resistant full-length (FL) Ten-m rescue at 29°C (E). (F, G) Mistarget index (F) from experiments in Panels B–E (G). (H) Original and RNAi-resistant Ten-m transgene sequences at the RNAi target site. (I–M) Representative confocal images of VA1d-ORN axons of Syd1-RNAi (I), Ten-m-RNAi and Syd1-RNAi (J), Rac1 overexpression (K), and Ten-m-RNAi with Rac1 overexpression (L). Quantified in (M). Yellow circle, DA1 glomerulus. Kruskal-Wallis test with Bonferroni post-hoc correction for multiple comparisons was used in (G) and (M).
Figure 6.
Figure 6.. Analysis of Ten-m signaling with single-axon resolution
(A) The “sparse driver” strategy. In a split-GAL4, the transcription activation domain (AD) is controlled by an enhancer separated by FRT10-STOP-FRT10. FLP-induced recombination between FRT10 sites occurs at ~10% efficiency compared to wild-type FRT sites. STOP designates a transcription termination sequence. Heat-shock-induced FLP expression removes the STOP and enables AD expression in a fraction of cells, which together with the GAL4 DNA-binding domain (DBD) expressed from a separate transgene would reconstitute functional GAL4, driving co-expression of multiple genes of interest (GOI) in these cells. (B) Compared to conventional split-GAL4, sparse driver enables different sparsity of transgene expression tuned by heat-shock time. (C) Example of a single DA1-ORN axon innervating both ipsilateral and contralateral antennal lobes, enabled by sparse driver. (D) Z-projection of the 3D trace of the example DA1-ORN axon in (C) illustrating quantitative parameters extracted from the trace. Length of the stem axon (dark green) is measured from the antennal lobe entry point (orange square) to the end point (orange triangle). A primary branch point (yellow dot) is where a collateral branch (light green) intersects with the stem axon. (E) Zoom-in of the example DA1-ORN axon. Primary branch location is defined as the distance between the antennal lobe entry point (orange square) and the primary branch point (yellow dot). Some primary and secondary DA1-ORN branches are in contact with DA1-PN dendrites (purple shade). (F–H) Three stages of a developing DA1-ORN axon. (F) Stage 1: stem axon length <100 μm, usually before midline crossing. (G) Stage 2: stem axon length 100–170 μm; most axons have crossed the midline but have not reached the contralateral PN dendrites. (H) Stage 3: stem axon length >170 μm; most axons have reached the contralateral PN dendrites. Purple shade, DA1-PN dendrites. (F’-H”‘) Representative maximum Z-projection images of sparse DA1-ORN axons in control (F’–H’), Ten-m overexpression (F”–H”), and Ten-m overexpression with Rac1-RNAi (F’”–H’”) at each developmental stage Two examples per genotype are shown for Stages 1 and 2. For Stage 3, a single example in both ipsilateral (left) and contralateral (right) antennal lobes is shown. Arrowheads indicate dorsomedially shifted branches. (I–K”) Histograms of primary branch point distribution of DA1-ORN axons in control (I–K, top), Ten-m overexpression (I’–K’, middle), and Ten-m overexpression with Rac1-RNAi (I”–K”, bottom) at each stage. On the x-axis, 0 represents the antennal lobe entry point and 1 represents the end point of the stem axon. Right shifts of ipsilateral branches and left shifts of contralateral branches indicate dorsomedial shifting. Blue portions of the histogram indicate DA1-ORN axon branches in contact with DA1-PN dendrites. Yellow shade indicates peaks of DA1-PN contacting branches in control. Red arrowheads indicate shifted histogram peaks due to mistargeted axons. (L, M) Fractions of DA1-ORN axon branches (L) or multifurcated axon branches (M) in contact with DA1-PN dendrites. Blue and gray represent DA1-PN-contacting and non-contacting branches, respectively. A primary axon branch with at least one secondary branch is categorized as multifurcated. (N–Q) Quantification of branch densities (N), stem axon lengths (O), total branch number (P) and DA1-PN-contacting secondary branch number (Q) at each developmental stage for the listed genotypes. Chi-squared tests (L, M) and the one-way ANOVA (with Tukey’s test) (N–Q) were used for multiple comparisons. See Figure S6 for additional data.
Figure 7.
Figure 7.. F-actin distribution analysis and summary
(A–A”) Representative confocal images of DA1-PN dendrites (A, magenta), a DA1-ORN axon (A and A’, green), and F-actin distribution in the same DA1-ORN axon (A’, magenta; A”, heatmap based on Halo-Moesin staining) of control. Arrows, non-DA1-PN-contacting primary branches; arrowheads, F-actin hotspots. Dashed white traces outline DA1-PN dendrites. (B) F-actin density definition. (C) Classification of DA1-ORN axonal branches for quantification. Top: DA1-PN-contacting branches, blue; non-DA1-PN-contacting branches, gray. Primary branches have thicker width compared to high-order branches. Bottom: triangle, F-actin hotspots in primary branches; dark blue, DA1-PN-contacting segments; light blue, non-DA1-PN-contacting segments. Purple shade, DA1-PN dendrites. (D, H) F-actin density of each axon branch of control (D), Ten-m overexpression (H, left), and Ten-m overexpression with Rac1-RNAi (H, right). Each dot represents one DA1-ORN axon branch that contacts (blue) or does not contact (gray) DA1-PN dendrites. (E) F-actin densities of DA1-PN-contacting segments [DA1-PN(+)] and non-DA1-PN-contacting segments [DA1-PN(−)] in DA1-PN-contacting primary branches in control. Each dot represents one primary DA1-PN-contacting branch. (F–G”) Representative confocal images of DA1-PN dendrites, DA1-ORN axons, and F-actin distribution of Ten-m overexpression (F–F”), and Ten-m overexpression with Rac1-RNAi (G–G”). Labels same as A–A”. (I–K) Summary of the Ten-m signaling in synaptic partner matching. Ten-m level directs ORN-PN synaptic partner matching (I). Developmental single-axon analysis revealed that Ten-m specifically acts at the step of stabilizing axon branches but not general axon growth or branch exploration (J). In situ spatial proteomics and in vivo genetic perturbations delineated the signaling axis: Ten-m negatively regulates the RhoGAP Syd1, in turn activating the Rac1 GTPase to tune F-actin distribution (K). Data are from 6 axons for each genotype. Mann-Whitney U tests were used for comparisons (D, H). A paired t test was used for the within-branch comparison (E). See Figure S7 for additional data.

References

    1. Sanes JR, and Yamagata M (2009). Many Paths to Synaptic Specificity. Annu. Rev. Cell Dev. Biol 25, 161–195. 10.1146/annurev.cellbio.24.110707.175402. - DOI - PubMed
    1. Jan Y-N, and Jan LY (2010). Branching out: mechanisms of dendritic arborization. Nat Rev Neurosci 11, 316–328. 10.1038/nrn2836. - DOI - PMC - PubMed
    1. Kolodkin AL, and Tessier-Lavigne M (2011). Mechanisms and Molecules of Neuronal Wiring: A Primer. Cold Spring Harbor Perspectives in Biology 3, a001727–a001727. 10.1101/cshperspect.a001727. - DOI - PMC - PubMed
    1. Sanes JR, and Zipursky SL (2020). Synaptic Specificity, Recognition Molecules, and Assembly of Neural Circuits. Cell 181, 536–556. 10.1016/j.cell.2020.04.008. - DOI - PubMed
    1. Hong W, Mosca TJ, and Luo L (2012). Teneurins instruct synaptic partner matching in an olfactory map. Nature 484, 201–207. 10.1038/nature10926. - DOI - PMC - PubMed

LinkOut - more resources