. 2024 Aug:106:105235.
doi: 10.1016/j.ebiom.2024.105235. Epub 2024 Jul 13.

Effect of ultrasound-mediated blood-spinal cord barrier opening on survival and motor function in females in an amyotrophic lateral sclerosis mouse model

Affiliations

Effect of ultrasound-mediated blood-spinal cord barrier opening on survival and motor function in females in an amyotrophic lateral sclerosis mouse model

Anne-Sophie Montero et al. EBioMedicine. 2024 Aug.

Abstract

Background: Amyotrophic lateral sclerosis (ALS) is a fatal neurodegenerative disease characterized by a progressive loss of motor neurons. The limited efficacy of recent therapies in clinical development may be linked to lack of drug penetration to the affected motor neurons due to the blood-brain barrier (BBB) and blood-spinal cord barrier (BSCB).

Methods: In this work, the safety and efficacy of repeated short transient opening of the BSCB by low intensity pulsed ultrasound (US, sonication) was studied in females of an ALS mouse model (B6.Cg-Tg(SOD1∗G93A)1Gur/J). The BSCB was disrupted using a 1 MHz ultrasound transducer coupled to the spinal cord, with and without injection of insulin-like growth factor 1 (IGF1), a neurotrophic factor that has previously shown efficacy in ALS models.

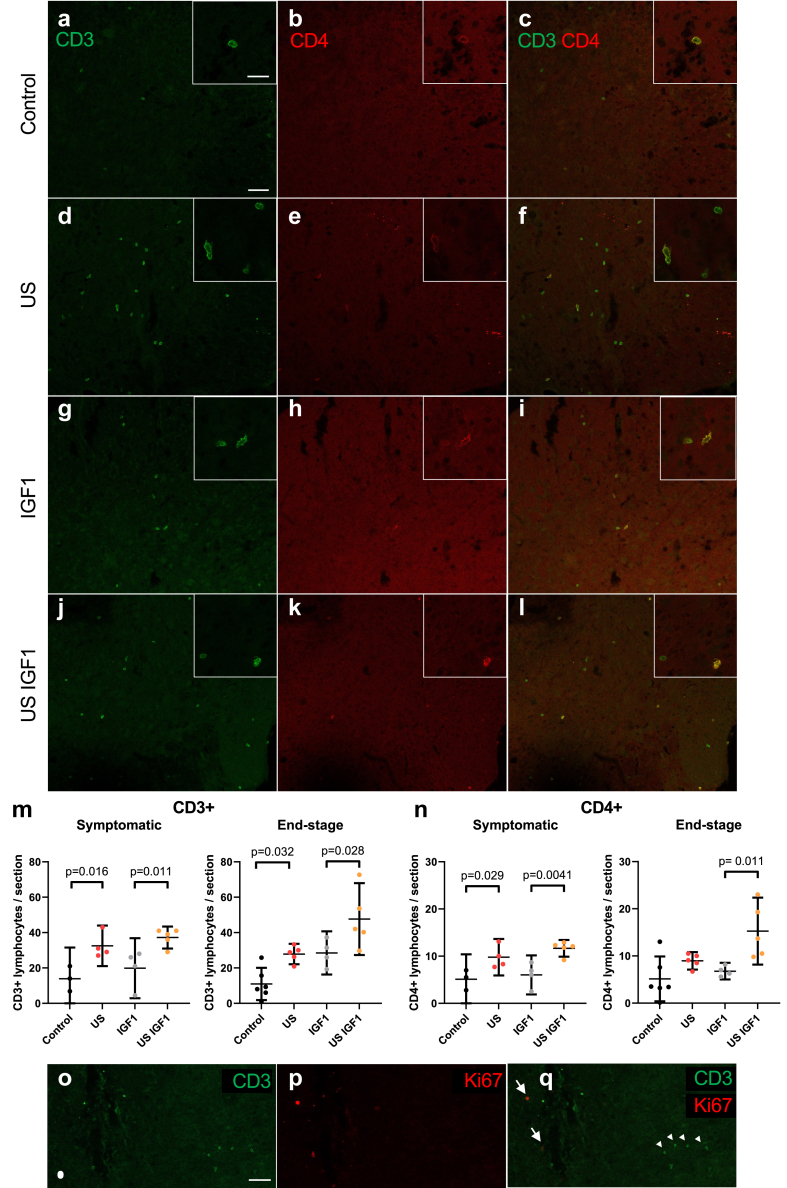
Findings: Results in wild-type (WT) animals demonstrated that the BSCB can be safely disrupted and IGF1 concentrations significantly enhanced after a single session of transient BSCB disruption (176 ± 32 μg/g vs. 0.16 ± 0.008 μg/g, p < 0.0001). Five repeated weekly US sessions performed in female ALS mice demonstrated a survival advantage in mice treated with IGF1 and US (US IGF1) compared to treatment with IGF1 alone (176 vs. 166 days, p = 0.0038). Surprisingly, this survival advantage was also present in mice treated with US alone vs. untreated mice (178.5 vs. 166.5 days, p = 0.0061). Muscle strength did not show difference among the groups. Analysis of glial cell immunoreactivity and microglial transcriptome showing reduced cell proliferation pathways, in addition to lymphocyte infiltration, suggested that the beneficial effect of US or US IGF1 could act through immune cell modulation.

Interpretation: These results show the first step towards a possible beneficial impact of transient BSCB opening for ALS therapy and suggest implication of immune cells.

Funding: Fondation pour la Recherche Médicale (FRM). Investissements d'avenirANR-10-IAIHU-06, Société Française de Neurochirurgie (SFNC), Fond d'étude et de Recherche du Corps Medical (FERCM), Aide à la Recherche des Maladies du Cerveau (ARMC), SLA Fondation Recherche (SLAFR), French Ministry for High Education and Research (MENR), Carthera, Laboratoire de Recherche en Technologies Chirurgicales Avancées (LRTCA).

Keywords: Amyotrophic lateral sclerosis (ALS); Blood-spinal cord barrier (BSCB); Lymphocytes; Motor neuron disease (MND); Neuroinflammation; Ultrasound.


Conflict of interest statement

Declaration of interests Michael Canney is an employee of Carthera and has ownership interest in the company as well as patents related to this technology. Alexandre Carpentier is a consultant to Carthera, has ownership interest in the company, and has filed patents pertaining to the results presented in the paper. Gaelle Bruneteau: Grants from the French association for ALS (ARSLA) and the French association for Myopathies (AFM), National Hospital Clinical Research Programs (PHRC-N).

Figures

Fig. 1
Fig. 1
Experimental design of low intensity pulsed ultrasound (US) mediated blood-spinal cord barrier (BSCB) opening in ALS mice. [left] Illustration of the treatment setup. A 1 MHz ultrasound transducer was coupled to the skin with coupling gel and positioned to target the lumbar spinal cord of the mouse. BSCB disruption was performed by applying pulsed ultrasound for a duration of 150 s at time of microbubble administration. [right] Disease progression in a SOD1G93A ALS mouse and the treatment protocol. Typical evolution of the weight of a mutant SOD1G93A female ALS model mouse over the course of 170 days. Disease onset was defined as the time point at which the mouse was at its peak weight. Five weekly sessions of treatment with US, IGF1, or the combination of the two, were performed weekly from day 106 to day 134 for each mouse and corresponded approximately to the early phase of the disease in this SOD1 mouse model.
Fig. 2
Fig. 2
Evans Blue Dye (EBD) and Insulin-like Growth Factor 1 (IGF1) levels were enhanced in the spinal cord after low intensity pulsed ultrasound (US) mediated blood-spinal cord barrier (BSCB) opening with no negative effect on global histological tissue integrity. (a) Macroscopic view of the US-treated spinal cord of a wild-type mouse after EBD injection. The blue mark at the US-treated segment of the spinal cord corresponds to the local passage of the EBD into the central nervous system after BSCB opening, scale bar: 1 cm. (b) Concentration of EBD in the spinal cord of control EBD-injected (EBD, n = 20) and EBD injected and US-treated (US EBD, n = 27) wild-type mice (left). Concentration of IGF1 in the spinal cord of control IGF1-injected (IGF1, n = 14) and IGF1-injected and US-treated (US IGF1, n = 15) mice (right). The IGF1 concentration was 1100 times higher in the US-treated segments of the spinal cord, while it was only three-fold increased for EBD. This difference can be explained by the fact that IGF1 is smaller in weight (7.6 kDa) than EBD which binds with albumin forming a 68 kDa complex. Graphs represent mean with 95% Confidence interval (CI). p values were determined by Mann-Whitney test. (c, f) Images of Nissl-stained spinal cord sections of symptomatic SOD1G93A mice treated (US) or not (control) with US. (g,h) Images of Choline acetyltransferase (ChAT)-immunostained spinal cord sections of end stage SOD1G93A mice treated (US) or not (control) with US. Scale bars 200 μm in c for c-d, 20 μm in e for e-f, 20 μm in g for g-h.
Fig. 3
Fig. 3
Disruption of the blood-spinal cord barrier (BSCB) by low intensity pulsed ultrasound (US) prolongs the survival of ALS mice with or without Insulin-like Growth Factor 1 (IGF1). (a and b) Kaplan-Meier curves for (a) the age of disease onset of the mice in the different treatment groups and (b) the survival times of the different groups of treated mice. Control: ALS mice, US: US-treated ALS mice, IGF1: IGF1-treated ALS mice, US IGF1: IGF1-treated and US-treated ALS mice. p values were determined by log-rank test to compare all groups and log-rank test with Bonferroni correction between two separate groups. (c and d) Impact of treatment on (c) early-phase disease duration (from onset to the symptomatic stage defined as 10% of weight loss) and (d) late-phase disease duration (from the symptomatic stage to end stage). Note that mice were followed from the age of 7 weeks and that the treatment was stopped at 134 days. Bars: mean ± SD. p values were determined by ANOVA followed by a post hoc Šídák multiple comparison test.
Fig. 4
Fig. 4
Disruption of the blood spinal cord barrier (BSCB) by low intensity pulsed ultrasound (US) modifies glial cell immunoreactivity in the lumbar spinal cord of ALS mice. (a) Images of ChAT-immunostained motor neurons in the lumbar spinal cord of ALS mice at disease end stage after the different treatments (ctrl: control, no treatment). (b–d) Motor neuron counts in the lumbar spinal cord after Nissl staining (b,c) at the symptomatic stage (symptomatic, b) or end stage (c), or after ChAT-immunostaining at disease end stage (d). For b, WT n = 8, control n = 3, US n = 3, IGF1 n = 4, US IGF1 n = 5; for c, WT n = 8, control n = 6, US n = 6, IGF1 n = 4, US IGF1 n = 5; for d, control n = 6, US n = 6, IGF1 n = 4, US IGF1 n = 4. (e) Motor neuron Feret’s diameter measured at disease end stage on ChAT-stained motor neurons. (f) Immunostaining against SOD1 of the lumbar spinal cords at the symptomatic stage in the different groups. (g and h) Quantification of the mutant SOD1+ immunoreactive area (symptomatic (g) control n = 3, US n = 4, IGF1 n = 4, US IGF1 n = 5, end stage (h) control n = 6, US n = 6, IGF1 n = 4, US IGF1 n = 5). p values were determined by Brown-Forsythe corrected ANOVA followed by Dunnett multiple comparison post hoc test. (i) Immunostaining against GFAP to stain astrocytes in the lumbar spinal cords at the symptomatic stage in the different groups. (j and k) GFAP immunoreactive area (symptomatic (j) control n = 3, US n = 4, IGF1 n = 4, US IGF1 n = 5, end stage (k) control n = 6, US n = 6, IGF1 n = 4 US IGF1 n = 5). p values were determined by ANOVA followed by a post hoc Šídák multiple comparison test. (l) Immunostaining against Iba1 to stain microglial cells in the lumbar spinal cords at the symptomatic stage in the different groups. (m and n) Iba1 immunoreactive area (symptomatic (m) control n = 3, US n = 4 IGF1 n = 4, US IGF1 n = 5, end stage (n) control n = 6, US n = 6, IGF1 n = 4, US IGF1 n = 5). p values were determined by Brown-Forsythe corrected ANOVA followed by Dunnett multiple comparison post hoc test. Bars represent mean with 95% CI. Scale bar: (a) 20 μm, (f, i, l) 200 μm for the upper panels, 20 μm for the lower panels. (o and p) Microglial morphology at the symptomatic stage measured on Iba1+ cells in lumbar spinal cords, control n = 3, US n = 4 IGF1 n = 4, US IGF1 n = 5. (o) Number of branches per microglial cell and (p) total branch length per microglia.
Fig. 5
Fig. 5
Low intensity pulsed ultrasound (US) modifies microglial transcriptome in ALS mice. (a) Experimental design for lumbar spinal cord isolated microglial cell transcriptome analysis of symptomatic ALS mice treated or not with US at the end of 5 repeated US treatment. Graphics done with Biorender. (b) Volcano plot of deregulated genes (FC > 1.5, p < 0.05; red: upregulated, blue: downregulated, grey: not regulated, Not Sig). (c) Enrichment analyses (‘Gene Set Enrichment Analysis’, GSEA) depicting significantly regulated pathways (p.adjust < 0.05, multiple hypothesis testing). Counts: number of genes in pathways, p.adjust: adjusted p value, NES: normalised enrichment score. (d) Heatmap of the Hallmark ‘G2M checkpoint’ pathway implicated in cell proliferation. (e) Gene Set Enrichment Analysis (GSEA) plot of the Hallmark ‘G2M checkpoint’ pathway. (f) Heatmap of the Hallmark ‘IL2 STAT5 signalling’ pathway implicated in regulatory T cell development, function and attraction. Heatmap scales in (d,f) are depicted as normalized read-counts by variance-stabilizing transformation (VST) centered on the mean for each gene.
Fig. 6
Fig. 6
Disruption of the blood spinal cord barrier (BSCB) by low intensity pulsed ultrasound (US) enhances CNS lymphocyte infiltration in ALS mice. (a–l) Images of spinal cord sections of symptomatic stage ALS mice in the four different groups, immunostained for the lymphocyte pan-T CD3 (a,d,g,j, green) and specific lymphocyte T CD4 (b,e,h,k, red) markers and merged (c,f,i,l). Scale bars: 50 μm in (a) for (a–l) and 20 μm in inset of (a) for insets in (a–l). (m,n) Number of lymphocytes in the lumbar spinal cords of the different groups at the symptomatic stage (left graphs) or at disease end stage (right graphs), measured by counting the total number of CD3+ lymphocytes (m) or CD4+ cells (n) per spinal cord section (symptomatic, control n = 3, US n = 4, IGF1 n = 4, US IGF1 n = 5, end stage, control n = 6, US n = 5, IGF1 n = 4, US IGF1 n = 5). Bars represent mean with 95% CI. p values were determined by ANOVA followed by a post hoc Šídák multiple comparison test. (o–q) Images of a spinal cord section of a symptomatic stage ALS mouse that underwent US treatment, immunostained for the lymphocyte pan-T CD3 (o,q, green) and the cell proliferation marker Ki67 (p,q, red). Note that lymphocytes (arrowheads) are not Ki67 positive (arrows). Scale bar: 50 μm in (o) for (o–q).

References

    1. Miller R.G., Mitchell J.D., Lyon M., et al. Riluzole for amyotrophic lateral sclerosis (ALS)/motor neuron disease (MND) Cochrane Database Syst Rev. 2002 doi: 10.1002/14651858.CD001447. - DOI - PubMed
    1. Bartanusz V., Jezova D., Alajajian B., et al. The blood-spinal cord barrier: morphology and clinical implications. Ann Neurol. 2011;70(2):194–206. - PubMed
    1. Mohamed L.A., Markandaiah S., Bonanno S., et al. Blood-brain barrier driven pharmacoresistance in amyotrophic lateral sclerosis and challenges for effective drug therapies. AAPS J. 2017;19(6):1600–1614. - PMC - PubMed
    1. Pardridge W.M. The blood-brain barrier: bottleneck in brain drug development. NeuroRx. 2005;2(1):3–14. - PMC - PubMed
    1. Garbuzova-Davis S., Willing A.E., Zigova T., et al. Intravenous administration of human umbilical cord blood cells in a mouse model of amyotrophic lateral sclerosis: distribution, migration, and differentiation. J Hematother Stem Cell Res. 2003;12(3):255–270. - PubMed

Substances