Clinical Trial
. 2024 Aug:106:105239.
doi: 10.1016/j.ebiom.2024.105239. Epub 2024 Jul 13.

Combination cell therapy leads to clonal deletion of donor-specific T cells in kidney transplant recipients

Affiliations
Clinical Trial

Combination cell therapy leads to clonal deletion of donor-specific T cells in kidney transplant recipients

Ana F David et al. EBioMedicine. 2024 Aug.

Abstract

Background: Induction of donor-specific tolerance is a promising approach to achieve long-term graft patency in transplantation with little to no maintenance immunosuppression. Changes to the recipient's T cell receptor (TCR) repertoire are understood to play a pivotal role in the establishment of a robust state of tolerance in chimerism-based transplantation protocols.

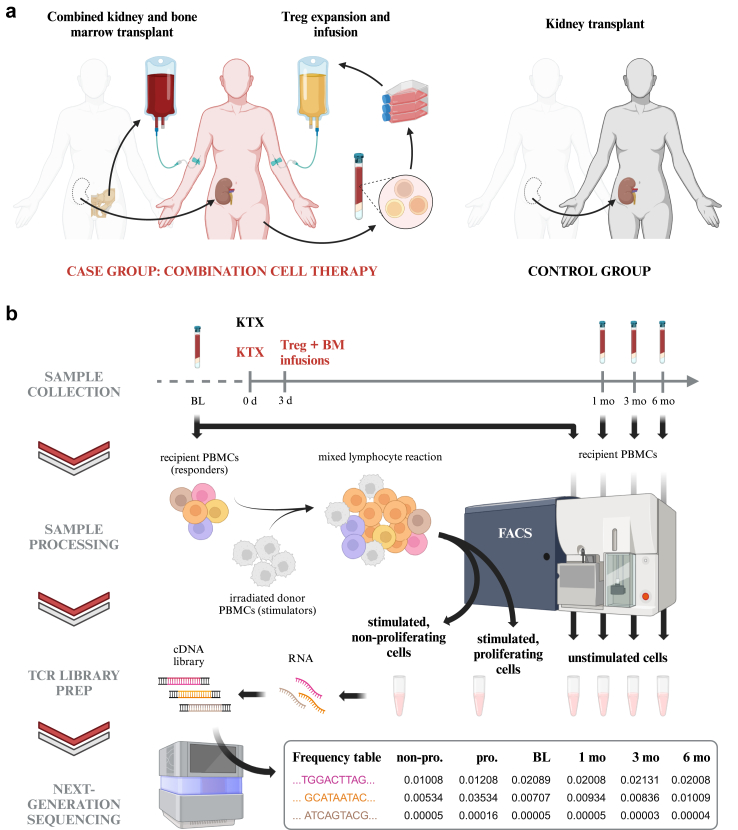
Methods: We investigated changes to the TCR repertoires of patients participating in an ongoing prospective, controlled, phase I/IIa trial designed to evaluate the safety and efficacy of combination cell therapy in living donor kidney transplantation. Using high-throughput sequencing, we characterized the repertoires of six kidney recipients who also received bone marrow from the same donor (CKBMT), together with an infusion of polyclonal autologous Treg cells instead of myelosuppression.

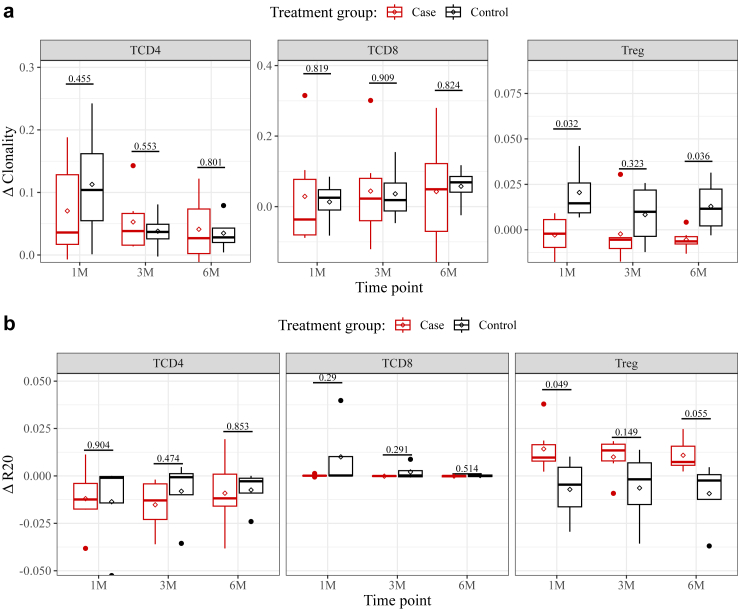
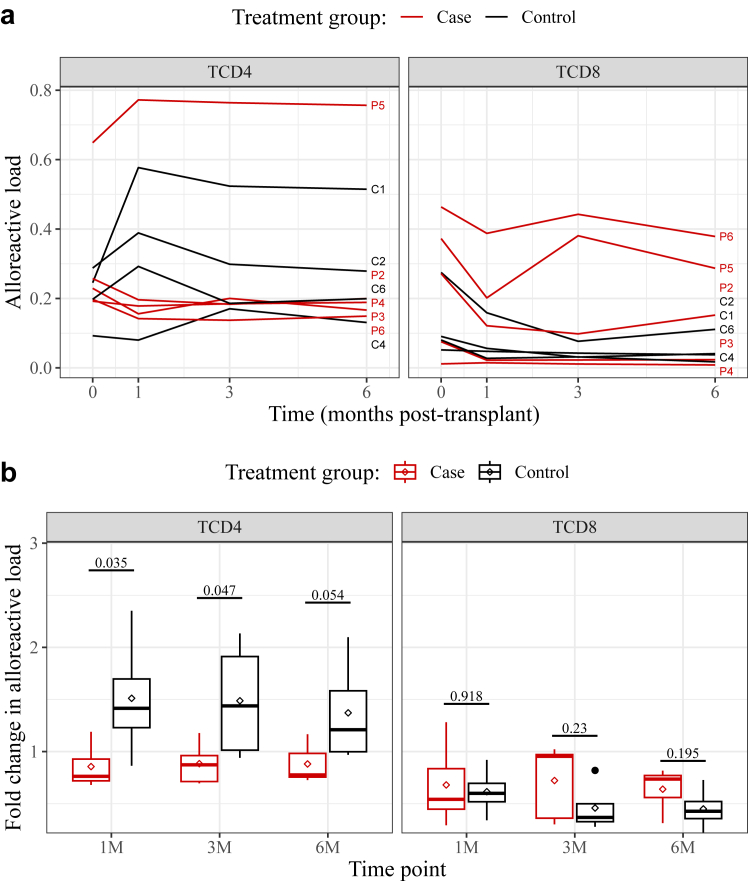
Findings: Patients undergoing combination cell therapy exhibited partial clonal deletion of donor-reactive CD4+ T cells at one, three, and six months post-transplant, compared to control patients receiving the same immunosuppression regimen but no cell therapy (p = 0.024). The clonality, R20 and turnover rates of the CD4+ and CD8+ TCR repertoires were comparable in both groups, showing our protocol caused no excessive repertoire shift or loss of diversity. Treg clonality was lower in the case group than in control (p = 0.033), suggesting combination cell therapy helps to preserve Treg diversity.

Interpretation: Overall, our data indicate that combining Treg cell therapy with CKBMT dampens the alloimmune response to transplanted kidneys in humans in the absence of myelosuppression.

Funding: This study was funded by the Vienna Science and Technology Fund (WWTF).

Keywords: Alloreactivity; Cell therapy; Immunological tolerance; Kidney transplantation; T cell receptor.


Conflict of interest statement

Declaration of interests The authors have declared that no conflict of interest exists.

Figures

Fig. 1
Fig. 1
Summary of study design and experimental workflow.(a) A total of 12 living donor kidney transplant recipients participated in a prospective, controlled phase I/IIa trial designed to test a combination cell therapy protocol. Within three days after the transplant, six patients assigned to the case group received bone marrow from the same donor and an infusion of in vitro expanded autologous Treg cells. Six kidney transplant recipients in the control group received neither bone marrow nor Tregs. (b) Blood samples were collected from all recipients for TCR repertoire monitoring at one, three, and six months post-transplant. Isolated peripheral blood mononuclear cells (PBMCs) were then sorted into three unstimulated lymphocyte populations (CD4+, CD8+ and Treg) by fluorescence-activated cell sorting (FACS; see Supplementary Fig. S1A for the gating strategy). PBMCs collected pre-transplant were either processed as described above to establish baseline (BL) TCR repertoires or co-cultured for six days with irradiated donor cells in a mixed lymphocyte reaction (MLR). Recipient cells stimulated in an MLR were sorted by FACS into the populations listed above and, in parallel, into proliferating and non-proliferating cells (see Supplementary Fig. S1B for the gating strategy). RNA isolated from all sorted samples was used as template for preparation of TCR cDNA libraries for next-generation sequencing. The frequency of each unique TCR sequence (clonotype) was computed from the assembled sequencing reads. See Methods for details. Illustrations created with BioRender.com.
Fig. 2
Fig. 2
Changes to the diversity of TCR repertoires during the first 6 months after kidney transplant. Clonality and R20 were computed on downsampled CD4+, CD8+ and Treg repertoires and then normalized to the pre-transplant baseline, such that a delta-value of 0 denotes no change. Boxplots of (a) Clonality and (b) R20 delta-values, grouped by treatment group. Above, p-values derived for each time-point from a Mixed Model for Repeated Measurements (MMRM), contrasting the means of the two groups. Across all timepoints, p = 0.033). Lines and diamonds denote median and mean values, respectively; lower and upper hinges correspond to the first and third quartiles; whiskers extend to the smallest and largest values within 1.5∗IQR. Dots correspond to outlying data points. Non-normalized Clonality and R20 values for each patient are shown in Supplementary Fig. S6A and B, respectively. See Methods for details.
Fig. 3
Fig. 3
Changes to the relative abundance of alloreactive TCR clonotypes during the first 6 months after kidney transplant. Clonotypes identified as alloreactive (i.e., those proliferating once stimulated with donor PBMCs) were detected in CD4+and CD8+ downsampled repertoires. (a) The alloreactive loads were quantified by normalizing the total frequencies of alloreactive clonotypes (shown in Supplementary Fig. S8A) to that of randomly sampled clonotypes, and plotted over time for each study subject, identified as Patient (P) #1–6 or Control (C) #1–6. (b). The alloreactive loads were then normalized to the pre-transplant baseline such that a fold-change of 1 denotes no change. Shown are boxplots comparing the two treatment groups. Above, p-values derived for each time-point from a Mixed Model for Repeated Measurements (MMRM), contrasting the means of the two groups. Across all timepoints, p = 0.024. Lines and diamonds denote median and mean values, respectively; lower and upper hinges correspond to the first and third quartiles; whiskers extend to the smallest and largest values within 1.5∗IQR. Dots correspond to outlying data points.

References

    1. Global, regional, and national burden of chronic kidney disease, 1990–2017: a systematic analysis for the Global Burden of Disease Study 2017. Lancet Lond Engl. 2020;395:709–733. - PMC - PubMed
    1. Hariharan S., Israni A.K., Danovitch G. Long-term survival after kidney transplantation. N Engl J Med. 2021;385:729–743. - PubMed
    1. Strohmaier S., Wallisch C., Kammer M., et al. Survival benefit of first single-organ deceased donor kidney transplantation compared with long-term dialysis across ages in transplant-eligible patients with kidney failure. JAMA Netw Open. 2022;5 - PMC - PubMed
    1. Wekerle T., Segev D., Lechler R., Oberbauer R. Strategies for long-term preservation of kidney graft function. Lancet. 2017;389:2152–2162. - PubMed
    1. Mayrdorfer M., Liefeldt L., Wu K., et al. Exploring the complexity of death-censored kidney allograft failure. J Am Soc Nephrol JASN. 2021;32:1513–1526. - PMC - PubMed

Publication types

Substances