. 2024 Aug 20;63(16):2009-2022.
doi: 10.1021/acs.biochem.4c00012. Epub 2024 Jul 12.

Transcription Attenuation in Synthetic Promoters in Nonoverlapping Tandem Formation

Affiliations

Transcription Attenuation in Synthetic Promoters in Nonoverlapping Tandem Formation

Vatsala Chauhan et al. Biochemistry. .

Abstract

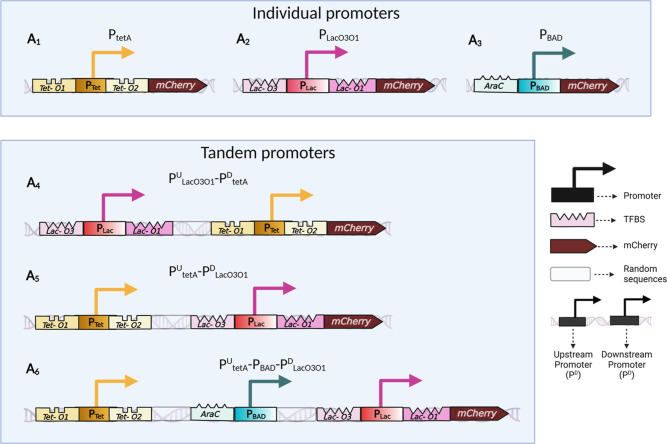
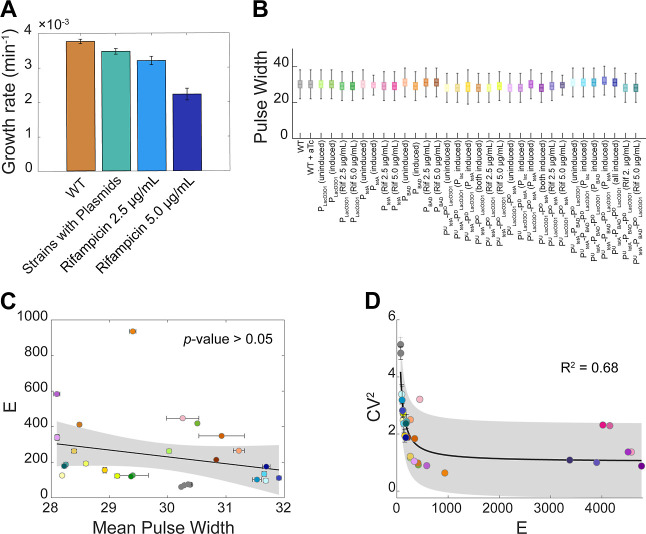
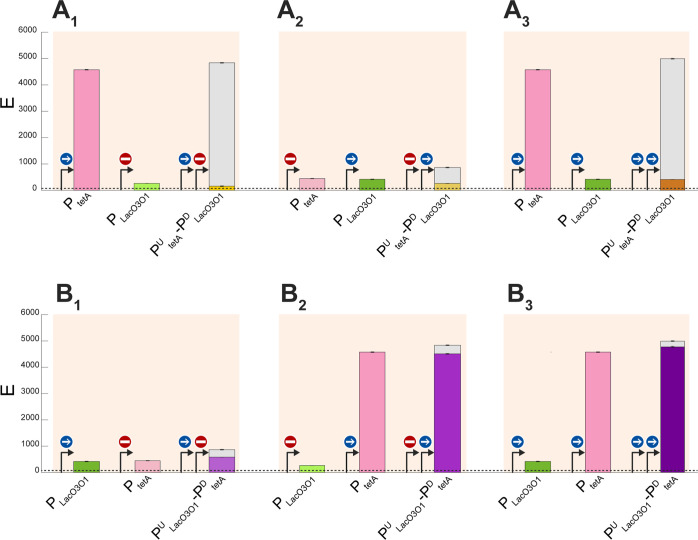
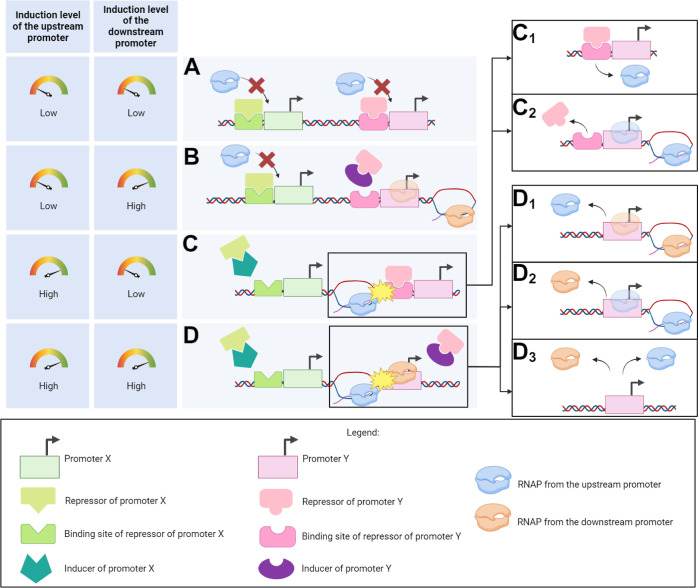
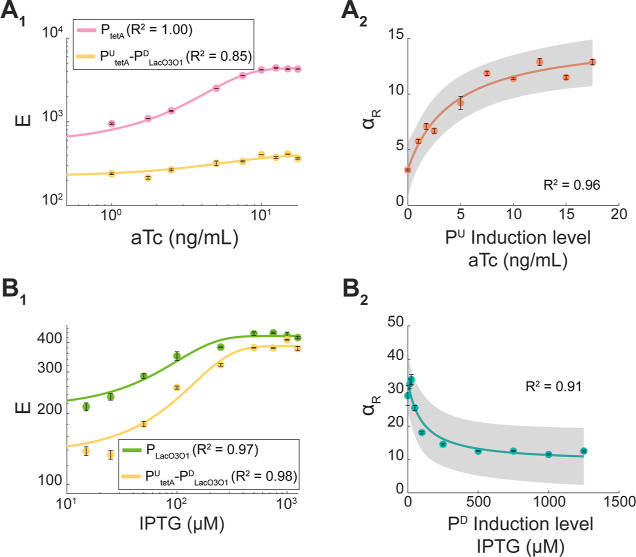
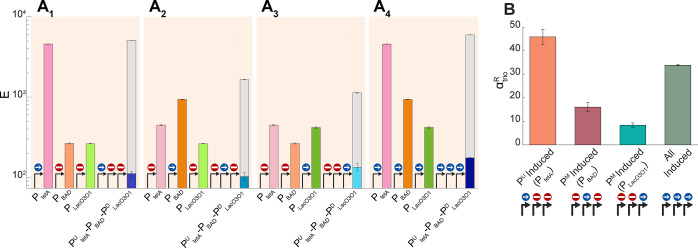
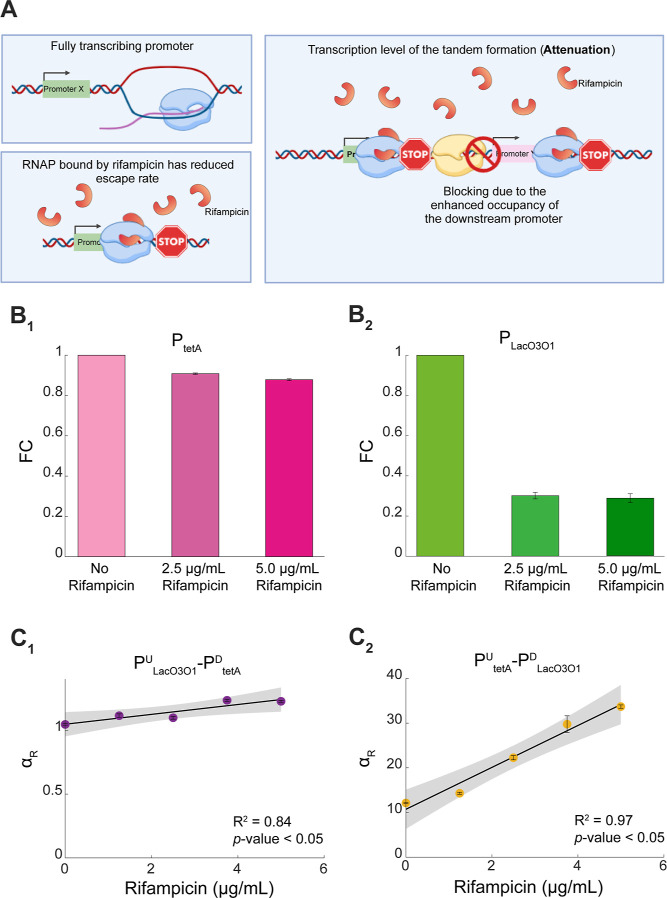
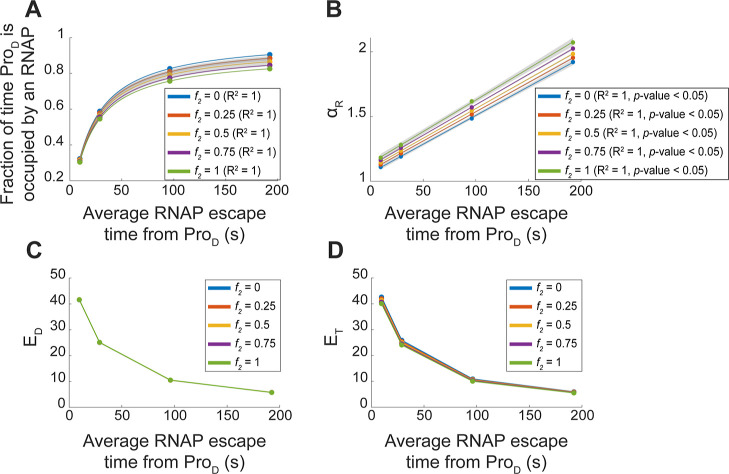
Closely spaced promoters are ubiquitous in prokaryotic and eukaryotic genomes. How their structure and dynamics relate remains unclear, particularly for tandem formations. To study their transcriptional interference, we engineered two pairs and one trio of synthetic promoters in nonoverlapping, tandem formation, in single-copy plasmids transformed into Escherichia coli cells. From in vivo measurements, we found that these promoters in tandem formation can have attenuated transcription rates. The attenuation strength can be widely fine-tuned by the promoters' positioning, natural regulatory mechanisms, and other factors, including the antibiotic rifampicin, which is known to hamper RNAP promoter escape. From this, and supported by in silico models, we concluded that the attenuation in these constructs emerges from premature terminations generated by collisions between RNAPs elongating from upstream promoters and RNAPs occupying downstream promoters. Moreover, we found that these collisions can cause one or both RNAPs to falloff. Finally, the broad spectrum of possible, externally regulated, attenuation strengths observed in our synthetic tandem promoters suggests that they could become useful as externally controllable regulators of future synthetic circuits.


Conflict of interest statement

The authors declare no competing financial interest.

Figures

Figure 1
Figure 1
Schematic representation of the synthetic promoters in tandem formation along with their transcription factor binding sites. Bioparts (A1–A6) were each inserted into single-copy pBAC plasmids. Each biopart is followed by an mCherry coding region. Bioparts (A1,A2,A3) are the individual promoter constructs. Bioparts (A4,A5,A6) are the constructs with (pairs or trios of) tandem promoters. The component promoters in individual formation are PtetA, PLacO3O1, and PBAD. The two dual synthetic promoters in tandem formation are PLacO3O1U-PtetAD and PtetAU-PLacO3O1D, (U and D stand for upstream and downstream, respectively). Finally, the trio of promoters in tandem formation is PtetAU-PBAD-PLacO3O1D.
Figure 2
Figure 2
(A) Average growth rates (O.D.600 measurements by spectrophotometry). (B) Boxplots of the distributions of single-cell pulse width, used as a proxy for cell size. The outliers (values higher or lower than 1.5·IQR, where IQR is the interquartile range) are not shown. (C) Scatter plot of the mean single-cell fluorescence, E, and the mean pulse width. Also shown are the best-fitting line and corresponding p-value, after excluding outliers (not shown) (Methods Section” Fitting and statistical analysis”). The correlation is not significant at the 5% significance level, even when including outliers (Figure S2). (D) Scatter plot between the CV2 and the mean single-cell fluorescence intensities (E). Also shown are the best-fitting curve and the corresponding R2 (Methods Section “Fitting and statistical analysis”). The shaded area represents the 95% confidence interval. Also shown is a best (black line) fitting curve, whose equation and coefficient values are shown in Table S4p. Finally, the error bars in (A,C,D) correspond to the standard error of the mean of 3 biological replicates.
Figure 3
Figure 3
Mean expression intensity (E) of the tandem and the individual promoters, under various induction schemes. The blue sign with a straight white arrow stands for “fully induced”, while the red “Do Not Enter” sign stands for “fully repressed” in (A1–A3) PtetA, PLacO3O1, and PtetAU-PLacO3O1D and (B1–B3) PtetA, PLacO3O1, and PLacO3O1D-PtetAU. In all plots, the height of the gray bars is a measure of the interactivity, as quantified by α defined in eq 3. The error bars correspond to the standard error of the mean of three biological replicates. The dashed horizontal line near 0 marks the autofluorescence intensity of WT cells. The expression levels of the individual promoters, PtetA and PLacO3O1, are shown more than once to facilitate comparing the tandem constructs with the component promoters in individual formation.
Figure 4
Figure 4
Illustration of transcription interference events generating attenuation in tandem promoters under different induction schemes. (A) Weak-to-no induction of both the upstream and the downstream promoters. (B) Weak-to-no induction of the upstream promoter along with high induction pf the downstream promoter. (C) High induction of the upstream promoter and weak-to-no induction of the downstream promoter. (D) High induction of both the upstream and downstream promoters. In (C), collisions between RNAPs elongating from the upstream promoter and the repressor at the downstream promoter are likely to occur. Those collisions can cause (C1) falloff of the elongating RNAP or (C2) falloff of the repressor bound to the operator site. Similarly, in (D), the RNAP elongating from the upstream promoter can collide with the RNAP occupying the downstream promoter. This causes the elongating RNAP to falloff in (D1), the RNAP at the downstream promoter to falloff in (D2), or both RNAPs to falloff in (D3).
Figure 5
Figure 5
(A1) Mean single-cell expression level (E) of PtetA and of PtetAU-PLacO3O1D, when inducing PtetA. In all conditions, PLacO3O1D is fully induced. (A2) Interactivity leading to attenuation (i.e., αR > 1) of the tandem promoters as a function of the induction strength of the upstream promoter. (B1) Mean single-cell expression level (E) of PLacO3O1 and of PtetAU-PLacO3O1D, when inducing PLacO3O1. In all conditions, PtetAU is fully induced. (B2) Interactivity leading to attenuation (i.e., αR > 1) of the tandem promoters as a function of the induction strength of the downstream promoter. In all plots, the error bars correspond to the standard error mean of three biological replicates. Also shown are best fitting curves and the corresponding R2 (Methods Section” Fitting and statistical analysis”). The shaded areas represent the 95% confidence intervals. The equation and coefficient values of the fitted curve are shown in Table S4. Note that the axes of (B1) and (A1) are in logarithmic scale. All fitting curves and best fitting parameter values are shown in Table S4. Data points of the induction curves in (A1) and (B1) were, as expected, well fitted by logistic functions. Meanwhile, the data points in (A2,B2) are well-fitted by rational curves.
Figure 6
Figure 6
(A1–A4) Mean expression intensities (E, in logarithmic scale) of the trio tandem promoters (PtetAU–PBAD-PLacO1O3D) and of each individual promoter. We tested inducing only the most upstream promoter (A1), inducing only the middle promoter (A2), inducing only the most downstream promoter (A3), and inducing all promoters at the same time (A4). The gray bars measure the interactivity as quantified by, αtrio, defined in eq 5. (B) Interactivity, as quantified by αtrioR (eq 5) of the trio of tandem promoters under various induction schemes. In all plots, error bars correspond to the standard error of the mean of 3 biological replicates.
Figure 7
Figure 7
Effects of rifampicin on the interactivity in tandem promoters. (A) Illustration of how rifampicin reduces the activity of an individual promoter, as well as of promoters in tandem formation. The latter should be further affected by enhanced attenuation. (B1–B2) Fold-change in mean expression levels (FC) of PtetA and PLacO3O1 due to rifampicin. (C1–C2) αR of PtetAU-PLacO3O1D and PLacO3O1U-PtetAD, when subject to rifampicin. The error bars correspond to the standard error of the mean of three biological replicates. Shown are the best-fitting lines and their p-value and R2 (Methods Section “Fitting and Statistical Analysis”). The shaded areas represent the 95% confidence interval. The equation and coefficient values of the fitted lines are shown in Table S4.
Figure 8
Figure 8
Estimations using the stochastic models of the effects of increasing the average time for RNAPs to escape the downstream promoter (ProD), by decreasing kescD, as well as of changing the frequency with which RNAP collisions cause both RNAPs to falloff, instead of only one falling-off. (A) Fraction of time that the downstream promoter is occupied by an RNAP as a function of the inverse of the RNAP escape rate. Note that the latter is affected also by collisions between RNAPs. (B) Interactivity as measured by αR in tandem promoters as a function of the average RNAP escape times from downstream promoters. (C,D) Expression levels of the individual downstream promoter (EDind) and of the tandem promoters (ET) as a function of the average RNAP escape times from the downstream promoter. In all plots, each colored line represents a different relative frequency (f2) of both RNAPs falling-off upon colliding (as opposed to only one RNAP falling-off). (A,B) also show the best fitting functions along with their R2 values (and p-values in case of linear fits) (Methods Section” Fitting and statistical analysis”). The shaded areas represent the 95% confidence intervals. The equation and coefficient values of the fitted lines are shown in Table S4.

Similar articles

Cited by

References

    1. Adachi N.; Lieber M. R. Bidirectional Gene Organization: A Common Architectural Feature of the Human Genome. Cell 2002, 109, 807–809. 10.1016/S0092-8674(02)00758-4. - DOI - PubMed
    1. Trinklein N. D.; Aldred S. F.; Hartman S. J.; Schroeder D. I.; Otillar R. P.; Myers R. M. An abundance of bidirectional promoters in the human genome. Genome Res. 2004, 14, 62–66. 10.1101/gr.1982804. - DOI - PMC - PubMed
    1. Herbert M.; Kolb A.; Buc H. Overlapping promoters and their control in Escherichia coli: the gal case. Proc. Natl. Acad. Sci. U.S.A. 1986, 83, 2807–2811. 10.1073/pnas.83.9.2807. - DOI - PMC - PubMed
    1. Bendtsen K. M.; Erdossy J.; Csiszovszki Z.; Svenningsen S. L.; Sneppen K.; Krishna S.; Semsey S. Direct and indirect effects in the regulation of overlapping promoters. Nucleic Acids Res. 2011, 39, 6879–6885. 10.1093/nar/gkr390. - DOI - PMC - PubMed
    1. Beck C. F.; Warren R. A. Divergent promoters, a common form of gene organization. Microbiol. Rev. 1988, 52, 318–326. 10.1128/mr.52.3.318-326.1988. - DOI - PMC - PubMed

Publication types

MeSH terms

Substances

LinkOut - more resources