. 2024 Aug 20;137(16):1939-1949.
doi: 10.1097/CM9.0000000000003162. Epub 2024 Jul 12.

Artificial intelligence system for outcome evaluations of human in vitro fertilization-derived embryos

Affiliations

Artificial intelligence system for outcome evaluations of human in vitro fertilization-derived embryos

Ling Sun et al. Chin Med J (Engl). .

Abstract

Background: In vitro fertilization (IVF) has emerged as a transformative solution for infertility. However, achieving favorable live-birth outcomes remains challenging. Current clinical IVF practices in IVF involve the collection of heterogeneous embryo data through diverse methods, including static images and temporal videos. However, traditional embryo selection methods, primarily reliant on visual inspection of morphology, exhibit variability and are contingent on the experience of practitioners. Therefore, an automated system that can evaluate heterogeneous embryo data to predict the final outcomes of live births is highly desirable.

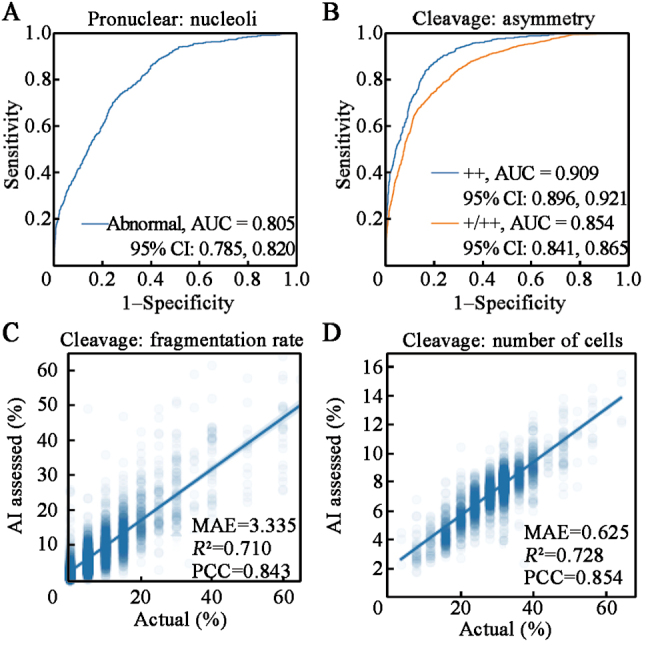
Methods: We employed artificial intelligence (AI) for embryo morphological grading, blastocyst embryo selection, aneuploidy prediction, and final live-birth outcome prediction. We developed and validated the AI models using multitask learning for embryo morphological assessment, including pronucleus type on day 1 and the number of blastomeres, asymmetry, and fragmentation of blastomeres on day 3, using 19,201 embryo photographs from 8271 patients. A neural network was trained on embryo and clinical metadata to identify good-quality embryos for implantation on day 3 or day 5, and predict live-birth outcomes. Additionally, a 3D convolutional neural network was trained on 418 time-lapse videos of preimplantation genetic testing (PGT)-based ploidy outcomes for the prediction of aneuploidy and consequent live-birth outcomes.

Results: These two approaches enabled us to automatically assess the implantation potential. By combining embryo and maternal metrics in an ensemble AI model, we evaluated live-birth outcomes in a prospective cohort that achieved higher accuracy than experienced embryologists (46.1% vs. 30.7% on day 3, 55.0% vs. 40.7% on day 5). Our results demonstrate the potential for AI-based selection of embryos based on characteristics beyond the observational abilities of human clinicians (area under the curve: 0.769, 95% confidence interval: 0.709-0.820). These findings could potentially provide a noninvasive, high-throughput, and low-cost screening tool to facilitate embryo selection and achieve better outcomes.

Conclusions: Our study underscores the AI model's ability to provide interpretable evidence for clinicians in assisted reproduction, highlighting its potential as a noninvasive, efficient, and cost-effective tool for improved embryo selection and enhanced IVF outcomes. The convergence of cutting-edge technology and reproductive medicine has opened new avenues for addressing infertility challenges and optimizing IVF success rates.


Conflict of interest statement

None.

Figures

Figure 1
Figure 1
Schematic illustration of the general artificial intelligence (AI) platform for embryo assessment and live-birth occurrence prediction during the whole in vitro fertilization (IVF) circle. The left panel: The AI models utilized images of human embryos captured at 17 ± 1 hours post-insemination (hpi, Day 1) or 68 ± 1 hpi (Day 3). Clinical metadata (e.g., maternal age, body mass index) are also included. The middle and right panel: An illustration of the explainable deep-learning system for embryo assessment during the whole IVF circle. The system consisted of four modules. The middle panel: a module for grading embryo morphological features using multitask learning; a module for blastocyst formation prediction using Day 1/Day 3 images with noisy-OR inference. The right panel: a module for predicting embryo ploidy (euploid vs. aneuploid) using embryo images or time-lapse videos; a final module for the live-birth occurrence prediction using images and clinical metadata. The models were tested on independent cohorts to ensure the generalizability. We also studied the AI versus embryologist comparison performance.
Figure 2
Figure 2
Performance in the evaluation of embryos’ morphokinetic features using the AI system. ROC curve showing performance of detecting abnormal pronucleus type of the Day 1 embryo (A). Morphological assessment of the Day 3 embryos (B–D). ROC curves showing performance of detecting blastomere asymmetry (B). The orange line represents detecting asymmetry (++ or +) from normal (–). The blue line represents detecting severe asymmetry (++) from good one (–). Correlation analysis of the predicted embryo fragmentation rate versus the actual embryo fragmentation rate (C). Correlation analysis of the predicted blastomere cell number versus the actual blastomere cell number (D). AI: Artificial intelligence; MAE: Mean absolute error; R2: Coefficient of determination; ROC: Receiver operating characteristic; PCC: Pearson’s correlation coefficient.
Figure 3
Figure 3
Performance in predicting the development to the blastocyst stage using the AI system. ROC curves showing performance of selecting embryos that developed to the blastocyst stage. The blue, orange, and green lines represent using images from Day 1, Day 3 and combined Day 1 & Day 3, respectively (A). Comparison of predicted fragmentation (B) and probability of asymmetry (C) between the Develop to Blastocyst and Fail to Blastocyst groups. Box plots showed median, upper quartile and lower quartile (by the box) and the upper adjacent and lower adjacent values (by the whiskers). Visualization for embryos’ morphokinetic characteristics that developed to the blastocyst stage or not at 40x magnification (D). In the upper-left corner, the embryo image depicts successful development into the blastocyst stage, showcasing excellent symmetry, minimal fragmentation, and the presence of 8 cells. Conversely, the remaining three embryos failed to progress to the blastocyst stage. The embryo in the upper-right exhibits cellular asymmetry, while the one in the lower-left displays a high fragmentation rate. Additionally, the embryo in the lower-right shows a considerable disparity from the expected 8-cell count. Comparison of predicted Fragmentation (B) and Probability of Asymmetry (C) between the Develop to Blastocyst and Fail to Blastocyst groups. AI: Artificial intelligence; AUC: Area under the curve; ROC: Receiver operating characteristic.
Figure 4
Figure 4
Performance of our AI system in identifying blastocyst ploidy (euploid/aneuploid). The ROC curves for a binary classification using the clinical metadata-only model, the embryo image-only model and the combined model. PGT-A test results are available (A). The ROC curves for a binary classification using the clinical metadata-only model, the embryo video-only model and the combined model. The videos of embryo development is captured using time-lapse (B). Illustration of features contributing to progression to euploid blastocysts by SHAP values. Features on the right of the risk explanation bar pushed the risk higher and features on the left pushed the risk lower (C). Performance comparison between our AI model and eight practicing embryologists in embryos’ euploid ranking. The euploid rate of blastocysts selected for PGT-A test by AI versus average embryologists on different filtering rate scenarios. The baseline euploid rate was 46.1% (D). AI: Artificial intelligence; AMH: Anti-Müllerian hormone; AUC: Area under the curve; BMI: Body mass index; FSH: Follicle-stimulating hormone; PGT-A: Preimplantation genetic testing for aneuploidy; ROC: Receiver operating characteristic; SHAP: Shapley additive explanation.
Figure 5
Figure 5
Performance in predicting live‑birth occurrence of the AI models. ROC curves showing performance on live‑birth occurrence prediction on internal test set (A) and external validation cohort (B). The green, orange and blue ROC curves represent using the metadata-only model, the embryo image-only model and the combined model. Illustration of features contributing to progression to live‑birth occurrence by SHAP values. Pink features pushed the risk higher (to the right) and blue features pushed the risk lower (to the left) (C). Comparison of our AI system with the PGT-A assisted approach for live-birth occurrence (D, E). The live birth rate by the AI system is associated with the proportion of embryos be selected for transfer. The orange line represents transplant on Day 3. The blue line represents transplant on Day 5/6 (D). Illustration of the baseline rate by Kamath et al, baseline rate on our external validation set 2, the PGT-A assisted live-birth rate and the AI-assisted live-birth rate. PGT-A was only performed for Day 5/6 transplant (E). AI: Artificial intelligence; AMH: Anti-Müllerian hormone; AUC: Area under the curve; BMI: Body mass index; FSH: Follicle-stimulating hormone; PGT-A: Preimplantation genetic testing for aneuploidy; ROC: Receiver operating characteristic; SHAP: Shapley additive explanation.
Figure 6
Figure 6
Visualization of evidence for embryo morphological assessment at 40x magnification using integrated gradients method. Left: The original embryo images; Right: Explanation method generated saliency heatmaps. (A) Normal pronuclear type of Day1 (good one); (B) blastomere symmetry of Day3 (good one); (C) fragmentation rate of Day3 embryo (normal); (D) Day3 blastomere cell number (normal); (E) Day 1 embryo failed to develop to the blastocyst stage; (F) Day 3 embryo failed to develop to the blastocyst stage.

Similar articles

Cited by

References

    1. Graham ME, Jelin A, Hoon AH, Jr, Wilms Floet AM, Levey E, Graham EM. Assisted reproductive technology: Short- and long-term outcomes. Dev Med Child Neurol 2023;65:38–49. doi: 10.1111/dmcn.15332. - PMC - PubMed
    1. Baxter Bendus AE, Mayer JF, Shipley SK, Catherino WH. Interobserver and intraobserver variation in day 3 embryo grading. Fertil Steril 2006;86:1608–1615. doi: 10.1016/j.fertnstert.2006.05.037. - PubMed
    1. Paternot G, Devroe J, Debrock S, D’Hooghe TM, Spiessens C. Intra- and inter-observer analysis in the morphological assessment of early-stage embryos. Reprod Biol Endocrinol 2009;7:105. doi: 10.1186/1477-7827-7-105. - PMC - PubMed
    1. Storr A, Venetis CA, Cooke S, Kilani S, Ledger W. Inter-observer and intra-observer agreement between embryologists during selection of a single Day 5 embryo for transfer: a multicenter study. Hum Reprod 2017;32:307–314. doi: 10.1093/humrep/dew330. - PubMed
    1. Rocha JC Passalia FJ Matos FD Takahashi MB Maserati MP Jr Alves MF, et al. . Automatized image processing of bovine blastocysts produced in vitro for quantitative variable determination. Sci Data 2017;4:170192. doi: 10.1038/sdata.2017.192. - PMC - PubMed

LinkOut - more resources