. 2024 Jul 12;15(1):5859.
doi: 10.1038/s41467-024-49905-7.

KAP1 negatively regulates RNA polymerase II elongation kinetics to activate signal-induced transcription

Affiliations

KAP1 negatively regulates RNA polymerase II elongation kinetics to activate signal-induced transcription

Usman Hyder et al. Nat Commun. .

Abstract

Signal-induced transcriptional programs regulate critical biological processes through the precise spatiotemporal activation of Immediate Early Genes (IEGs); however, the mechanisms of transcription induction remain poorly understood. By combining an acute depletion system with several genomics approaches to interrogate synchronized, temporal transcription, we reveal that KAP1/TRIM28 is a first responder that fulfills the temporal and heightened transcriptional demand of IEGs. Acute KAP1 loss triggers an increase in RNA polymerase II elongation kinetics during early stimulation time points. This elongation defect derails the normal progression through the transcriptional cycle during late stimulation time points, ultimately leading to decreased recruitment of the transcription apparatus for re-initiation thereby dampening IEGs transcriptional output. Collectively, KAP1 plays a counterintuitive role by negatively regulating transcription elongation to support full activation across multiple transcription cycles of genes critical for cell physiology and organismal functions.


Conflict of interest statement

The authors declare no competing interests.

Figures
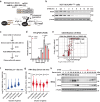
Fig. 1
Fig. 1. KAP1 is a positive regulator of serum-induced transcription.
a Scheme showing dTAG strategy targeting the C-terminus of KAP1 with the dTAG cassette. FKBP-V: degron; 2xHA: two tandem HA tags; P2A: 2A peptide sequence; Puro: Puromycin resistance cassette; BSD: Blasticidin resistance cassette. b Western blot showing dTAG-mediated KAP1 degradation kinetics in HCT116 KAP1dTAG cells. Blots are representative of two independent experiments. c Scheme showing the experimental design alongside the cell treatments. d RT-qPCR assay highlighting gene expression of one representative IEG (FOS) in DMSO- and dTAG-treated cells during a serum stimulation time course. Data represent mean ± SEM (n = 3 biological replicates, two-sided Student’s t-test comparing DMSO to dTAG at each of the indicated time points). P-values are indicated. Black: DMSO, red: dTAG. e RNA-Seq volcano plot identifying IEGs as upregulated genes upon 30 min of serum stimulation (n = 3 biological replicates, two-sided Likelihood Ratio Test using the Benjamini–Hochberg (BH) multiple comparisons adjustment, false discovery rate [FDR] <0.05). Dots marked red were identified as differentially expressed. f Violin plot showing upregulation of IEGs organized by induction of expression: 2-fold IEGs (n = 236), 4-fold IEGs (n = 69), 8-fold IEGs (n = 34), and 16-fold IEGs (n = 16). Random (n = 236) denotes random genes selected from non-DE genes (n = 10,361). Data represents the Log2FC value computed from RNA-Seq analysis between the DMSO-S0 and DMSO-S30 condition (generated from 3 biological replicates). The n number represents the number of genes in each cluster plotted. The median is denoted as a dashed black line. g Violin plot showing downregulation of IEGs upon acute KAP1 depletion organized by induction of expression: 2-fold IEGs (n = 236), 4-fold IEGs (n = 69), 8-fold IEGs (n = 34), and 16-fold IEGs (n = 16). Random (n = 236) denotes random genes selected from non-DE genes (n = 10,361). Data represents the Log2FC value computed from RNA-Seq analysis between the DMSO-S30 and dTAG-S30 conditions (generated from 3 biological replicates). The n number represents the number of genes in each cluster plotted. Median % changes in expression are listed above the violin in each IEGs cluster and Random non-DE genes. The median is also denoted as a dashed black line. h Western blot showing protein expression of two representative IEGs (c-Fos and ATF3) during a serum time course ± dTAG treatment. Blots are representative of three independent experiments. Source data are provided as a Source Data file.
Fig. 2
Fig. 2. KAP1 localizes to the gene bodies and 3′ ends of IEGs upon serum stimulation.
a HA (KAP1) ChIP-Seq metagene analysis at 16-fold IEGs in the three indicated conditions. See legend for sample identification. b HA (KAP1) ChIP-Seq browser track of FOS in the four indicated conditions. See legend for sample identification. c, d HA ChIP-Seq quantitation of KAP1 density at 4-fold IEGs (n = 69) and 16-fold IEGs (n = 16) at c PP regions and d GB regions. Data represents the Log2FC value for the respective sample (see X-axis) normalized to serum 0 min in DMSO-treated cells using ChIP-Seq signal from 2 biological replicates. The n number represents the number of genes in each cluster plotted. The Tukey plots indicate the median (black center line), the first and third quartiles (edges of the box), and the 1.5× interquartile range below and above the box as whiskers. Dots are presented as genes with normalized signals beyond these defined ranges. Statistics were calculated between the dTAG plus serum treatment condition and the respective condition shown on the Tukey plot. Two-sided Wilcoxon signed-rank test. P-values are indicated. e HA (KAP1) ChIP-Seq metagene analysis of all genome-wide KAP1 peaks (n = 12,665) in the three indicated conditions. See legend for sample identification. f HA (KAP1) ChIP-Seq browser track at the SFPQ locus in the four indicated conditions. See legend for sample identification. Source data are provided as a Source Data file.
Fig. 3
Fig. 3. KAP1 regulates Pol II occupancy during serum stimulation.
a, b Pol II ChIP-Seq metagene at 16-fold IEGs showing occupancy of Pol II at: a 15 min (with zoomed-in profile to show differences) and b 30 min serum stimulation time points. See legend for sample identification. c-e Pol II ChIP-Seq quantitation of Pol II density at 4-fold IEGs (n = 69) and 16-fold IEGs (n = 16) at: c PP regions, d GB regions, and e 3′ ends. Data represents the Log2FC value for dTAG versus DMSO at the respective serum time point (see X-axis) using ChIP-Seq signal from 2 biological replicates. The n number represents the number of genes in each cluster plotted. The Tukey plots indicate the median (black center line), the first and third quartiles (edges of the box), and the 1.5× interquartile range below and above the box as whiskers. Dots are presented as genes with normalized signals beyond these defined ranges. Statistics were calculated between the Log2FC values between the early (15 min) and late (30 min) time points shown on the Tukey plot. Two-sided Wilcoxon signed-rank test. P-values are indicated in the figure. f, g Pol II and HA ChIP-Seq browser track in multiple conditions. See legend for sample identification at the: f NR4A1 locus and g ATF3 locus. The arrow indicates the polyadenylation (pA) site. Source data are provided as a Source Data file.
Fig. 4
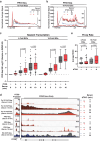
Fig. 4. Acute KAP1 depletion leads to increased elongation kinetics at early serum stimulation.
a, b PRO-Seq metagene profile at 16-fold IEGs showing active Pol II density at the: a 5 min (with zoomed-in profile to show differences) and b 10 min serum stimulation time points. See legend for sample identification. c PRO-Seq quantitation of nascent transcription (GB density) for 4-fold IEGs (n = 69) and 16-fold IEGs (n = 16). Data represents the Log2FC value for the respective sample (see X-axis) normalized to serum 0 min in DMSO-treated cells using PRO-Seq signal from 2 biological replicates. The n number represents the number of genes in each cluster plotted. The Tukey plots indicate the median (black center line), the first and third quartiles (edges of the box), and the 1.5× interquartile range below and above the box as whiskers. Dots are presented as genes with normalized signals beyond these defined ranges. Statistics were calculated between the indicated samples in the plot (dTAG vs. DMSO at both 5 and 10 min serum time points). Two-sided Wilcoxon signed-rank test. P-values are indicated. d Pol II ChIP-Seq, PRO-Seq, and HA ChIP-Seq browser track in multiple conditions at the FOSB locus. See legend for sample identification. e Rate of Change in Coverage (ROCC) calculation (Proxy Rate) for 4-fold IEGs (n = 69) and 16-fold IEGs (n = 16) computed through the serum stimulation time course. Data represents the absolute average ROCC values for the respective sample (see X-axis) using PRO-Seq data from 2 biological replicates. The n number represents the number of genes in each cluster plotted. The Tukey plots indicate the median (black center line), the first and third quartiles (edges of the box), and the 1.5× interquartile range below and above the box as whiskers. Dots are presented as genes with normalized signals beyond these defined ranges. Statistics were calculated between the indicated samples in the plot (dTAG vs. DMSO) with a two-sided Wilcoxon signed-rank test. P-values are indicated.
Fig. 5
Fig. 5. Acute KAP1 depletion leads to decreased occupancy of regulators of transcription elongation and initiation at late serum stimulation.
ac ChIP-Seq metagene profile of a SPT5, b CDK9, and c CDK7 at 16-fold IEGs in the three indicated conditions. See legend for sample identification. df ChIP-Seq quantitation of d SPT5, e CDK9, and f CDK7 in PP regions of 4-fold IEGs (n = 69) and 16-fold IEGs (n = 16). Data represents the Log2FC value for the respective sample (see X-axis) normalized to serum 0 min in DMSO-treated cells using ChIP-Seq signal from 1 biological replicate. The n number represents the number of genes in each cluster plotted. The Tukey plots indicate the median (black center line), the first and third quartiles (edges of the box), and the 1.5× interquartile range below and above the box as whiskers. Dots are presented as genes with normalized signals beyond these defined ranges. g, h ChIP-Seq browser tracks of all factors in the three indicated conditions. See legend for sample identification at the g FOS locus and h ATF3 locus. Source data are provided as a Source Data file.
Fig. 6
Fig. 6. KAP1 facilitates signal-induced transcription activation by negatively regulating Pol II elongation kinetics.
a Model of KAP1 facilitating signal-induced transcription by negatively regulating Pol II elongation kinetics during early stimulation to allow for the timely transition of elongation to termination and normal re-initiation events (including recruitment of the transcription apparatus to the promoter) during late stimulation. b KAP1 depletion increases Pol II elongation kinetics during early stimulation, consequently leading to defects in the recruitment of the transcription apparatus to the promoter during late stimulation thereby reducing IEGs expression.

Update of

Similar articles

Cited by

References

    1. Bentley DL. Rules of engagement: co-transcriptional recruitment of pre-mRNA processing factors. Curr. Opin. Cell Biol. 2005;17:251–256. doi: 10.1016/j.ceb.2005.04.006. - DOI - PubMed
    1. Roeder RG. 50+ years of eukaryotic transcription: an expanding universe of factors and mechanisms. Nat. Struct. Mol. Biol. 2019;26:783–791. doi: 10.1038/s41594-019-0287-x. - DOI - PMC - PubMed
    1. Cramer P. Organization and regulation of gene transcription. Nature. 2019;573:45–54. doi: 10.1038/s41586-019-1517-4. - DOI - PubMed
    1. Lemon B, Tjian R. Orchestrated response: a symphony of transcription factors for gene control. Genes Dev. 2000;14:2551–2569. doi: 10.1101/gad.831000. - DOI - PubMed
    1. Mellor J. The dynamics of chromatin remodeling at promoters. Mol. Cell. 2005;19:147–157. doi: 10.1016/j.molcel.2005.06.023. - DOI - PubMed

Substances