. 2024 Jul 13;15(1):5877.
doi: 10.1038/s41467-024-50229-9.

Stress-induced nuclear translocation of ONAC023 improves drought and heat tolerance through multiple processes in rice

Affiliations

Stress-induced nuclear translocation of ONAC023 improves drought and heat tolerance through multiple processes in rice

Yu Chang et al. Nat Commun. .

Abstract

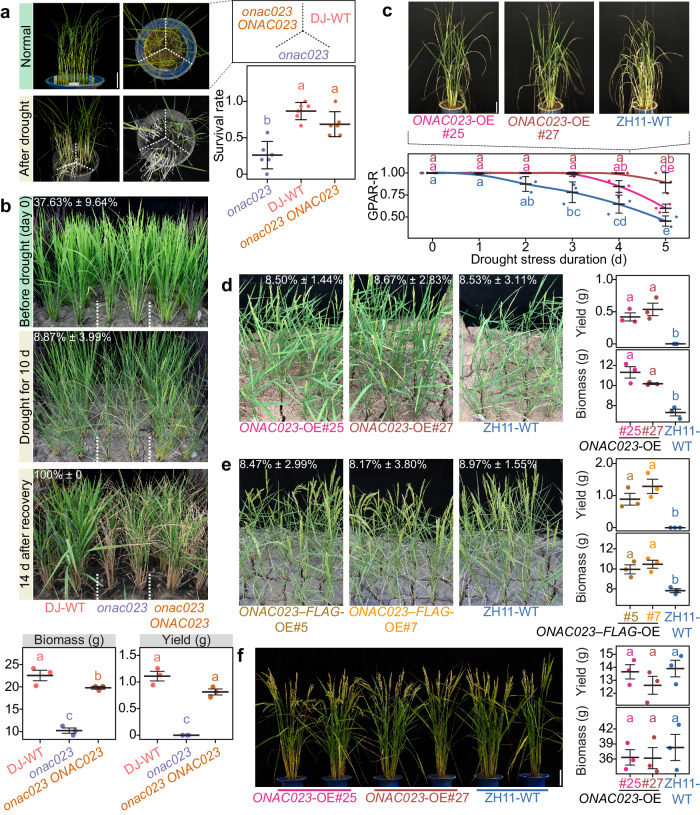
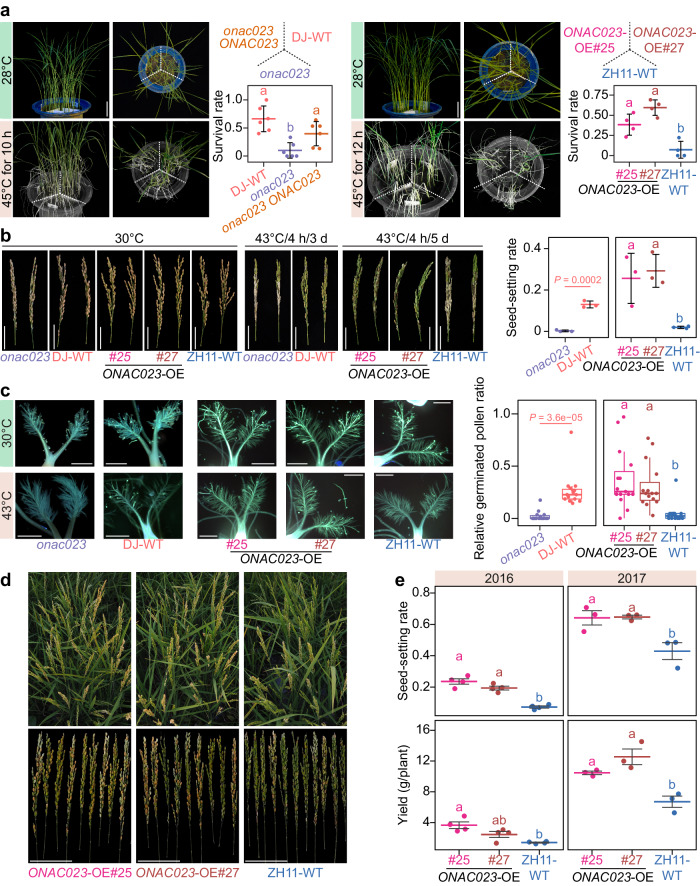
Drought and heat are major abiotic stresses frequently coinciding to threaten rice production. Despite hundreds of stress-related genes being identified, only a few have been confirmed to confer resistance to multiple stresses in crops. Here we report ONAC023, a hub stress regulator that integrates the regulations of both drought and heat tolerance in rice. ONAC023 positively regulates drought and heat tolerance at both seedling and reproductive stages. Notably, the functioning of ONAC023 is obliterated without stress treatment and can be triggered by drought and heat stresses at two layers. The expression of ONAC023 is induced in response to stress stimuli. We show that overexpressed ONAC23 is translocated to the nucleus under stress and evidence from protoplasts suggests that the dephosphorylation of the remorin protein OSREM1.5 can promote this translocation. Under drought or heat stress, the nuclear ONAC023 can target and promote the expression of diverse genes, such as OsPIP2;7, PGL3, OsFKBP20-1b, and OsSF3B1, which are involved in various processes including water transport, reactive oxygen species homeostasis, and alternative splicing. These results manifest that ONAC023 is fine-tuned to positively regulate drought and heat tolerance through the integration of multiple stress-responsive processes. Our findings provide not only an underlying connection between drought and heat responses, but also a promising candidate for engineering multi-stress-resilient rice.


Conflict of interest statement

The authors declare no competing interests.

Figures

Fig. 1
Fig. 1. Integrative analysis of rice NAC genes with potential functions in stress tolerance.
a Overview of the selection work flow applied to rice NAC genes. b NAC-centered regulator network in response to drought and heat stresses. Each edge represents a proposed NAC–target relation. ICA clusters are denoted by different colors. The hub NACs are labeled. c Association analysis of ONAC023 with GPAR-R. The Manhattan plot illustrates the power of associations between genetic variations and GPAR-R (in terms of the F test P values). The triangle heatmap shows the LD. The ONAC023 promoter activities with/without the insertion of vg2402578 (termed as InDel+ and InDel) evaluated by dual-LUC assay were expressed as the relative fluorescence intensity of fLUC/rLUC, and all values were normalized against that of the blank construct. d Significant difference in the GPAR-R between the InDel+ and InDel variety groups. e ONAC023 expression among the 98 tested rice varieties under drought stress. The mean RT–qPCR −∆Ct values (determined by three plants for each variety) were normalized as Z-scores. The lower, central, and upper hinges of the box plots in (d, e) correspond to the 25th, 50th (median), and 75th percentiles, respectively. The whiskers extend from the hinges to the largest/smallest values no further than 1.5× IQR (inter-quartile range) from the hinges. f ONAC023 expression in ZH11 under drought and heat stress treatments. The expression of ONAC023 was normalized to that of the corresponding mock samples. The curves indicate the smoothed conditional means by LOESS regression. The significance levels of the treated samples were labeled at the upper side, while those of the mocks were labeled (in gray) at the bottom of each panel. The cross-bars in (c, f) represent mean ± SD (standard deviation). Letter symbols denote significances (P < 0.05) determined by one-way ANOVA (two-sided) with Tukey’s Honest significant difference (HSD) test. Exact P values and details of the one-way ANOVA–HSD test can be found in the Source Data file. P values in (d, e) were determined by two-tailed Student’s t test. Source data are provided as a Source Data file.
Fig. 2
Fig. 2. ONAC023 confers drought tolerance in rice.
a Phenotypes of the T-DNA insertion mutant onac023, the derived negative control (DJ-WT), and the complementation (onac023 ONAC023) seedlings after 7-d recovery from the drought stress treatment (RSM < 10% for 7 d). One representative photo (out of six buckets under independent treatments) is shown. Green tissues after recovery were highlighted. See Supplementary Fig. 3a for the raw photos. Scale bar = 5 cm. Cross-bars represent mean ± SEM (standard error of the means). b Phenotypes of one of the three blocks of onac023, DJ-WT, and onac023 ONAC023 during the in-field drought stress at the booting stage. The top-left white number in each photo indicates RSM (mean ± SD, n = 3). The biomass and yield (per plant) data is presented as mean ± SEM in the bottom cross-bar plots. c Phenotypes of the ONAC023-OE lines under drought stress. Plants were monitored every day by the phenotyping platform starting from the day 4 after drought stress initiation (day 0 in the X-axis). Scale bar = 10 cm. Cross-bars denote mean ± SD of three plants with independent treatments. The curves indicate the smoothed conditional means by LOESS regression. d, e In-field drought tolerance evaluation of the ONAC023 overexpressors. Phenotype of one repeat under drought stress is shown for each transgenic line. RSM is labeled as mean ± SD. The plots on the right show the statistics on the biomass and yield (per plant) of the tested lines. Cross-bars denote mean ± SEM of the three randomized blocks. f Agronomic traits of the ONAC023 overexpressors grown under normal growth conditions at the ripening stage. Scale bar = 10 cm. The cross-bar plot shows the mean ± SEM of yield (per plant) and biomass based on three randomized blocks (at least six plants each). Significances (P < 0.05) in this figure were determined by one-way ANOVA–HSD test (two sided). Exact P values and details of the one-way ANOVA–HSD test can be found in the Source Data file. Source data are provided as a Source Data file.
Fig. 3
Fig. 3. ONAC023 confers heat tolerance in rice.
a Heat tolerance evaluation of onac023 mutant and ONAC023 overexpressors. Green tissues after recovery were highlighted. See Supplementary Fig. 3b for the raw photos. Scale bars = 5 cm. Cross-bars represent mean ± SD of the survival rates (six and four independently treated buckets for onac023 and ONAC023 overexpressors, respectively). b Heat tolerance evaluation of onac023 mutants and ONAC023 overexpressors in terms of spikelet fertility. Representative panicles from two plants are shown for each line. Scale bars = 5 cm. Seed-setting rates of the heat stress-treated plants after recovery are shown by the cross-bars (mean ± SD, three plants with independent treatments). c Aniline blue staining of the germinated pollens on the heat stress-treated and untreated (mock) stigmas. Scale bars = 0.5 mm. The relative germinated pollen ratios (heat vs mock) of the tested lines were illustrated by boxplot (15 plants for each line). Whiskers of the box plot illustrate the 1.5× IQR ranges, and hinges denote the 25th and 75th percentiles. d Plant and panicle phenotypes of one representative block of the ONAC023-OE plants at the ripening stage, suffered high temperature (peak air temperature exceeded 40 °C during daytime) in the field. Scale bars = 10 cm. e Heat tolerance improvement of ONAC023-OE lines under the field conditions with heat stress occurred in August at Wuhan. Dots indicate the average values of six plants in each block. Cross-bars denote mean ± SEM. The air temperatures during heat stress are shown in Supplementary Fig. 8. P values between onac023 and DJ-WT were determined by two-tailed Student’s t test in (b, c). Multi-group comparisons in (ac, e) were evaluated by one-way ANOVA–HSD test (two-sided) at P < 0.05. Exact P values and details of the one-way ANOVA–HSD test can be found in the Source Data file. Source data are provided as a Source Data file.
Fig. 4
Fig. 4. Drought and heat stress-induced nuclear localization of ONAC023.
a The microscopic immunofluorescence images show the subcellular localization of ONAC023–FLAG in the seedling tissues. The anti-FLAG signal (by Alexa 594) and nuclei stained by DAPI were shown in red and blue, respectively. Scale bars = 10 µm. The Alexa 594 and DAPI signal distribution profiles are illustrated by the peak plots in the middle. Relative fluorescence intensity (RFI), representing the percentage fluorescence intensity to the maximum intensity in the sampling region, was quantified to evaluate the fluorescence distribution. The sampled regions were marked with dashed lines. The scatter plots (on the right side) summarize the immunofluorescence co-localization of all assayed slices. Each point represents a measured pixel in terms of the Z-transformed DAPI and anti-FLAG RFIs measured in each cell. The slopes show the fitted linear models by the two RFIs. Overall co-localization under each condition was assessed by the R2 value of Pearson correlation coefficient (PCC) analysis. n denotes the number of observed cells in the quantification. b Subcellular localization of ONAC023 under drought stress, heat stress, and normal conditions was confirmed by Western blot with an anti-FLAG antibody. Actin and histone H3 were set as endogenous controls for cytoplasmic proteins and nuclear proteins, respectively. See Supplementary Fig. 23 for the uncropped images. c ChIP–seq analysis of ONAC023–FLAG-OE#5 and ZH11-WT seedlings under normal conditions. Sequenced peak regions with no significant difference (NS, by the threshold of log2FC > 1 and FDR < 0.05) between the two samples are indicated as hex-bins (gray), while regions enriched in the ZH11-WT sample (possible background) are shown as blue points. The FDR values were determined by Wald test (two-sided) with Benjamini-Hochberg correction. Source data are provided as a Source Data file.
Fig. 5
Fig. 5. Identification of the co-factor for the nuclear transport of ONAC023 under the stress conditions.
a Integrated network of the ONAC023-interacting candidates identified by IP-MS using drought and heat stress-treated ONAC023–FLAG-OE#5 transgenic plants. Gray curves link the predicted high-confidence interactions by STRING program. Reported proteins were labeled by their names, while the rest were marked by accession IDs. MF, molecular function. Validation of the ONAC023-OsREM1.5 interaction by Co-IP (b), in vitro pull-down assay (c), and BiFC (d). In Co-IP and BiFC assays, an irrelevant NAC protein (SNAC1) and the 1–80 amino acid (AA) truncated form of OsREM1.5 (OsREM1.51–80) were used as negative controls. In the pull-down assay, an irrelevant protein (OsPYL1) and free GST were used as negative controls. The cross-bar plot in (d) shows the ratio of fluorescent cells (mean ± SD) in five repeats of the assay. P values were evaluated by two-tail Student’s t test. Scale bars = 20 µm. See Supplementary Fig. 23 for the uncropped images for (b, c). e Slices showing the subcellular localization of ONAC023 (tagged by YFP) in the WT (variety ZH11) and osrem1.5 protoplasts. Empty YFP was expressed as a control, and Ghd7–CFP was co-transfected as a nuclear marker. Scale bars = 10 μm. The middle peak plots illustrate the profiles of the ONAC023–YFP and Ghd7–CFP relative fluorescence intensities. Sampled regions are marked with dashed lines in the slices. The bottom scatter plots show the result of co-localization analysis of all assayed cells in each transfection. Each point represents a measured pixel in terms of YFP and CFP RFIs (normalized by Z-transform for each cell). The fitted linear models by two-color fluorescence are expressed as the slopes. The R2 value of PCC was used to illustrate the overall YFP–CFP co-localization in all observed cells. Source data are provided as a Source Data file.
Fig. 6
Fig. 6. OsREM1.5 is responsive to drought and heat stresses.
a The relative transcription fold change of OsREM1.5 under the drought or heat stress treatment compared to the non-stress condition. Cross-bars represent mean ± SD of three repeats of the treatments (at least 10 seedlings each). P values were determined by two-tailed Student’s t test. Drought and heat tolerance evaluations on the osrem1.5 mutants at the seedlings stage (b) and flowering stage (c). The survival rates of the recovered seedlings and the seed-setting rates of the recovered panicles (20 d after the treatment) were exhibited by cross-bar plots (mean ± SD). Three (for each mutant line) or six (for the ZH11-WT) buckets of seedlings and three flowering plants (for each mutant line and ZH11-WT) were tested with independent treatments. Scale bars = 5 cm (b) and 10 cm (c). d Dynamic subcellular localization changes of ONAC023–GFP and OsREM1.5–RFP in response to drought or heat stress treatment. N. benthamiana epidermal cells under 45 °C for 0 min, 35 min, and 60 min or treated with 15% PEG 6000 (drought stress) for 20 min and 60 min were imaged. Typical plaque-like localizations are labeled by arrows. The peak plots illustrate the profiles of the GFP and RFP relative intensities. Differential localization of ONAC023–GFP (cytoplasm) and OsREM1.5–RFP (cell membrane) was indicated by the dashed lines that show the non-overlapping peak fluorescent intensities in the plot. Sampled regions are marked with dashed lines in the composite slices. The ratio of reactive cells that showed >5 plaque-like fluorescent spots per cell and/or nuclear enrichment of GFP were expressed as mean ± SD. n, total observed cells. N, repeats of the assay. Scale bars denote 20 µm. e Subcellular localization of empty GFP in N. benthamiana epidermal cells. Scale bars denote 20 µm. Significances (P < 0.05) in (bd) were determined by one-way ANOVA–HSD test (two-sided) and marked by letter symbols. Exact P values and details of the one-way ANOVA–HSD test can be found in the Source Data file. Source data are provided as a Source Data file.
Fig. 7
Fig. 7. The phosphoablative form of OsREM1.5 contributed to the nuclear translocation of ONAC023 and the decreased cellular ROS accumulation under drought and heat stress.
a Snap-shot of protein sequence alignments of OsREM1.5, AtREM1.3, and StREM1.3 involving the conserved phosphor-residues. b Phos-tag assay showing the impaired phosphorylation of OsREM1.5 under drought or heat treatment. The phosphoablative OsREM1.5AAA was used as a control. NC, normal condition, DS, drought stress, HS, heat stress. See Supplementary Fig. 23 for the uncropped images. c Subcellular localization of the phosphomimetic OsREM1.5DDD and phosphoablative OsREM1.5AAA under drought (15% PEG 6000) or heat stress (45 °C) and normal conditions (25 °C) in N. benthamiana epidermal cells. Typical plaque-like localizations are labeled by arrows. The peak plots illustrate the profiles of the GFP and RFP relative intensities. Differential localization of ONAC023–GFP (cytoplasm) and OsREM1.5DDD–RFP (cell membrane) was indicated by the non-overlapping dashed lines. The sampled regions are marked with dashed lines in the composite slices. Statistics on the ratio of reactive cells (showed >5 plaque-like fluorescent spots per cell) were denoted as mean ± SD in each panel. n, total observed cells. N, repeats of the assay. d BiFC assay detecting the ONAC023–OsREM1.5AAA interaction in N. benthamiana epidermal cells under drought (15% PEG 6000 for 20 min) or heat stress (45 °C for 35 min). The OsREM1.5DDD–CFP was used as a transfection control. The ratio of cells showed yellow fluorescence was labeled as mean ± SD in the YFP slices. n, total observed cells. N, repeats of the assay. e, f ROS accumulation of the drought (30% PEG 4000) or heat (45 °C) stress-treated transgenic protoplasts identified by H2DCFDA. Cross-bars in (f) denote mean ± SD based on three repeats of the treatments. n, total observed cells. Significances (P < 0.05) in (c, d, f) were determined by one-way ANOVA–HSD test (two-sided). Exact P values and details of the one-way ANOVA–HSD test can be found in the Source Data file. Scale bars denote 20 µm (c, d) or 10 µm (e). Source data are provided as a Source Data file.
Fig. 8
Fig. 8. Identification of the ONAC023-TGs under drought stress and heat stress.
a DEGs in terms of wild-type (DJ-WT) vs onac023 by RNA-seq. Genes investigated in this study are shown in the plot. The P-adjust value was determined by Wald test (two-sided) with Benjamini-Hochberg adjustment. b Relative ChIP–seq enrichment profiles (DJ-WT vs onac023) around the TSS region of the up-regulated DEGs. The enrichment signals were presented as the log2 ratio of DJ-WT vs onac023 reads per genome coverage, averaged in 10-bp bins. c Venn diagrams showing the overlap of ONAC023-binding genes and up-regulated DEGs. The significance of the overlaps was determined by hypergeometric test (two-sided). d GO enrichment of ONAC023-TGs. The histogram length represents the enriched TG numbers by the GO term, and the colors represent the significance (by hypergeometric test with Benjamini-Hochberg adjustment, two-sided) of the enrichment. e NBT-staining of the onac023 and DJ-WT leaves. The gray levels under stress were normalized to those under normal conditions and expressed as mean ± SD of three independent repeats. f Track view of the RNA-seq reads intensities and the relative ChIP–seq intensities (IP vs input) of the four representative ONAC023-TGs. The binding areas of ONAC023 are denoted as rectangles. The CACG core binding motifs within the detection ranges (250 bp flanking the amplification region) of the ChIP–qPCR assay were labeled. g ChIP–qPCR validation of ONAC023 binding to the promoters of the target genes. Cross-bars indicate mean ± SD of the relative enrichment (IP vs input) determined by three repeats of the treatments (at least 20 seedlings each). h Validation of the expression of the four ONAC023-TGs by RT–qPCR. Cross-bars indicate mean ± SD of the relative expression levels for three repeats of the treatments (at least 10 seedlings each). P values were determined by two-tailed Student’s t test in (b, h). Multi-group comparison significances (P < 0.05) in (e, g) were determined by one-way ANOVA–HSD test (two-sided). Exact P values and details of the one-way ANOVA–HSD test can be found in the Source Data file. Source data are provided as a Source Data file.
Fig. 9
Fig. 9. Stress tolerance evaluation of the transgenic lines of the representative TGs.
a Phenotype comparison of OsPIP2;7-overexpressing lines (OsPIP2;7-OE#1 and OsPIP2;7-OE#2) and the negative transgenic control line (ZH11-WT) under normal and drought stress (RSM < 10% for 7 d) conditions in the field. b Representative panicles from five plants of the OsPIP2;7-OE lines after drought recovery. Scale bar = 5 cm. c Seed-setting rates of the OsPIP2;7-OE lines after drought recovery. The box plot presents the 1.5× IQR ranges (whiskers) extended from the 25th and 75th percentiles (lower and upper hinges) and median values (central hinges) determined by 15 plants for each tested line in (a). d Phenotype of the mutant seedlings of the representative ONAC023-TGs before and after drought or heat stress, compared to the ZH11-WT. Scale bars = 10 cm. The cross-bar plots denote the survival rate (mean ± SD) of seedlings from three buckets under independent treatments. e DAB-staining result of the 1% H2O2-treated pgl3, ossf3b1, and ZH11-WT leaves. Photos show one representative image from ten stained leaf segments each line. The box plot presents the 1.5× IQR ranges (whiskers) extended from the 25th and 75th percentiles (lower and upper hinges) and median values (central hinges) on the relative gray levels (by normalization to ZH11-WT) of the DAB-staining. f The sashimi plots indicate the RNA-seq reads densities and the average exon-junction reads counts of the RI-DASEs in the annexin gene OsANN1 under drought or heat stress. The cross-bars show the relative spliced-in quantifications of the DASEs by RT–qPCR (mean ± SD, data from three repeats of the treatments). g The qPCR validations on the OsANN1 RI-DASEs in the osfkbp20-1b and ossf3b1 mutants under the heat stress treatment. The cross-bars show the relative spliced-in quantifications of the DASEs by RT–qPCR (mean ± SD, data from three repeats of the treatments). Two-tailed Student’s t test was applied to determine the differences in (c−g). Source data are provided as a Source Data file.
Fig. 10
Fig. 10. Proposed working model of ONAC023 in conferring drought and heat tolerance.
Under the non-stress condition (the left part), the expression of ONAC023 is suppressed, and the minimal (if exist) ONAC023 proteins are tethered in the cytoplasm with the absence of OsREM1.5-integrated interactions, thereby impeding its stress-specific regulatory function. Under drought or heat stress (the right part), the up-regulated expression of OsREM1.5 and the dephosphorylation of the N-terminal intrinsically disordered region of OsREM1.5 confer enhanced interaction with ONAC023 and importin-αs. Then ONAC023 is transported to the nucleus possibly with the help of Importin-αs. The nuclear ONAC023 regulates stress response by targeting and activating arrays of stress-related genes functioning in diverse processes such as ROS scavenging, water transport, and alternative splicing regulation.

References

    1. Hall C, Dawson TP, Macdiarmid JI, Matthews RB, Smith P. The impact of population growth and climate change on food security in Africa: looking ahead to 2050. Int. J. Agr. Sustain. 2017;15:124–135. doi: 10.1080/14735903.2017.1293929. - DOI
    1. Normile D. Reinventing rice to feed the world. Science. 2008;321:330–333. doi: 10.1126/science.321.5887.330. - DOI - PubMed
    1. Sandhu N, et al. Identification and mapping of stable QTL with main and epistasis effect on rice grain yield under upland drought stress. BMC Genet. 2014;15:63. doi: 10.1186/1471-2156-15-63. - DOI - PMC - PubMed
    1. Peng G, Bai J, Wang J. Relationships between biochemical qualities of paddy rice and climate conditions in the Anning River Valley. J. Appl. Ecol. 2004;15:2277–2281. - PubMed
    1. Tian XH, et al. Heat-induced floret sterility of hybrid rice (Oryza sativa L.) cultivars under humid and low wind conditions in the field of Jianghan Basin, China. Plant Prod. Sci. 2010;13:243–251. doi: 10.1626/pps.13.243. - DOI