. 2024 Jul 12;14(1):16093.
doi: 10.1038/s41598-024-66918-w.

Dynamics of single-nuclei transcriptomic profiling of adipose tissue from diverse anatomical locations during mouse aging process

Affiliations

Dynamics of single-nuclei transcriptomic profiling of adipose tissue from diverse anatomical locations during mouse aging process

Yujie Wu et al. Sci Rep. .

Abstract

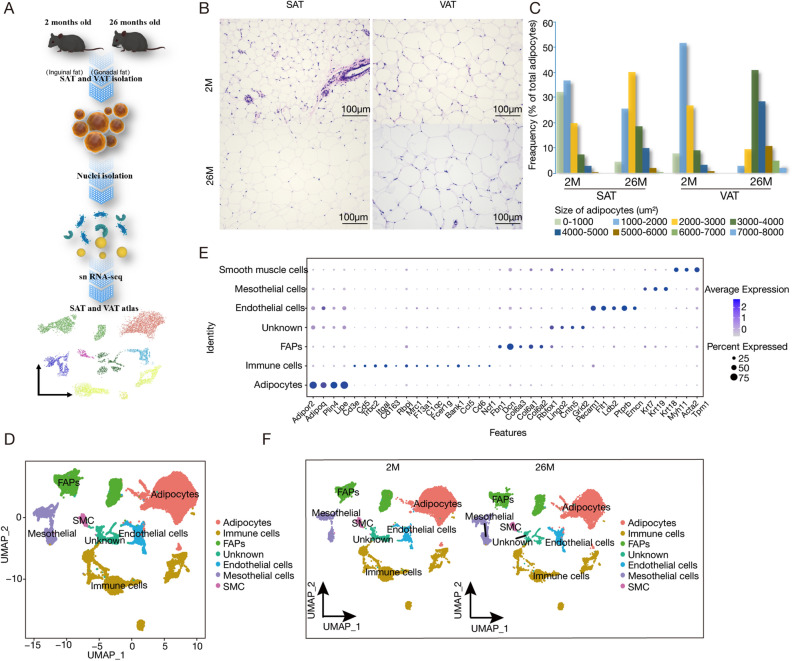
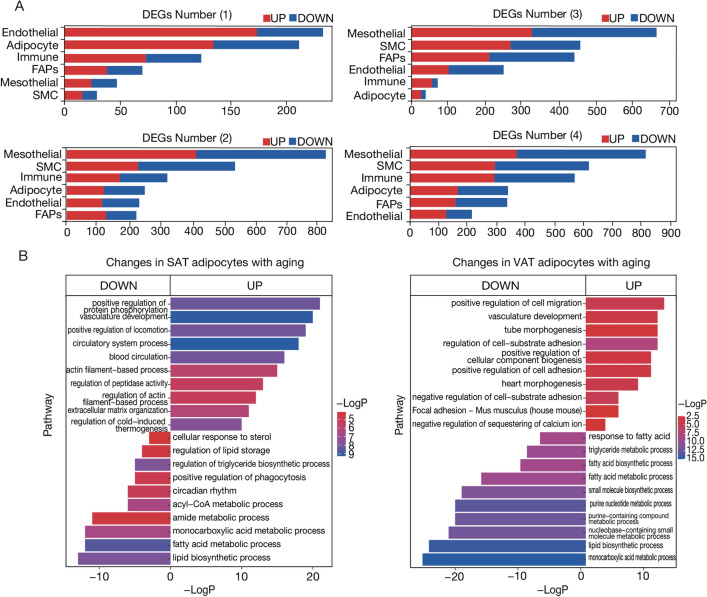
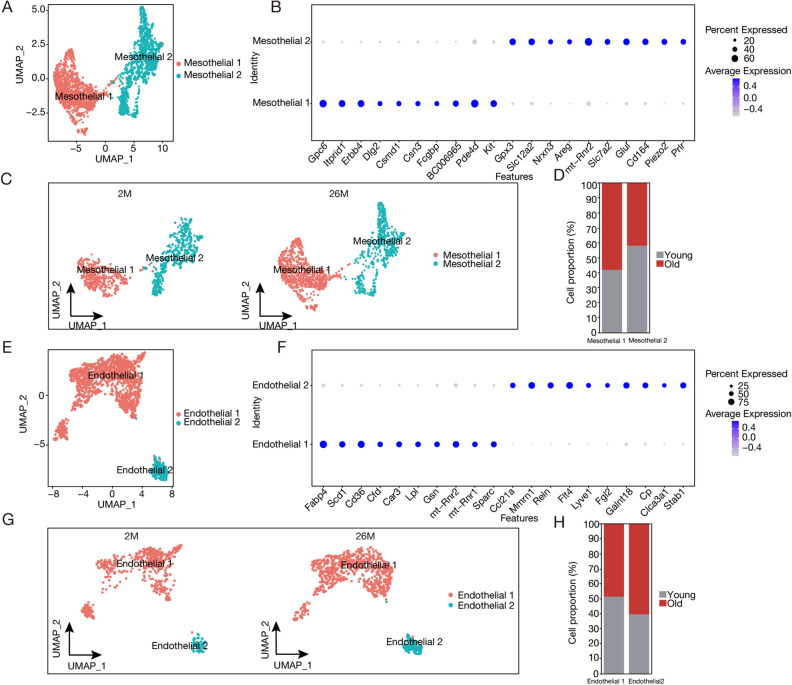
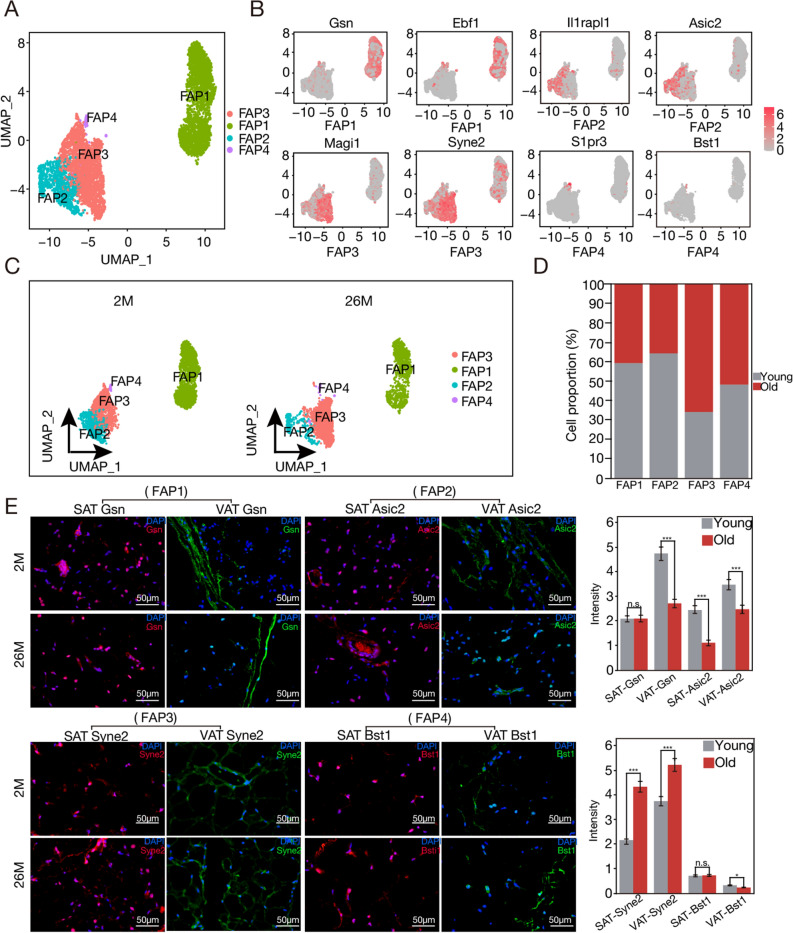
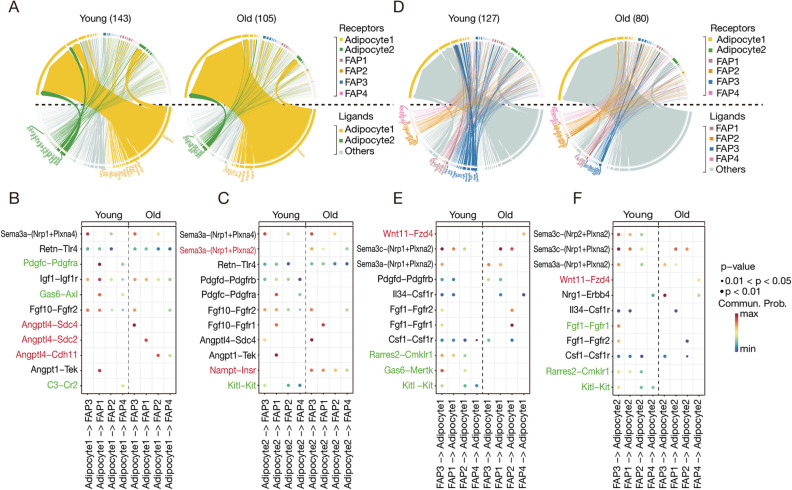
Adipose tissue plays critical roles in an individual's aging process. In this research, we use single-nucleus RNA sequencing to create highly detailed transcriptional maps of subcutaneous adipose tissue and visceral adipose tissue in young and aged mice. We comprehensively identify the various cell types within the white adipose tissue of mice, our study has elucidated seven distinct cell types within this tissue. Further analyses focus on adipocytes, fibro-adipogenic progenitors, and immune cells, revealing age-related declines in the synthetic metabolic activity of adipocytes, diminished immune regulation, and reduced maturation or proliferation of fibroblasts in undifferentiated adipocytes. We confirm the presence of distinct subpopulations of adipocytes, highlighting decreases in adipogenesis subgroups due to aging. Additionally, we uncover a reduction in immune cell subpopulations, driven by age-associated immune system dysregulation. Furthermore, pseudo-time analyses indicate that Adipocyte1 represents the 'nascent' phase of adipocyte development, while Adipocyte2 represents the 'mature' phase. We use cell-cell interaction to explore the age-dependent complexities of the interactions between FAPs and adipocytes, and observed increased expression of the inflammation-related Retn-Tlr4 interaction in older mice, while the anti-inflammatory Angpt1-Tek interaction was only detected in young mice. These transcriptional profiles serve as a valuable resource for understanding the functional genomics underlying metabolic disorders associated with aging in human adipose tissue.


Conflict of interest statement

The authors declare no competing interests.

Figures

Figure 1
Figure 1
snRNA-Seq of young and old white adipose tissue. (A) Workflow Overview: We conducted single-nucleus RNA sequencing (snRNA-seq) on nuclei isolated from combined subcutaneous (inguinal) and visceral (gonadal) adipose tissues of both young (2 months old) and old (26 months old) mice (n = 2 for each age group). (B) Representative sections of white adipose tissue (WAT) stained with Hematoxylin and Eosin (H&E), including SAT and VAT from both young and aged mice (scale bars indicate 100 μm). The figure on the right shows the analysis of the size and frequency distribution of adipocytes, for each site and age group, we randomly selected three tissue sections and measured the area of 241 adipocytes, which are depicted in this figure. (C) Adipocyte size distribution in young vs. aged mice (D) Uniform manifold approximation and projection (UMAP) representation of WAT cell types, covering both SAT and VAT. The embedding uesd the 1000 most variable genes and the initial 15 harmonized principal components. Clusters were delineated according to this UMAP representation. (E) Representation of normalized gene expression values in a bubble diagram, depicting the adipose lineage, endothelial cells, immune cells, mesothelial cells, and smooth muscle cells. (F) UMAP representations of cell types within SAT and VAT in 2-month-old and 26-month-old specimens.
Figure 2
Figure 2
Aging leads to a decline in adipocyte synthesis and metabolic capacity. (A) This investigation encompassed four specific comparisons: (1) Aging patterns within SAT tissues (referred to as “SAT Aging”), (2) Aging patterns within VAT tissues (“VAT Aging”), (3) comparisons between SAT and VAT tissues at the young age of 26 months, and (4) comparisons between SAT and VAT tissues at the elderly age of 2 months. Under these four comparisons, we analyzed the number of differential genes. (B) Adipocytes in SAT and VAT underwent KEGG and GO enrichment analyses at both 2 and 26 months of age, respectively.
Figure 3
Figure 3
Aging Changes the mesothelial cell and endothelial cell proportion in white adipose tissue. (A) Uniform manifold approximation and projection (UMAP) visualization of mesothelial subpopulations. (B) Representation of normalized gene expression values as a bubble diagram, illustrating Mesothelial1 and Mesothelial2. (C) UMAP representations of cellular subtypes within mesothelial cell populations in 2-month-old and 26-month-old mice. (D) Chart of mesothelial cell subgroup proportions during aging. (E) UMAP depiction of endothelial subpopulations. (F) Bubble diagram displaying normalized gene expression values for Endothelial1 and Endothelial2. (G) UMAP representations of cellular subtypes within endothelial cell populations in 2-month-old and 26-month-old mice. (H) Chart of endothelial cell subgroup proportions during aging.
Figure 4
Figure 4
Aging results in a reduction of immune cell subtypes. (A) Uniform manifold approximation and projection (UMAP) of immune subpopulations. The embedding depends on the 1000 most variable genes, and the first 16 harmonized principal components present. Cluster characterization was executed based on the UMAP embedding. (B) Identification of marker genes within immune subpopulations. Representation of an analysis of B cells, T cells, M1 macrophages, and M2 macrophages. (C) UMAP depiction of cellular subtypes within immune cell populations in specimens at 2 months and 26 months. (D) Chart of immune cell subgroup proportions during aging. (E) Immunofluorescence staining-based identification of distinct immune cell subsets. Cd79b acted as a proxy for B cells, Skap1 indicated T cells, Cacnb3 represented M1 macrophages, and Lyz2 signified M2 macrophages. Within this characterization, SAT was indicated in red, while VAT was denoted in green. Comparative analyses were performed based on fluorescence intensity and the abundance of these markers (scale bars represent 50 μm). Right figure shows the intensity of immunofluorescence.
Figure 5
Figure 5
Aging leads to a change in FAPs subpopulations. (A) Uniform Manifold Approximation and Projection (UMAP) representation of fibro-adipogenic progenitor (FAP) subpopulations. The embedding is established based on the 1000 most variable genes and the primary 16 harmonized principal components. Clustering was performed according to the UMAP embedding. (B) Definition of marker genes within FAP Subpopulations. A detailed examination of FAP1, FAP2, FAP3, and FAP4. (C) UMAP illustrations of cellular subtypes within FAP populations in 2-month-old and 26-month-old specimens. (D) Chart of FAPs subgroup proportions during aging. (E) Using immunofluorescence staining, distinct subpopulations of FAPs were identified. Gsn was indicative of FAP1, Asic2 represented FAP2, Syne2 identified FAP3, and Bst1 signified FAP4. Within this framework, SAT was identified in red, while VAT was defined in green. Analyses were conducted according to both fluorescence intensity and the relative abundance of these markers (scale bars represent 50 μm). Right figure shows the quantification of immunofluorescence.
Figure 6
Figure 6
Adipocyte subpopulations in white adipose tissue are changed by aging. (A) Uniform manifold approximation and projection (UMAP) visualization of adipocyte subpopulations. The embedding is based on the 1000 most variable genes and the first 16 harmonized principal components. Clustering was conducted using the UMAP embedding. (B) Description of marker genes within adipocyte subpopulations. Detailed examination of Adipocyte1 and Adipocyte2 subpopulations. (C) UMAP illustrations of cellular subtypes within adipocyte populations in 2-month-old and 26-month-old specimens. (D) Chart of adipocytes subgroup proportions during aging. (E) Adipocyte subgroups Adipocyte1 and Adipocyte2 were identified through immunofluorescence staining. Tshr (identified in red) represents Adipocyte1, whereas Cidea (marked in green) represents Adipocyte2. Comparative analysis was performed according to the fluorescence intensity and abundance of the markers. The left image displays Tshr immunofluorescence in SAT and VAT, while the right image illustrates Cidea immunofluorescence in SAT and VAT (scale bars represent 100 μm). Right figure shows the quantification of immunofluorescence.
Figure 7
Figure 7
Reconstruction of adipogenesis in vivo. (A) UMAP visualization of the pseudotemporal trajectory of adipocyte subpopulations. (B) Functional enrichment analysis of Adipocyte1-A, Adipocyte1-B, and Adipocyte2. (C) UMAP representation of RNA velocity across adipocyte subpopulations. (D) UMAP trajectories of adipocyte subpopulations from young and old mice. The left panel depicts young mice, while the right represents old mice. (E) The quantity of Adipocyte1-A, Adipocyte1-B, and Adipocyte2 in 2-month-old and 26-month-old mice. (F) Gene expression trajectories for Acacb, Cidea, and Ghr across adipocyte subpopulations in young and old mice. The plots display individual expression levels within three identified adipocyte subtypes (Adipocyte 1A, Adipocyte 1B, and Adipocyte2) over pseudotime. Solid lines represent the expression trend for young mice, while dashed lines indicate the trend for old mice.
Figure 8
Figure 8
Investigation of Ligand–receptor (L–R) interactions across subgroups of adipocytes, FAPs, and other cell types in 2-month-old and 26-month-old mice. (A) Chord diagrams displaying intercellular L–R interactions in adipocyte subpopulations and FAPs in young (left) and old (right) mice. Ligands differentially expressed by adipocytes are below the dashed line, while receptors overexpressed in the receiving cells (consisting of both adipocytes and FAPs) are situated above. Communications from adipocytes (L) to FAPs (R) are indicated in green and yellow, with other interactions presented in gray. (B) Bubble charts define normalized interaction scores between adipocytes and FAPs in both young and old states. These interaction scores are determined by the levels of ligand expression in Adipocyte1 and receptor expression within the receiving cells. Columns represent receiving cell types, while rows signify predicted L–R pairs. The color scale denotes interaction strength, with higher scores marking stronger cellular interaction. Green L–R pairs exist only in young mice, whereas red pairs are unique to old mice. (C) Bubble charts define normalized interaction scores between adipocytes and FAPs in both young and old states. These interaction scores are determined by the levels of ligand expression in Adipocyte2 and receptor expression within the receiving cells. (D) Chord diagrams in young (left) and old (right) adipose tissues showing intercellular L–R interactions. Ligands differentially expressed by receiving FAPs are below the dashed line, whereas receptors overexpressed in adipocytes are located above. Communications from FAPs (L) to adipocytes (R) are highlighted, while other interactions are indicated in gray. (E) Bubble charts illustrating the interaction scores between ligands in FAPs and their receptors in adipocyte1. (F) Bubble charts illustrating the interaction scores between ligands in FAPs and their receptors in adipocytes2.

Similar articles

Cited by

References

    1. Khan S, Chan YT, Revelo XS, Winer DA. The immune landscape of visceral adipose tissue during obesity and aging. Front. Endocrinol. 2020;11:267. doi: 10.3389/fendo.2020.00267. - DOI - PMC - PubMed
    1. Pilkington AC, Paz HA, Wankhade UD. Beige adipose tissue identification and marker specificity—Overview. Front. Endocrinol. 2021;12:599134. doi: 10.3389/fendo.2021.599134. - DOI - PMC - PubMed
    1. Ibrahim MM. Subcutaneous and visceral adipose tissue: Structural and functional differences. Obes. Rev. 2010;11:11–18. doi: 10.1111/j.1467-789X.2009.00623.x. - DOI - PubMed
    1. Amorim JA, et al. Mitochondrial and metabolic dysfunction in ageing and age-related diseases. Nat. Rev. Endocrinol. 2022;18:243–258. doi: 10.1038/s41574-021-00626-7. - DOI - PMC - PubMed
    1. Bloomgarden Z, Ning G. Diabetes and aging. J. Diabetes. 2013;5:369–371. doi: 10.1111/1753-0407.12086. - DOI - PubMed