. 2024 Jul 12;14(1):16089.
doi: 10.1038/s41598-024-66284-7.

Retinal hyperspectral imaging in mouse models of Parkinson's disease and healthy aging

Affiliations

Retinal hyperspectral imaging in mouse models of Parkinson's disease and healthy aging

Paul Trlin et al. Sci Rep. .

Abstract

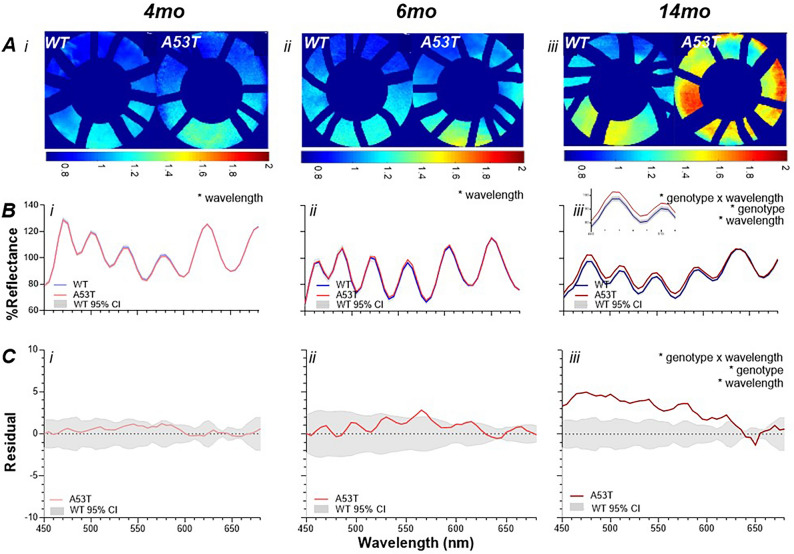
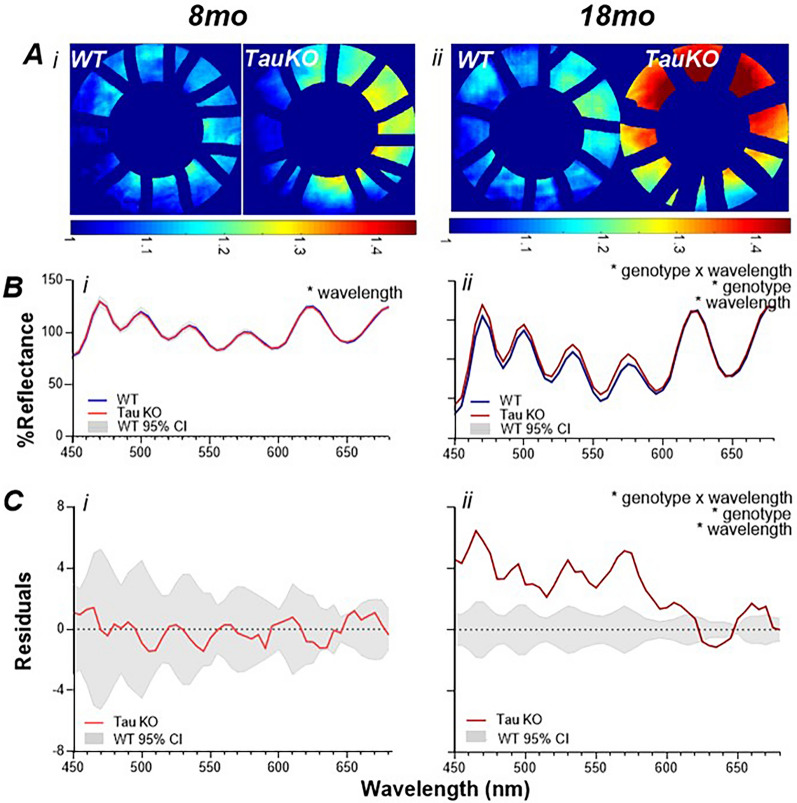
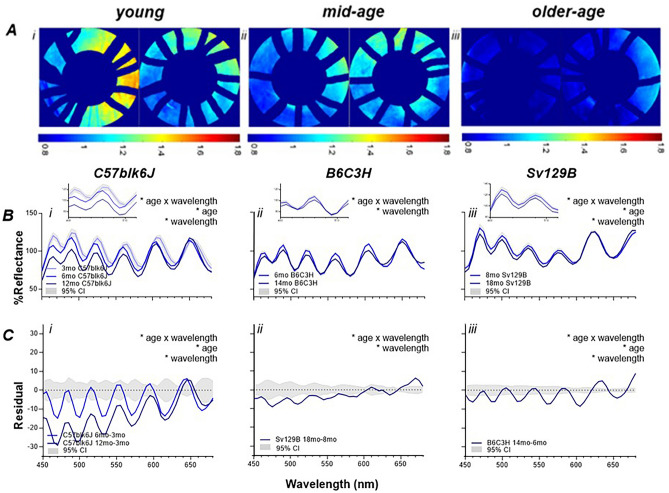
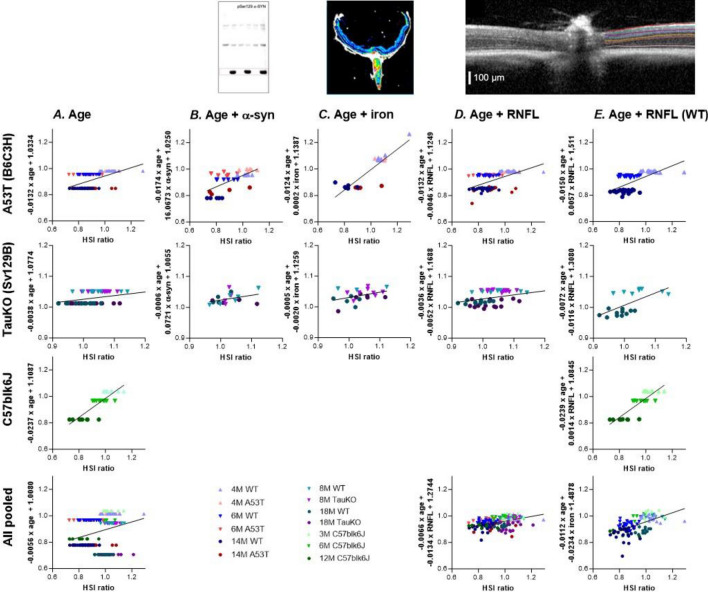
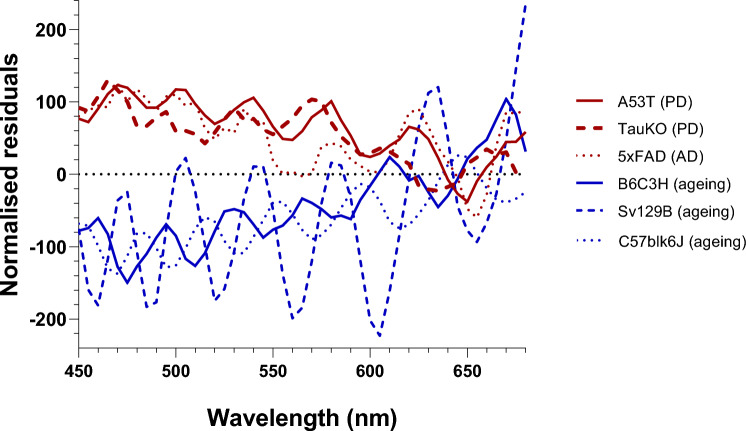
Retinal hyperspectral imaging (HSI) is a non-invasive in vivo approach that has shown promise in Alzheimer's disease. Parkinson's disease is another neurodegenerative disease where brain pathobiology such as alpha-synuclein and iron overaccumulation have been implicated in the retina. However, it remains unknown whether HSI is altered in in vivo models of Parkinson's disease, whether it differs from healthy aging, and the mechanisms which drive these changes. To address this, we conducted HSI in two mouse models of Parkinson's disease across different ages; an alpha-synuclein overaccumulation model (hA53T transgenic line M83, A53T) and an iron deposition model (Tau knock out, TauKO). In comparison to wild-type littermates the A53T and TauKO mice both demonstrated increased reflectivity at short wavelengths ~ 450 to 600 nm. In contrast, healthy aging in three background strains exhibited the opposite effect, a decreased reflectance in the short wavelength spectrum. We also demonstrate that the Parkinson's hyperspectral signature is similar to that from an Alzheimer's disease model, 5xFAD mice. Multivariate analyses of HSI were significant when plotted against age. Moreover, when alpha-synuclein, iron or retinal nerve fibre layer thickness were added as a cofactor this improved the R2 values of the correlations in certain groups. This study demonstrates an in vivo hyperspectral signature in Parkinson's disease that is consistent in two mouse models and is distinct from healthy aging. There is also a suggestion that factors including retinal deposition of alpha-synuclein and iron may play a role in driving the Parkinson's disease hyperspectral profile and retinal nerve fibre layer thickness in advanced aging. These findings suggest that HSI may be a promising translation tool in Parkinson's disease.

Keywords: A53T; Ageing; Alzheimer’s disease; Hyperspectral; Parkinson’s disease; TauKO.


Conflict of interest statement

CN and BB are joint investigators on an Australian Research Council Linkage grant LP160100126 with AstraZeneca Neuroscience and Biogen Inc. No conflicts of interest, financial or otherwise, are declared by the other authors.

Figures

Figure 1
Figure 1
Image analysis masking process (A) Retinal image at 427 nm selected where blood vessels are visible. (B) Application of an optic nerve and pupil annulus with a fixed size are applied. (C) Vessels, optic nerve head and peripapillary region within the annulus centre are masked (D) Area outside of pupil annulus is masked (E) The remaining retinal regions of interest (within yellow borders) were analysed for reflectance.
Figure 2
Figure 2
Hyperspectral imaging in A53T mice. (A) Representative retinal heat maps illustrate the difference ratio between short (450 to 480 nm) and long (630 to 660 nm) wavelengths. A53T mice exhibit warmer colours (higher ratio) compared to WT littermates particularly at the oldest age. For all panels WT and A53T comparisons are shown for the (i). 4-month-old (WT: light blue; A53T: light red) (ii). 6-month-old (WT: mid blue; A53T: mid red) (iii). 14-month-old cohort (WT: dark blue; A53T: dark red). (B) Average reflectance profiles of A53T (red) and WT (blue) mice with 95% CI (grey area). At (i) 4-month-old and (ii). 6-month-old a wavelength effect is found (p < 0.0001) and by (iii). 14-month-old an interaction effect is apparent (p < 0.0001), with a zoomed-in view (inset) of the reflectance at short wavelengths (460–520 nm) (C). Average residual values derived by subtracting the A53T group from the WT controls (red) with the variability in WT illustrated by grey 95% CI. No main effects are found at (i). 4-month-old nor (ii). 6-month-old but by (iii). 14-month-old a genotype x wavelength interaction (p < 0.0001) is apparent. Insert shows zoomed in changes at short wavelengths. *significance p < 0.05.
Figure 3
Figure 3
Hyperspectral imaging in TauKO mice. (A) Representative retinal heat maps illustrate the ratio between short and long wavelengths. TauKO mice exhibit warmer colours (higher ratio) compared to WT littermates at the oldest age. For all panels WT and TauKO comparisons are shown for the (i). 8-month-old (ii). 18-month-old cohort. (B) Average reflectance profiles of TauKO (red; 8-month-old: mid red; 18-month-old: dark red) and WT (blue; 8-month-old: mid blue; 18-month-old: dark blue) mice with 95% CI (grey area). At (i) 8-month-old a wavelength effect (p < 0.0001) is found and at (ii). 18-month-old an interaction effect (p < 0.0001) is observed, with a zoomed-in view (inset) of the reflectance at short wavelengths (460–520 nm) (C). By subtracting the TauKO group from the WT controls the residuals (red) indicate the same as Panel B. (i) In 8-month-old mice no interaction nor genotype effect is found and (ii) by 18-month an interaction effect is observed (p < 0.0001). Insert shows zoomed in changes at short wavelengths. 95% CI of WT in grey area, *significance p < 0.05.
Figure 4
Figure 4
Hyperspectral imaging with healthy aging. (A) Representative retinal heat maps (ratio between short and long wavelengths) show that advancing age causes a lower ratio and hence cooler colours. In Panels (B–E), the following “control” cohorts are examined (i). C57blk6J mice at young (3-month-old; light blue), mid-age (6-month-old; medium blue) and older-age (12-month-old; dark blue) (ii). WT littermates of A53T mice (B6C3H background strain) at mid- (6-month-old; medium blue) and older-age (14-month-old; dark blue) (iii). WT littermates of TauKO mice (Sv129B background strain) at mid-age (8-month-old; medium blue) and older-age (18-month-old; dark blue). (B) Average reflectance profiles show that in all three control cohorts advancing age causes an interaction effect (p < 0.0001) due to decreasing reflectivity at short wavelengths and increasing reflectivity at long wavelengths, with a zoomed-in view (insets) of the reflectance at short wavelengths (460–520 nm) (C). Similarly, the residual figures (older age—younger age) illustrate the same effect (interaction, p < 0.0001). Insert shows zoomed in changes at short wavelengths. *significance p < 0.05.
Figure 5
Figure 5
Multivariate correlations between HSI and age, α-synuclein, iron and RNFL. Representative images of co-factors and their method of analysis show in top row. α-synuclein assessed with western blot, from Tran et al.; iron assessed with mass spectrometry; RNFL quantified via OCT, from Tran et al. (A). HSI ratio correlated against age (B). HSI ratio correlated against age and α-synuclein. In A53T mice toxic phosphorylated α-synuclein is plotted and in TauKO animals, mouse α-synuclein is plotted (C). HSI ratio correlated against age and iron (D). HSI ratio correlated against age and RNFL (B). HSI ratio correlated against age and RNFL in control animals only (healthy aging).
Figure 6
Figure 6
Normalized residual plots highlighting the PD/AD versus aging phenotypes. Both A53T and TauKO PD models show a similar hyperspectral pattern to the 5xFAD AD model, with increased reflectance below ~ 600 nm. The hyperspectral effect in the aged control mice is the mirror opposite to this with decreased reflectance shown below ~ 600 nm across 3 different mouse strains.

Similar articles

References

    1. Chang CI. Hyperspectral Imaging: Techniques for Spectral Detection and Classification. Kluwer Academic/Plenum Publishers; 2003.
    1. Lu G, Fei B. Medical hyperspectral imaging: A review. J. Biomed. Opt. 2014;19:10901. doi: 10.1117/1.JBO.19.1.010901. - DOI - PMC - PubMed
    1. Liao H, Zhu Z, Peng Y. Potential utility of retinal imaging for Alzheimer’s disease: A review. Front. Aging Neurosci. 2018;10:188. doi: 10.3389/fnagi.2018.00188. - DOI - PMC - PubMed
    1. Siderowf A, Concha-Marambio L, Lafontant DE, Farris CM, Ma Y, Urenia PA, Nguyen H, Alcalay RN, Chahine LM, Foroud T, et al. Assessment of heterogeneity among participants in the Parkinson’s progression markers initiative cohort using alpha-synuclein seed amplification: A cross-sectional study. Lancet Neurol. 2023;22:407–417. doi: 10.1016/S1474-4422(23)00109-6. - DOI - PMC - PubMed
    1. More SS, Vince R. Hyperspectral imaging signatures detect amyloidopathy in Alzheimer’s mouse retina well before onset of cognitive decline. ACS Chem. Neurosci. 2015;6:306–315. doi: 10.1021/cn500242z. - DOI - PubMed

LinkOut - more resources