. 2024 Jul 12;10(1):73.
doi: 10.1038/s41540-024-00402-z.

Benchmarking and integrating human B-cell receptor genomic and antibody proteomic profiling

Affiliations

Benchmarking and integrating human B-cell receptor genomic and antibody proteomic profiling

Khang Lê Quý et al. NPJ Syst Biol Appl. .

Abstract

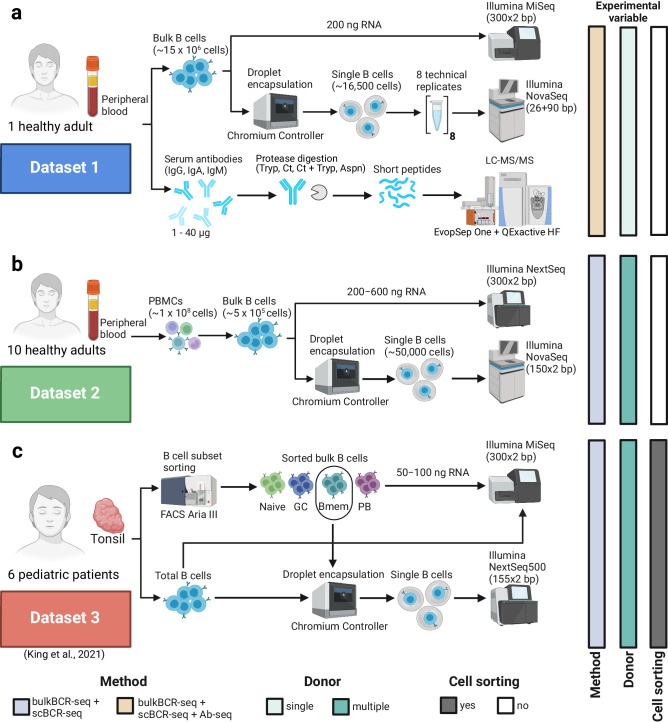
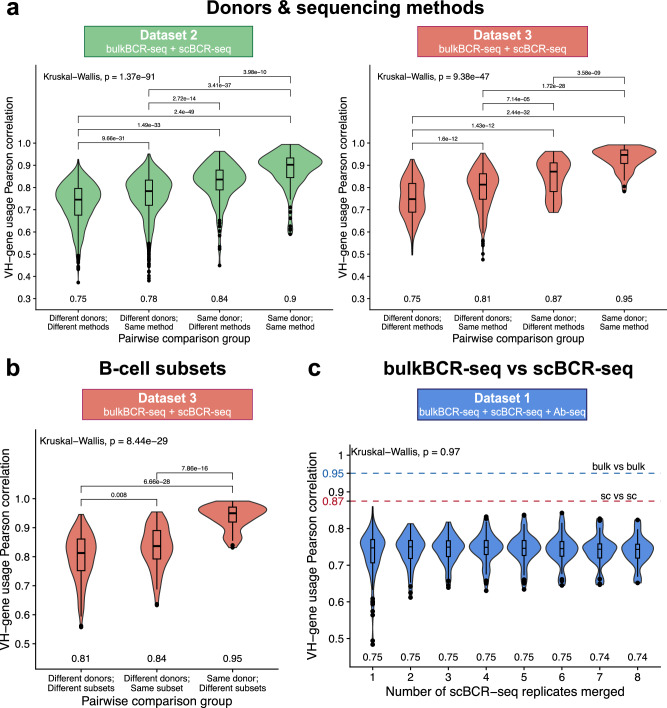
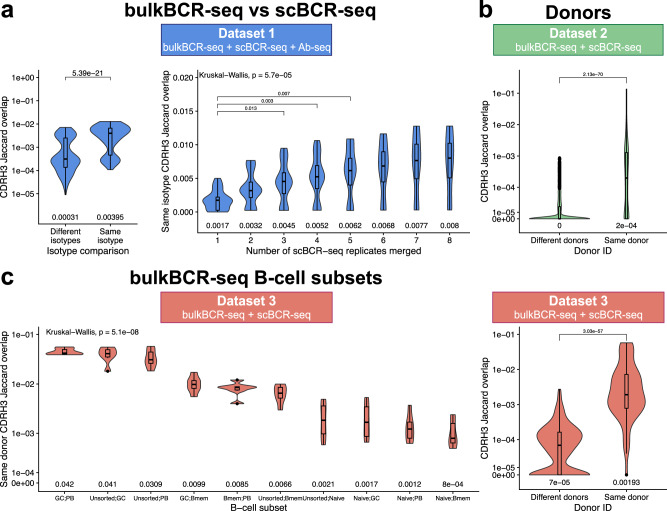
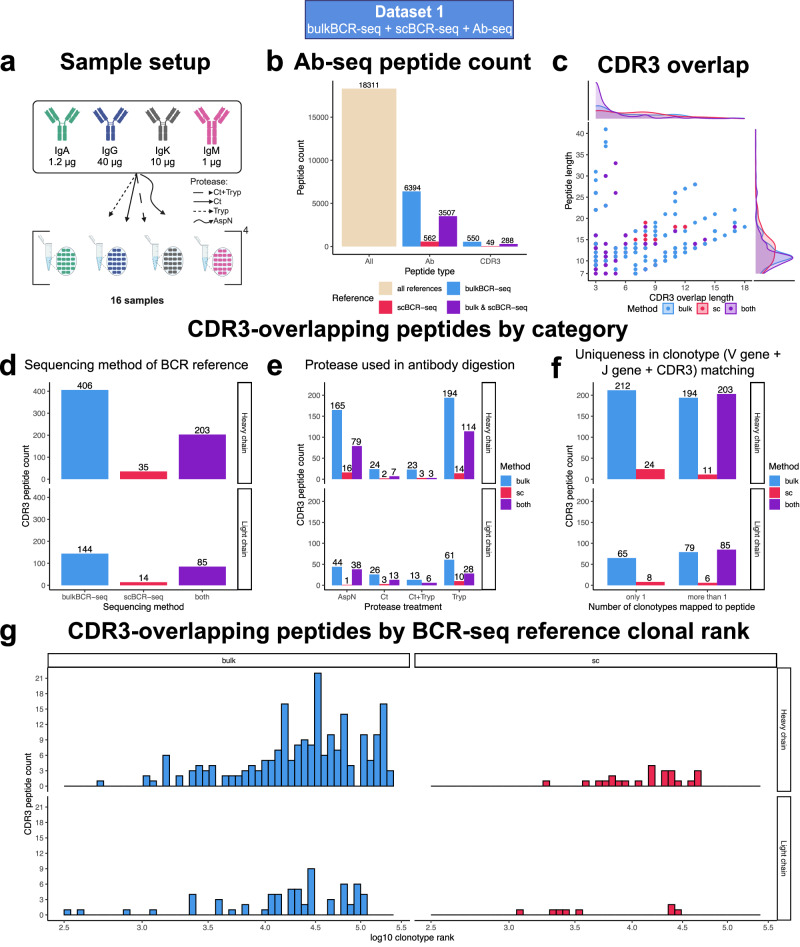
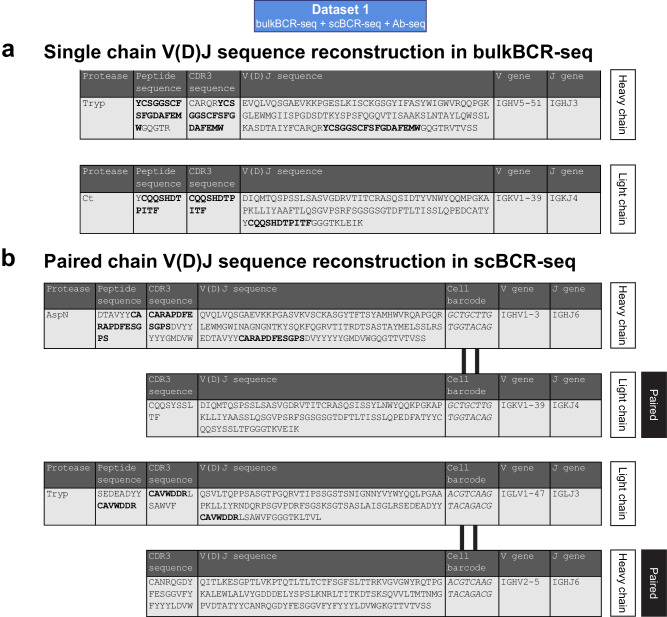
Immunoglobulins (Ig), which exist either as B-cell receptors (BCR) on the surface of B cells or as antibodies when secreted, play a key role in the recognition and response to antigenic threats. The capability to jointly characterize the BCR and antibody repertoire is crucial for understanding human adaptive immunity. From peripheral blood, bulk BCR sequencing (bulkBCR-seq) currently provides the highest sampling depth, single-cell BCR sequencing (scBCR-seq) allows for paired chain characterization, and antibody peptide sequencing by tandem mass spectrometry (Ab-seq) provides information on the composition of secreted antibodies in the serum. Yet, it has not been benchmarked to what extent the datasets generated by these three technologies overlap and complement each other. To address this question, we isolated peripheral blood B cells from healthy human donors and sequenced BCRs at bulk and single-cell levels, in addition to utilizing publicly available sequencing data. Integrated analysis was performed on these datasets, resolved by replicates and across individuals. Simultaneously, serum antibodies were isolated, digested with multiple proteases, and analyzed with Ab-seq. Systems immunology analysis showed high concordance in repertoire features between bulk and scBCR-seq within individuals, especially when replicates were utilized. In addition, Ab-seq identified clonotype-specific peptides using both bulk and scBCR-seq library references, demonstrating the feasibility of combining scBCR-seq and Ab-seq for reconstructing paired-chain Ig sequences from the serum antibody repertoire. Collectively, our work serves as a proof-of-principle for combining bulk sequencing, single-cell sequencing, and mass spectrometry as complementary methods towards capturing humoral immunity in its entirety.


Conflict of interest statement

V.G. declares advisory board positions in aiNET GmbH, Enpicom B.V, Absci, Omniscope, and Diagonal Therapeutics. V.G. is a consultant for Adaptyv Biosystems, Specifica Inc, Roche/Genentech, immunai, Proteinea, LabGenius, and FairJourney Biologics. All other authors declare no competing interests.

Figures

Fig. 1
Fig. 1. Experimental design for the comprehensive examination of the Ig repertoire at genomics and proteomics levels.
a The sequence information of the Ig repertoire can be examined on the nucleotide level by bulk BCR sequencing (bulkBCR-seq) and single-cell BCR sequencing (scBCR-seq) or on the amino acid level by bottom-up antibody mass spectrometry (Ab-seq). However, there is a lack of joint analysis integrating and comparing the overlap between methods, and few studies where Ab-seq data augment BCR data. b To address this problem, we developed a workflow that extracts repertoire information by combining high-throughput bulkBCR-seq with natively paired receptor information in scBCR-seq, then leveraging this sequence information to examine the composition of the serum antibody repertoire using Ab-seq. Our findings indicate that: (c) VH-gene usage is conserved within individuals despite differences in sequencing methods, (d) the gap in sampling depth between bulkBCR-seq and scBCR-seq resulted in low clonal sequence overlap, contributing to lower biological coverage of the Ig repertoire, and (e) it is possible to recover clonal sequences from peptide sequences characterized by Ab-seq, with paired chain BCR sequencing contributing to paired chain V(D)J sequence reconstruction. This figure was generated in BioRender.
Fig. 2
Fig. 2. Overview of the three datasets analyzed.
To analyze and compare datasets we measured repertoire features (e.g., VH-gene usage, CDRH3 sharing) across samples generated using bulkBCR-seq, scBCR-seq, and Ab-seq, we utilized both own-generated (Dataset 1 and Dataset 2) and public data (Dataset 3). a In Dataset 1 (blue rectangle), total B cells were isolated from the peripheral blood of one healthy adult, then sequenced in bulk or encapsulated into single-cell droplets in 8 technical replicates before sequencing. In addition, antibodies were isolated from the serum of the same individual, digested with protease, and then the peptides were analyzed by LC-MS/MS. b In Dataset 2 (green rectangle), peripheral mononuclear blood cells (PBMC) were isolated from the peripheral blood of ten healthy adults, and B cells were then isolated from the PBMCs. The isolated B cells were either sequenced in bulk or encapsulated into single-cell droplets and then sequenced. c In Dataset 3 (red rectangle) (publicly available data from a study by King and colleagues), tonsillar samples were obtained from six pediatric patients, B cells were stained and sorted by flow cytometry into cell subsets (Naive: naive B cells, GC: germinal center B cells, Bmem: memory B cells, PB: plasmablast) before bulk sequencing or single-cell encapsulation followed by single-cell sequencing. See also Supplementary Fig. 1 for unique CDRH3 sequence count, Supplementary Fig. 2 for repertoire Evenness, and Supplementary Fig. 3 for VH-gene usage distribution. This figure was generated in BioRender.
Fig. 3
Fig. 3. Both bulkBCR-seq and scBCR-seq capture an individual’s VH-gene usage profile.
VH-gene usage profiles were constructed by counting the frequency of all VH genes in a sample without weighting by clonotype size. VH-gene usage similarity between samples was measured by Pearson correlation. a VH-gene usage Pearson correlation between samples by donor (same or different donors) and sequencing method (bulkBCR-seq or scBCR-seq). b VH-gene usage Pearson correlation between bulkBCR-seq samples by donor and B-cell subset (same or different B-cell subsets). c VH-gene usage Pearson correlation between bulkBCR-seq and scBCR-seq samples (cumulatively merged from one to eight technical replicates to increase sampling depth). Numbers displayed below each violin plot signify the median Pearson correlation value. Global differences between the Pearson correlation values were determined using the Kruskal-Wallis test, and pairwise differences were determined by the Wilcoxon Rank Sum test, with p values adjusted for multiple testing by Bonferroni correction. All adjusted p values lower than 0.05 are displayed above brackets. See also Supplementary Fig. 5 for VH-gene usage correlation values displayed as heatmaps with hierarchical clustering.
Fig. 4
Fig. 4. CDRH3 sequence overlap between bulkBCR-seq and scBCR-seq samples is higher within the same isotype, increased with higher sampling depth, and within the same individual.
Pairwise CDRH3 amino acid sequence overlap was quantified using Jaccard overlap index (see Methods), with grouping of the Jaccard overlap index from the samples by isotypes, number of technical replicates merged, donors, and B-cell subsets. a CDRH3 sequences overlap of bulkBCR-seq versus scBCR-seq samples with the same or different isotypes; CDRH3 sequences overlap of bulkBCR-seq versus scBCR-seq samples of the same isotype, with scBCR-seq technical replicates cumulatively merged from one to eight replicates. b CDRH3 sequence overlap between samples from different donors or the same donor. c CDRH3 sequence overlap between samples of different B-cell subsets: unsorted B cells (Unsorted), naive B cells (Naive), germinal center B cells (GC), memory B cells (Bmem), plasmablasts (PB). Numbers displayed below each violin plot show the median Jaccard overlap value. Log10 scales were utilized on the y-axis when appropriate to enhance visual clarity. Global differences between the Jaccard overlap values were determined by the Kruskal-Wallis test and pairwise differences were determined by the Wilcoxon Rank Sum test, with p values adjusted for multiple testing by Bonferroni correction. All adjusted p values lower than 0.05 are displayed above brackets. See also Supplementary Fig. 6 for CDRH3 Jaccard overlap values displayed as heatmaps with hierarchical clustering.
Fig. 5
Fig. 5. Only a small proportion of Ab-seq peptides overlap with the CDR3 region, and most BCR reference matches were from less expanded clonotypes in BCR-seq.
Peptides from digestion of serum Abs were analyzed by LC-MS/MS, and their sequences were aligned to references made from bulkBCR-seq and scBCR-seq data of the same individual. a Sample setup for Ab-seq. b Number of peptides identified by LC-MS/MS (All), aligned to reference BCR sequences (Ab-specific), and overlapping at least 3 aa with the reference sequence’s CDR3 (CDR3-overlapping). c Ab-seq peptide length in regard to the length of overlap with its reference’s CDRH/L3. d Number of CDR3-overlapping peptides by the sequencing method of the reference match: bulkBCR-seq, scBCR-seq, or both bulkBCR-seq and scBCR-seq (both). e Number of CDR3-overlapping peptides by protease treatment: AspN, Chymotrypsin (Ct), Chymotrypsin followed by Trypsin (Ct+Tryp), and Trypsin (Tryp). f Number of CDR3-overlapping peptides that mapped to only one reference clonotype or multiple clonotypes. g Number of uniquely mapped CDR3-overlappping peptides by clonal size ranking in descending order of the BCR-seq reference match in log10 scale.
Fig. 6
Fig. 6. Ab-seq peptides that map to a specific clonotype can be utilized to recover clonal information.
Uniquely mapped CDR3-overlapping peptides (quantified in Fig. 5f) were utilized to recover the clonotype information provided by BCR-seq, with overlapping segment in bold. a Example of Ab-seq peptides mapped to a bulkBCR-seq used to recover the single chain V(D)J sequence. b Example of Ab-seq peptides mapped to a scBCR-seq used to recover the paired chain V(D)J sequence by utilizing the cell barcode unique to each single-cell droplet. See Supplementary File 1 for the full table of all V(D)J sequences recovered by Ab-seq.

Similar articles

Cited by

References

    1. Janeway CA, Jr, Golstein P. Lymphocyte activation and effector functions. Editorial overview. The role of cell surface molecules. Curr. Opin. Immunol. 1993;5:313–323. doi: 10.1016/0952-7915(93)90048-W. - DOI - PubMed
    1. Schroeder HW, Cavacini L. Structure and function of immunoglobulins. J. Allergy Clin. Immunol. 2010;125:S41–S52. doi: 10.1016/j.jaci.2009.09.046. - DOI - PMC - PubMed
    1. Tonegawa S. Somatic generation of antibody diversity. Nature. 1983;302:575–581. doi: 10.1038/302575a0. - DOI - PubMed
    1. Greiff V, Miho E, Menzel U, Reddy ST. Bioinformatic and statistical analysis of adaptive immune repertoires. Trends Immunol. 2015;36:738–749. doi: 10.1016/j.it.2015.09.006. - DOI - PubMed
    1. Elhanati, Y. et al. Inferring processes underlying B-cell repertoire diversity. Philos. Trans. R. Soc. Lond. B Biol. Sci. 370, 20140243 (2015). - PMC - PubMed

LinkOut - more resources