

Immune cell landscapes are associated with high-grade serous ovarian cancer survival
- PMID: 38997411
- PMCID: PMC11245545
- DOI: 10.1038/s41598-024-67213-4
Immune cell landscapes are associated with high-grade serous ovarian cancer survival
Abstract
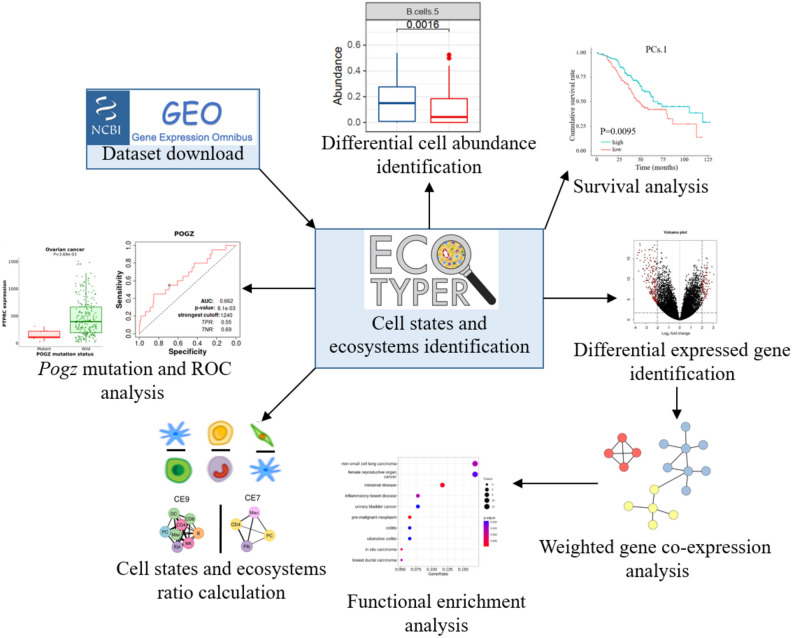
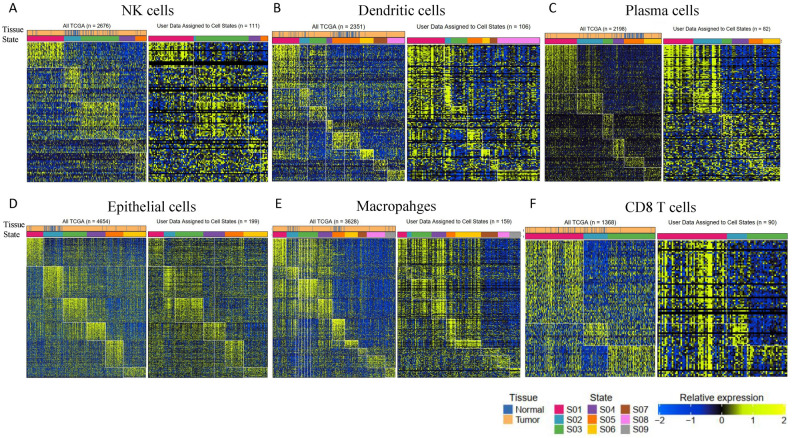
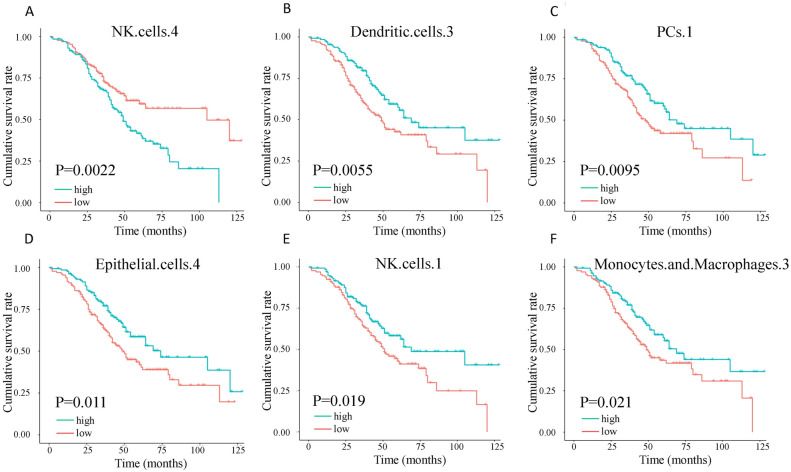
High-grade serous ovarian cancer (HGSOC) is an aggressive disease known to develop resistance to chemotherapy. We investigated the prognostic significance of tumor cell states and potential mechanisms underlying chemotherapy resistance in HGSOC. Transcriptome deconvolution was performed to address cellular heterogeneity. Kaplan-Meier survival curves were plotted to illustrate the outcomes of patients with varying cellular abundances. The association between gene expression and chemotherapy response was tested. After adjusting for surgery status and grading, several cell states exhibited a significant correlation with patient survival. Cell states can organize into carcinoma ecotypes (CE). CE9 and CE10 were proinflammatory, characterized by higher immunoreactivity, and were associated with favorable survival outcomes. Ratios of cell states and ecotypes had better prognostic abilities than a single cell state or ecotype. A total of 1265 differentially expressed genes were identified between samples with high and low levels of C9 or CE10. These genes were partitioned into three co-expressed modules, which were associated with tumor cells and immune cells. Pogz was identified to be linked with immune cell genes and the chemotherapy response of paclitaxel. Collectively, the survival of HGSOC patients is correlated with specific cell states and ecotypes.
Keywords: Cell ratios; High-grade serous ovarian cancer; Macrophage; Overall survival; T cell activation.
© 2024. The Author(s).
Conflict of interest statement
The authors declare no competing interests.
Figures


Similar articles
-
Immune profiling reveals prognostic genes in high-grade serous ovarian cancer.Aging (Albany NY). 2020 Jun 16;12(12):11398-11415. doi: 10.18632/aging.103199. Epub 2020 Jun 16. Aging (Albany NY). 2020. PMID: 32544083 Free PMC article.
-
Unraveling the molecular mechanisms of paclitaxel in high-grade serous ovarian cancer through network pharmacology.Sci Rep. 2025 May 12;15(1):16445. doi: 10.1038/s41598-025-00658-3. Sci Rep. 2025. PMID: 40355485 Free PMC article.
-
APOBEC3G Expression Correlates with T-Cell Infiltration and Improved Clinical Outcomes in High-grade Serous Ovarian Carcinoma.Clin Cancer Res. 2016 Sep 15;22(18):4746-55. doi: 10.1158/1078-0432.CCR-15-2910. Epub 2016 Mar 25. Clin Cancer Res. 2016. PMID: 27016308 Free PMC article.
-
Potential Transcriptomic Biomarkers for Predicting Platinum-based Chemotherapy Resistance in Patients With High-grade Serous Ovarian Cancer.Anticancer Res. 2024 Nov;44(11):4691-4707. doi: 10.21873/anticanres.17296. Anticancer Res. 2024. PMID: 39477310 Review.
-
Unveiling drug resistance pathways in high-grade serous ovarian cancer(HGSOC): recent advances and future perspectives.Front Immunol. 2025 Apr 30;16:1556377. doi: 10.3389/fimmu.2025.1556377. eCollection 2025. Front Immunol. 2025. PMID: 40370464 Free PMC article. Review.
Cited by
-
Identification of foam cell like M2 macrophages, AEBP1 biomarkers, and resveratrol as potential therapeutic in MASLD using Ecotyper and WGCNA.Sci Rep. 2025 Aug 18;15(1):30233. doi: 10.1038/s41598-025-15191-6. Sci Rep. 2025. PMID: 40825823 Free PMC article.
References
MeSH terms
Grants and funding
LinkOut - more resources
Full Text Sources
Medical
Research Materials
Miscellaneous
