. 2024 Sep;38(9):1894-1905.
doi: 10.1038/s41375-024-02328-1. Epub 2024 Jul 13.

Altered RNA export by SF3B1 mutants confers sensitivity to nuclear export inhibition

Affiliations

Altered RNA export by SF3B1 mutants confers sensitivity to nuclear export inhibition

Sana Chaudhry et al. Leukemia. 2024 Sep.

Abstract

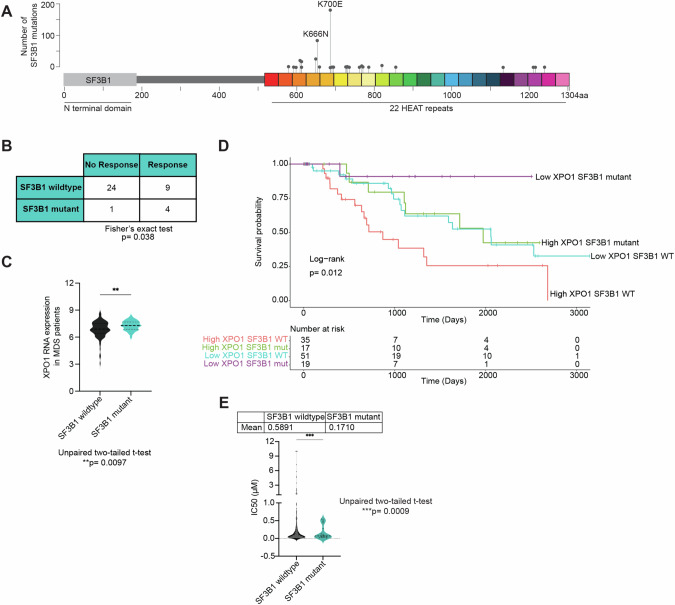
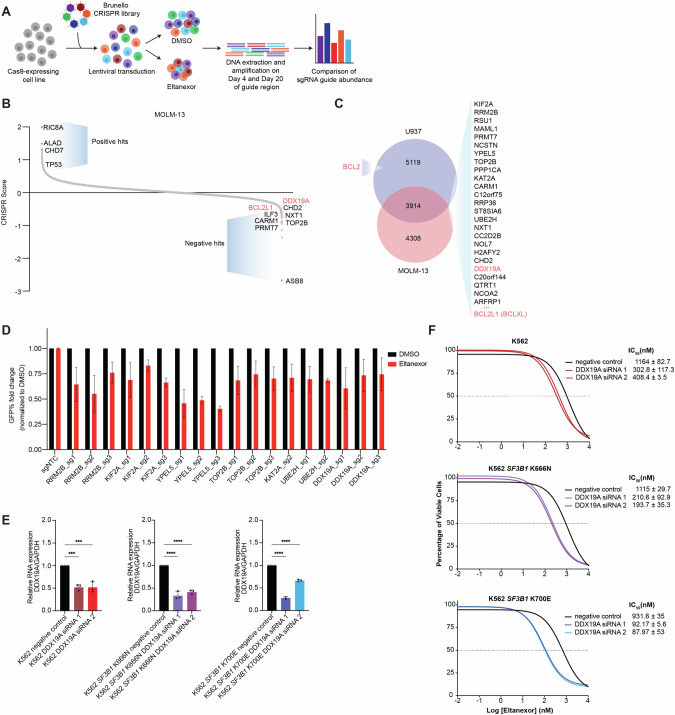
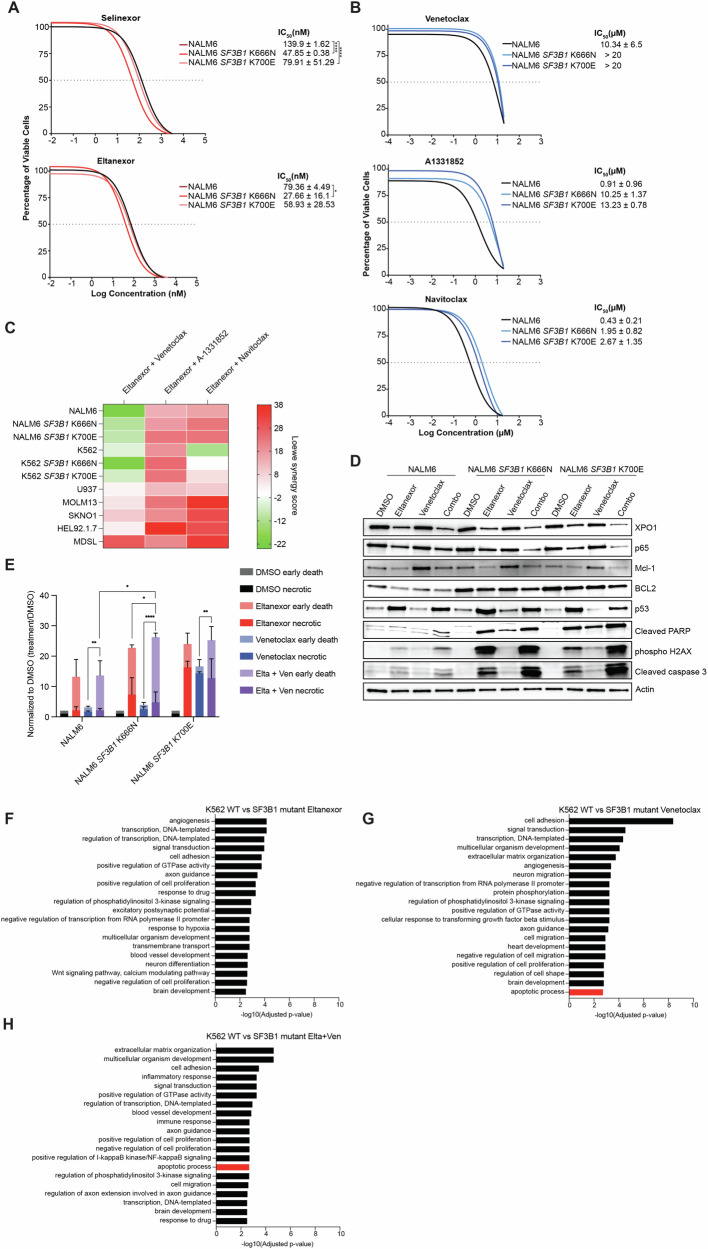
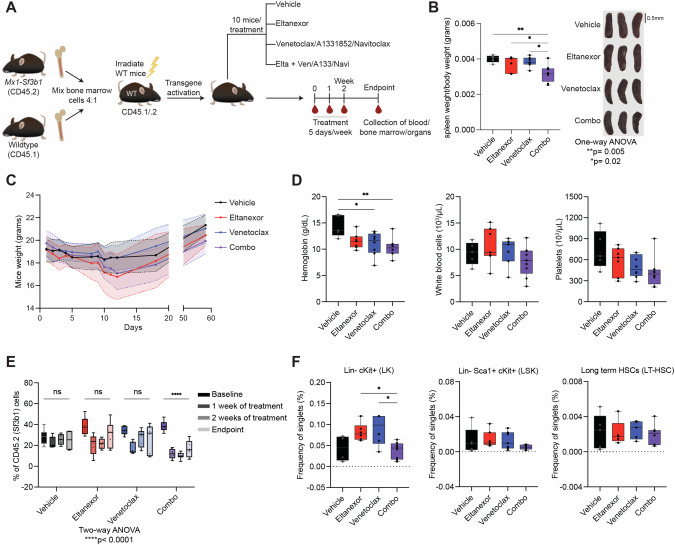
SF3B1 mutations frequently occur in cancer yet lack targeted therapies. Clinical trials of XPO1 inhibitors, selinexor and eltanexor, in high-risk myelodysplastic neoplasms (MDS) revealed responders were enriched with SF3B1 mutations. Given that XPO1 (Exportin-1) is a nuclear exporter responsible for the export of proteins and multiple RNA species, this led to the hypothesis that SF3B1-mutant cells are sensitive to XPO1 inhibition, potentially due to altered splicing. Subsequent RNA sequencing after XPO1 inhibition in SF3B1 wildtype and mutant cells showed increased nuclear retention of RNA transcripts and increased alternative splicing in the SF3B1 mutant cells particularly of genes that impact apoptotic pathways. To identify novel drug combinations that synergize with XPO1 inhibition, a forward genetic screen was performed with eltanexor treatment implicating anti-apoptotic targets BCL2 and BCLXL, which were validated by functional testing in vitro and in vivo. These targets were tested in vivo using Sf3b1K700E conditional knock-in mice, which showed that the combination of eltanexor and venetoclax (BCL2 inhibitor) had a preferential sensitivity for SF3B1 mutant cells without excessive toxicity. In this study, we unveil the mechanisms underlying sensitization to XPO1 inhibition in SF3B1-mutant MDS and preclinically rationalize the combination of eltanexor and venetoclax for high-risk MDS.


Conflict of interest statement

The authors declare no competing interests.

Figures

Fig. 1
Fig. 1. SF3B1 hotspot mutations lead to increased sensitivity to XPO1 inhibition in myelodysplastic neoplasms (MDS).
A Lollipop plot of the number of SF3B1 mutations in an MDS 2020 clinical sequencing study (MSKCC, 2020) from cBioportal (n = 4231 samples). B Patients harboring SF3B1 mutations display increased efficacy to XPO1i (selinexor and eltanexor), as shown by combining findings from a phase II clinical trial of selinexor and a phase I/II trial of eltanexor for high-risk MDS relapsed or refractory to hypomethylating agents. Data is shown as a 2 × 2 contingency table, Fisher’s exact test p = 0.0382. C XPO1 gene expression data (probe ID: 235927_at) from GSE58831 of 87 MDS SF3B1 wildtype and 37 MDS SF3B1 mutant patients. Data are shown as mean (SF3B1 wildtype = 6.834, SF3B1 mutant = 7.276), unpaired two-tailed t-test p = 0.0097. D Survival curve from GSE58831 of 185 MDS patients with high and low levels of XPO1 expression, with and without SF3B1 mutation. Optimal cutoff for high and low XPO1 expression was determined using surv_cutpoint. Log-rank p = 0.012. wildtype = WT, Mutant = mut. E BEAT AML ex vivo drug sensitivity of SF3B1 wildtype and mutant to XPO1 inhibitor, selinexor. Unpaired two-tailed t-test p = 0.0009.
Fig. 2
Fig. 2. Apoptosis pathway is significantly affected with an increase in nuclear retention and alternative splicing in SF3B1 mutant cells after XPO1 inhibition.
A Gene Ontology (GO) term enrichment analysis of biological processes in vehicle (DMSO) vs. 200 nM selinexor (XPO1 inhibitor) treated samples for 24 h with key important pathways colored in red for SF3B1 wildtype and mutant cells. B Heat map of the genes from the apoptosis pathway identified in SF3B1 wildtype and SF3B1 mutant cells in the presence of selinexor. C Schema of the apoptosis pathway illustrating the regulation of mitochondria-mediated intrinsic apoptosis pathway by BCL2 family of proteins. D Differentially expressed genes (DEGs) from all gene transcripts (top) and genes significantly abundant with selinexor treatment only (bottom) of SF3B1 wildtype (left) and SF3B1 mutant cells (right) showing increased nuclear retention in the SF3B1 mutant cells after selinexor treatment. E Genes upregulated in the nucleus after XPO1 inhibitor treatment of SF3B1 wildtype and mutant cells. F Identification of the significant splice events of the five major alternative splice types: skipped exons (SE), intron retention (IR), alternative’ 3’ splice site (A3SS), mutually exclusive exons (MXE) and alternative 5’ splice site (A5SS) in wildtype versus SF3B1 mutant nucleus after XPO1 inhibition. G Volcano plots of SE, A3SS, and IR in wildtype versus SF3B1 mutant nucleus after XPO1 inhibition with increased alternative splicing seen in the SF3B1 mutant. RNA sequencing included 3 replicates per treatment group.
Fig. 3
Fig. 3. Dynamic BH3 profiling shows increased priming for BCL2 family of proteins in response to eltanexor treatment.
A Schematic of dynamic BH3 profiling of SF3B1 WT and mutant cells. B Table depicting the interaction between BH3 peptides and BH3 mimetics with anti-apoptotic BCL2 family [47]. C Heatmap displaying the delta priming responses of the indicated BH3 peptides in NALM6 SF3B1 WT and mutant cells after 16 h of 1μM eltanexor treatment compared to DMSO. Delta priming is calculated as the percentage of cytochrome c loss with eltanexor treatment – percentage of cytochrome c loss with vehicle (DMSO) treatment (n = 3 replicates).
Fig. 4
Fig. 4. CRISPR screen identified genes that may be associated with response to XPO1 inhibition.
A Schematic of the Brunello genome-wide CRISPR screen in AML cell line, MOLM-13 cells treated with eltanexor. B Genome-wide CRISPR screen of MOLM-13 cells. Colored dots indicate genes involved in BCL2 pathway. CRISPR score represents the log2 (fold-change) values of sgRNAs enriched (positive values) or depleted (negative values) after eltanexor treatment normalized to DMSO at Day 20 post-transduction. C Venn diagram of negative hits (sensitizers) in MOLM-13 and U937 CRISPR screens. D Competition-based assay of sgRNAs into MOLM-13 cells and treated with eltanexor for 48 h. Data is shown as mean + SEM. E RT-qPCR of DDX19A normalized to housekeeping gene GAPDH after 48 h of DDX19A siRNA-mediated gene silencing in K562 cells. F Dose-response curves of DDX19A siRNA knockdown cells treated with eltanexor for 48 h (n = 3 replicates).
Fig. 5
Fig. 5. SF3B1 mutant cells show increased synergy with the combination of XPO1 inhibitor and BCL inhibitors.
A Dose-response curves of NALM6 cells treated with XPO1 inhibitors, eltanexor and selinexor, for 72 h (n = 4 replicates). Two-way ANOVA. B Dose-response curves of NALM6 cells treated with BCL inhibitors, venetoclax, A-1331852, and navitoclax, for 72 h (n = 4 replicates). C Heat map of the combination of eltanexor and BCL inhibitors in SF3B1 WT and mutant cells and other AML cell lines using Loewe on SynergyFinder. >10 are synergistic, <−10 are antagonistic. (n = 3 replicates). D Western blot analysis of XPO1 and BCL2 targets after treatment with vehicle, 200 nM eltanexor, 1 μM venetoclax, and combination of 200 nM eltanexor and 1μM venetoclax for 24 h. E Stacked bar plots of Annexin V and propidium iodide staining showing the early death and necrotic cells of NALM6 isogenic cells after 72 h of treatment with eltanexor, venetoclax, and the combination (n = 3 replicates) normalized to DMSO. Two-way ANOVA, statistics shown are for early death comparisons. F GO pathway enrichment analysis of the differentially expressed genes between wildtype and SF3B1 mutant with eltanexor treatment. G GO pathway enrichment analysis of the differentially expressed genes between wildtype and SF3B1 mutant with the venetoclax treatment. H GO pathway enrichment analysis of the differentially expressed genes between wildtype and SF3B1 mutant with eltanexor with venetoclax treatment. RNA sequencing included 3 replicates per treatment group.
Fig. 6
Fig. 6. Combination of XPO1 inhibitor and BCL2 inhibitor, venetoclax, led to a decrease of Sf3b1 mutant cells.
A Schema for the transgenic mice treatment showing Sf3b1 mutant (CD45.2) and wildtype (CD45.1) bone marrow cells combined at a 4:1 ratio and injected into irradiated wildtype mice. Following transgene activation, mice were treated with vehicle, eltanexor (10 mg/kg), BCL inhibitor (25 mg/kg), and the combination of eltanexor and BCL family inhibitor for two weeks. Collection of blood occurred at baseline, after a week of treatment, after second week of treatment, and at endpoint. B Bar chart of reduced size and weight of spleen in combination treated mice with representative images of the spleens. Scale bar: 0.5 mm. One-way ANOVA **p = 0.005, *p = 0.02. C Comparison of the body weight between the treatment groups of vehicle, eltanexor, venetoclax, and the combination of eltanexor and venetoclax. Data are shown as mean ± standard deviation. D Effect of eltanexor, venetoclax, and the combination on hematological parameters (hemoglobin, white blood cells, and platelets) at the endpoint of experiments. Data are shown as mean ± standard deviation, one-way ANOVA **p = 0.005, *p = 0.02. E Violin plot of CD45.2+ compartment (Sf3b1 mutant cells) in peripheral blood before treatment, after one week of treatment, after two weeks of treatment, and at endpoint. Data are shown as mean ± standard deviation, two-way ANOVA ****p < 0.0001. F Percentage of LincKit+ (LK), LinSca1+cKit+ (LSK), and long-term hematopoietic stem cells (LTHSC) in CD45.2+ compartment, one-way ANOVA. Elta = eltanexor, Ven = venetoclax, A133 = A1331852, Navi = navitoclax, Combo = eltanexor and venetoclax.

Similar articles

Cited by

References

    1. Cazzola M. Myelodysplastic Syndromes. N Engl J Med. 2020;383:1358–74. 10.1056/NEJMra1904794 - DOI - PubMed
    1. Nimer SD. Myelodysplastic syndromes. Blood. 2008;111:4841–51. 10.1182/blood-2007-08-078139 - DOI - PubMed
    1. Cogle CR. Incidence and Burden of the Myelodysplastic Syndromes. Curr Hematol Malig Rep. 2015;10:272–81. 10.1007/s11899-015-0269-y - DOI - PMC - PubMed
    1. de Witte T, Bowen D, Robin M, Malcovati L, Niederwieser D, Yakoub-Agha I, et al. Allogeneic hematopoietic stem cell transplantation for MDS and CMML: recommendations from an international expert panel. Blood. 2017;129:1753–62. 10.1182/blood-2016-06-724500 - DOI - PMC - PubMed
    1. Sekeres MA, Gerds AT. Established and novel agents for myelodysplastic syndromes. Hematology Am Soc Hematol Educ Program. 2014;2014:82–9. 10.1182/asheducation-2014.1.82 - DOI - PubMed

MeSH terms