. 2024 Jul;26(7):1110-1123.
doi: 10.1038/s41556-024-01440-9. Epub 2024 Jul 12.

Neutrophil-derived migrasomes are an essential part of the coagulation system

Affiliations

Neutrophil-derived migrasomes are an essential part of the coagulation system

Dong Jiang et al. Nat Cell Biol. 2024 Jul.

Abstract

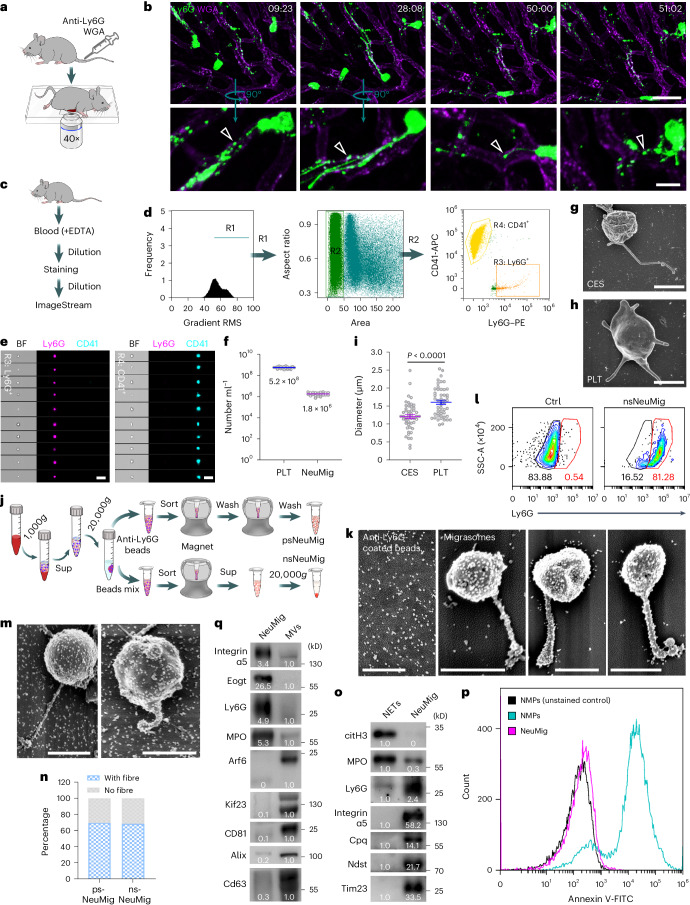
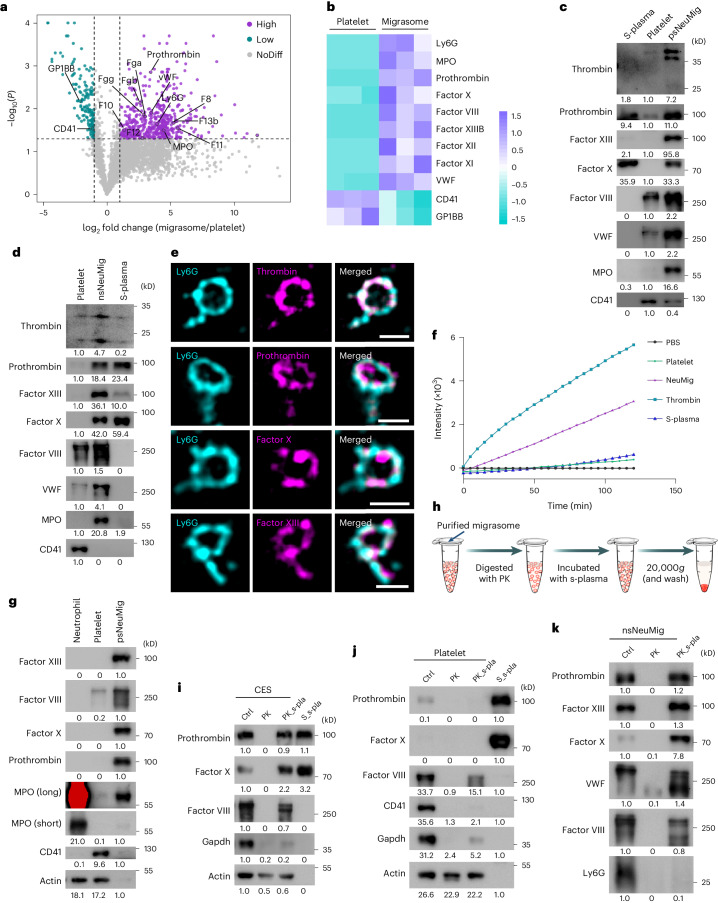
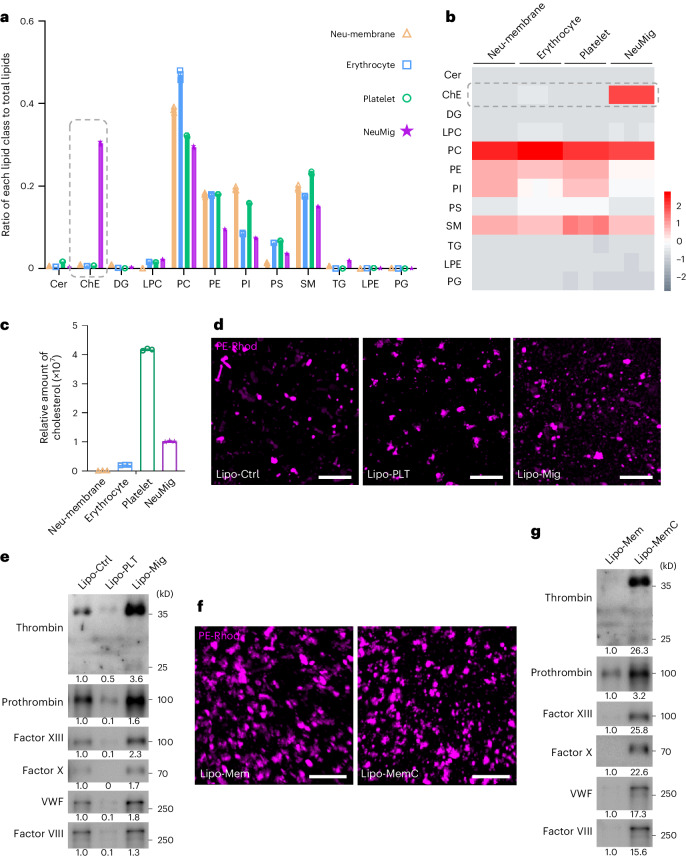
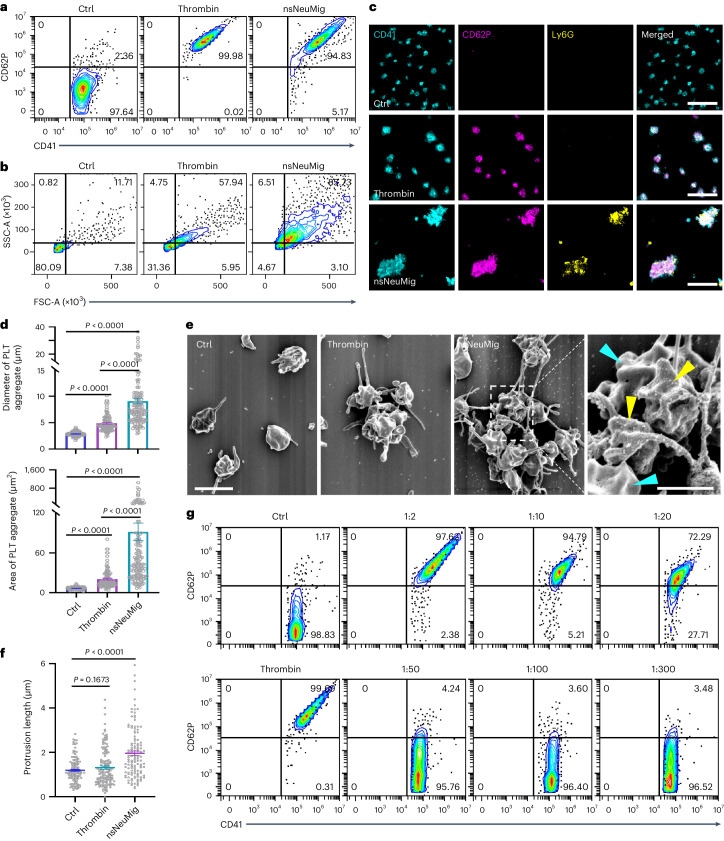
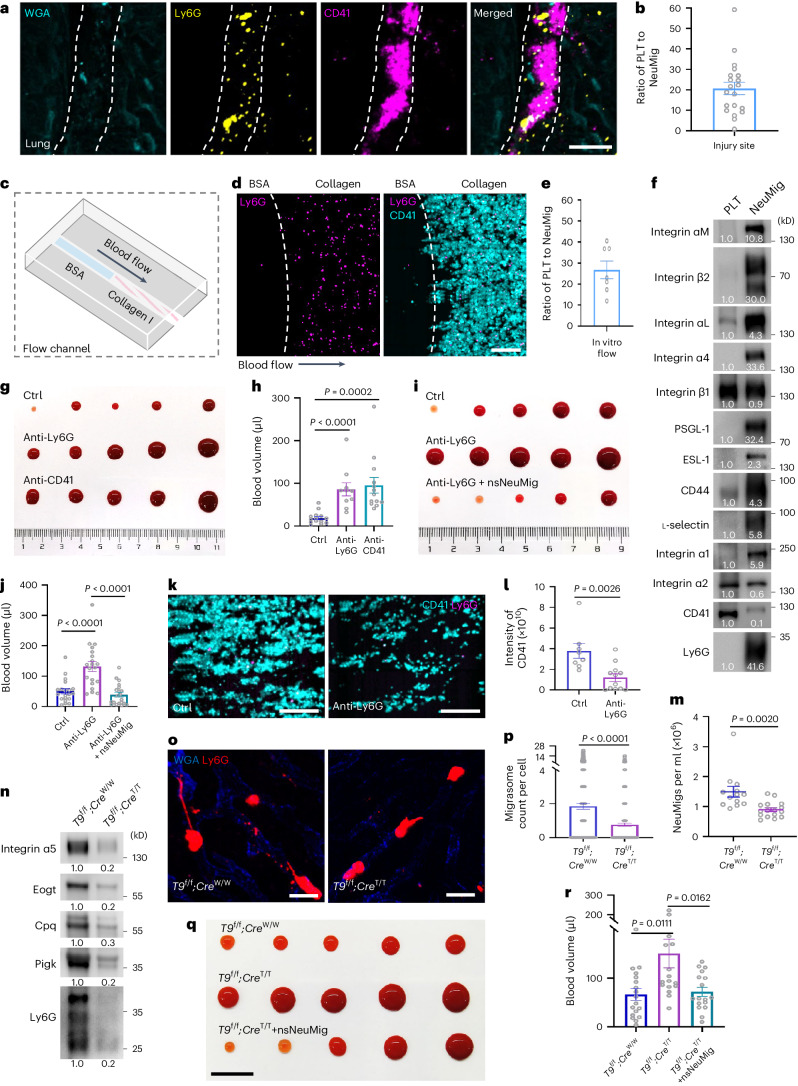
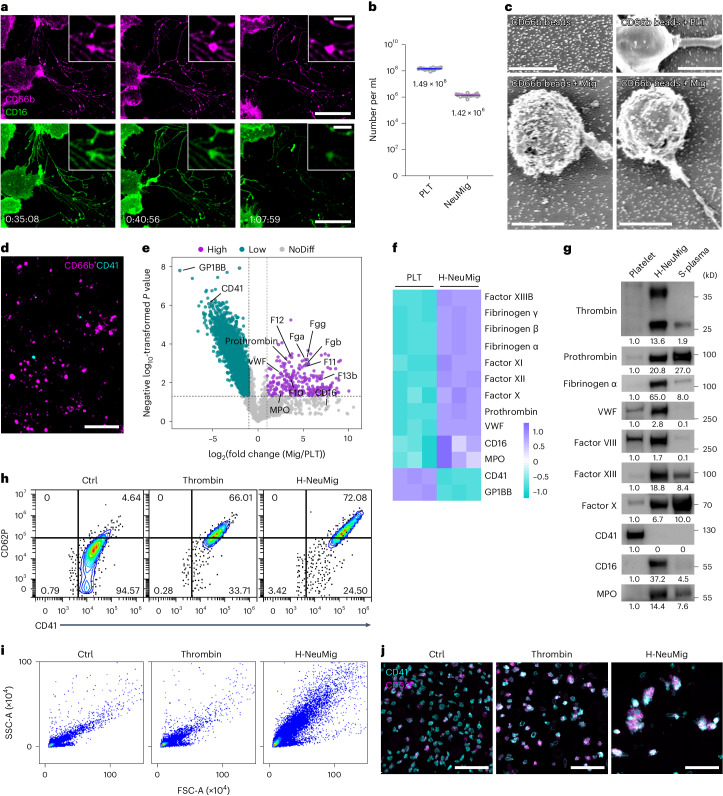
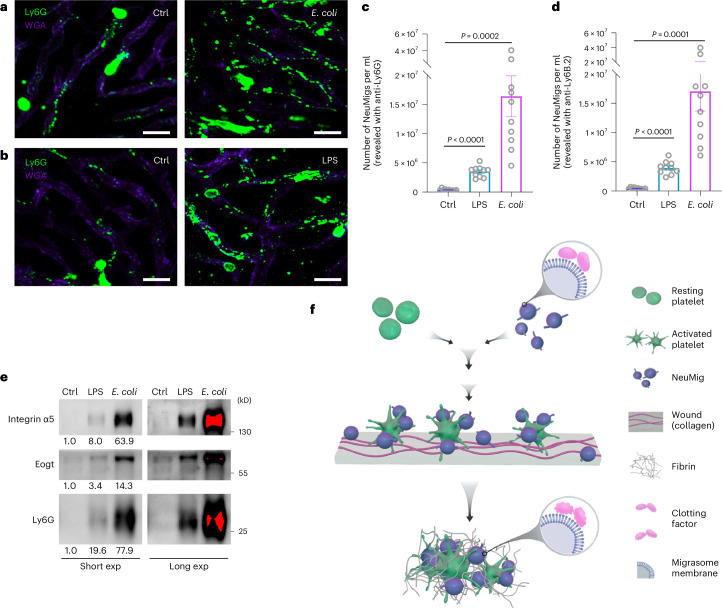
Migrasomes are organelles that are generated by migrating cells. Here we report the key role of neutrophil-derived migrasomes in haemostasis. We found that a large number of neutrophil-derived migrasomes exist in the blood of mice and humans. Compared with neutrophil cell bodies and platelets, these migrasomes adsorb and enrich coagulation factors on the surface. Moreover, they are highly enriched with adhesion molecules, which enable them to preferentially accumulate at sites of injury, where they trigger platelet activation and clot formation. Depletion of neutrophils, or genetic reduction of the number of these migrasomes, significantly decreases platelet plug formation and impairs coagulation. These defects can be rescued by intravenous injection of purified neutrophil-derived migrasomes. Our study reveals neutrophil-derived migrasomes as a previously unrecognized essential component of the haemostasis system, which may shed light on the cause of various coagulation disorders and open therapeutic possibilities.


Conflict of interest statement

L.Y. is the scientific founder of Migrasome Therapeutics. The remaining authors declare no competing interests.

Figures

Fig. 1
Fig. 1. Circulating neutrophils generate a large number of migrasomes in blood vessels.
a, Diagram of the procedure for intravital imaging of mouse liver. b, Intravital imaging of neutrophils in mouse liver. Neutrophils were labelled with PE–anti-Ly6G (Gr1; green) and blood vessels were labelled with AF647–WGA (purple). Scale bars, 30 μm (top) and 10 μm (magnified; bottom). The arrowheads indicate migrasomes. c, Diagram of the procedure for preparing samples for imaging flow cytometry analysis. d, Gating strategy of imaging flow cytometry analysis. Blood was stained with PE–anti-Ly6G and APC–anti-CD41. Neutrophil-derived migrasomes (R3; Ly6G+) and platelets (R4; CD41+) were gated from the small particle population (R2). e, Images of neutrophil-derived migrasomes and platelets from ImageStream. Scale bars, 10 μm. f, Quantification of neutrophil-derived migrasomes (NeuMigs) and platelets (PLTs) in mouse blood by ImageStream analysis. n = 20 mice. g,h, SEM images of a CES (g) and a platelet (h). Scale bars, 1 μm. i, Measurement of the diameter of migrasomes and platelets. n = 50 particles per group. j, Diagram of the procedure for positive (top) and negative (bottom) isolation of neutrophil-derived migrasomes from blood. k, SEM images of anti-Ly6G-conjugated beads and positively sorted neutrophil-derived migrasomes (psNeuMigs). Scale bars, 1 μm. l, Flow cytometry analysis of negatively sorted neutrophil-derived migrasomes (nsNeuMigs) stained with PE–anti-Ly6G. Particles positively isolated with the kit beads served as a control (Ctrl). Samples from 20 mice were pooled and analysed together. m, SEM images of nsNeuMig incubated with anti-Ly6G-conjugated magnetic beads. Scale bars, 1 μm. n, Percentage of psNeuMig and nsNeuMig with or without retraction fibres. n = 43 for psNeuMig and n = 54 for nsNeuMig. o, nsNeuMigs and NETs were normalized with total protein and subjected to western blot analysis using antibodies against markers for NETs and migrasomes. p, Flow cytometry analysis of nsNeuMig and NMPs after staining with Annexin V-FITC. Unstained NMPs served as a negative control. q, Isolated neutrophil-derived migrasomes and microvesicles were normalized with total protein and subjected to western blot analysis using antibodies against the indicated molecules. All statistical data are presented as means ± s.e.m. P values were calculated using a two-tailed, unpaired t-test. The western blot grey values were quantified using ImageJ. Source numerical data and unprocessed blots are available in Source Data Fig. 1. RMS, root mean square. BF, bright field; Sup, supernatant. Source data
Fig. 2
Fig. 2. Coagulation factors are enriched in neutrophil-derived migrasomes.
a, Volcano plot showing the differential abundance of proteins in isolated neutrophil-derived migrasomes versus platelets. Migrasomes and platelets were subjected to label-free quantitative mass spectrometry analysis. The purple dots represent a migrasome/platelet abundance ratio of ≥2 (P < 0.05) and the cyan dots represent a migrasome/platelet abundance ratio of ≤0.5 (P < 0.05). n = 3 biologically independent experiments. P values were calculated using a two-tailed, unpaired t-test. b, Heat map of the distribution of coagulation factors in platelets and neutrophil-derived migrasomes. The coloured scale bars represent relative values. c,d, psNeuMigs (c) or nsNeuMigs (d) were isolated from the blood of platelet-depleted mice and platelets were isolated from the blood of neutrophil-depleted mice. S-plasma is the supernatant after centrifuging plasma at 20,000g, 4 ℃ for 1 h. These samples were normalized with total protein and subjected to western blot analysis. e, Confocal microscopy images of purified neutrophil-derived migrasomes revealed by immunofluorescence staining using anti-Ly6G and anti-thrombin, anti-prothrombin, anti-factor X or anti-factor XIII. Scale bars, 1 μm. f, Thrombin activity assay using the internally quenched 5-FAM/QXL-520 FRET substrate of thrombin. nsNeuMigs, platelets and s-plasma were prepared and normalized with total protein, then mixed with the thrombin substrate for fluorescence detection by EnSpire microplate reader. Thrombin (0.5 U ml−1) served as a positive control. g, psNeuMigs, neutrophils and platelets were normalized with total protein and subjected to western blot analysis using antibodies against the indicated molecules. h, Diagram of the procedure for the digestion of purified migrasomes by proteinase K (PK) and subsequent incubation with s-plasma. ik, CESs (i), platelets (j) or nsNeuMigs (k) were isolated from mice and digested with 100 μg ml−1 PK at 37 °C for 30 min, then incubated with s-plasma at 37 °C for 1 h. The samples (pre-digestion (ctrl), PK digested (PK), PK digested then s-plasma incubated (PK_s-pla) and s-plasma (s-pla)) were subjected to western blot analysis using antibodies against the indicated molecules. The grey values for the western blots were quantified using ImageJ. Source numerical data and unprocessed blots are available in Source Data Fig. 2. NoDiff, no difference. Source data
Fig. 3
Fig. 3. Cholesterol ester determines the ability of neutrophil-derived migrasomes to adsorb coagulation factors.
a, Plot showing the differential abundance of lipids in plasma membranes of neutrophils (neu-membrane), erythrocytes, platelets and neutrophil-derived migrasomes. Total lipids were extracted from plasma membranes of neutrophils, erythrocytes, platelets and neutrophil-derived migrasomes and subjected to quantitative lipidomic analysis. The plot shows the ratio of each lipid to total lipids. n = 3 repeats. The data are presented as means ± s.e.m. b, Heat map of the distribution of lipids in plasma membranes of neutrophils, erythrocytes, platelets and neutrophil-derived migrasomes. c, Plot showing the differential abundance of cholesterol in plasma membranes of neutrophils, erythrocytes, platelets and neutrophil-derived migrasomes. n = 3 repeats. The data are presented as means ± s.e.m. d, Dragonfly confocal images of liposomes labelled with PE–Rhod (purple). Lipo-Mig contained PC, PE, PS, SM and ChE in similar ratios to neutrophil-derived migrasomes. Lipo-PLT was the same as Lipo-Mig except the ChE was replaced with cholesterol to mimic platelets. Lipo-Ctrl only contained PC, PE, PS and SM. Scale bars, 10 μm. e, Liposomes were incubated with s-plasma (37 °C for 1 h), then centrifuged down for western blot analysis using antibodies against coagulation factors. Numbers of liposomes (PE–Rhod+ vesicles) were counted by flow cytometry and the same number of each type of liposome was incubated with s-plasma. f, Dragonfly confocal images of liposomes labelled with PE–Rhod (purple). Lipo-Mem contained PC, PE, PS and SM in similar ratios to the plasma membranes of neutrophils. ChE was added to the composition of Lipo-Mem to make Lipo-MemC. Scale bars, 10 μm. g, Liposomes were incubated with s-plasma (37 °C for 1 h), then centrifuged down for western blot analysis using antibodies against coagulation factors. The numbers of liposomes (PE–Rhod+ vesicles) were counted by flow cytometry and the same number of liposomes from each sample was incubated with s-plasma. The western blot grey values were quantified using ImageJ. Source numerical data and unprocessed blots are available in Source Data Fig. 3. Cer, ceramide; DG, diglyceride; LPC, lysophosphatidylcholine; LPE, lysophosphatidylethanolamine; PC, phosphatidylcholine; PE, phosphatidylethanolamine; PG, phosphatidylglycerol; PI, phosphatidylinositol; PS, phosphatidylserine; SM, sphingomyelin; TG, triglyceride. Source data
Fig. 4
Fig. 4. Neutrophil-derived migrasomes activate platelets in vitro.
a,b, Flow cytometry analyses of platelet activation. Platelets were isolated from neutrophil-depleted mouse blood and stimulated with PBS, thrombin (1 U ml−1) or nsNeuMig (nsNeuMig:platelet = 1:2). Platelet activation is indicated by CD62P (a) and platelet morphology is indicated by SSC and FSC (b). c, Platelets activated by thrombin or neutrophil-derived migrasomes were stained with APC–anti-CD41 (cyan), PE–anti-CD62P (purple) and AF488–anti-Ly6G (yellow) and imaged by three-dimensional Dragonfly confocal microscopy. Scale bars, 20 μm. d, Measurement of the diameter and area of platelets (Ctrl) and platelet aggregates induced by thrombin and nsNeuMig. n = 104 platelets for Ctrl and n = 106 and n = 138 platelet aggregates for thrombin and nsNeuMig, respectively. e, SEM images of platelets activated in vitro by thrombin or nsNeuMig. Yellow arrowheads indicate migrasomes coated with anti-Ly6G-conjugated magnetic beads. Cyan arrowheads indicate platelets. Scale bar for the left three panels, 2 μm. The migrasomes and platelets in the dashed box are enlarged on the right (scale bar, 1 μm). f, Measurement of platelet protrusion length. n = 61 platelets for Ctrl, n = 64 platelets for thrombin and n = 62 platelets for nsNeuMig. g, Flow cytometry analysis of platelet activation. Platelets were isolated from neutrophil-depleted mouse blood and stimulated with PBS, thrombin or neutrophil-derived migrasomes (nsNeuMig:PLT = 1:2, 1:10, 1:20, 1:50, 1:100 or 1:300). Platelet activation is indicated by CD62P. All statistical data are presented as means ± s.e.m. P values were calculated using a two-tailed, unpaired t-test. Source numerical data are available in Source Data Fig. 4. Source data
Fig. 5
Fig. 5. Neutrophil-derived migrasomes are essential for coagulation.
a, Wounded lung imaging. AF488–WGA-labelled vessels (cyan), PE–anti-Ly6G (Gr1)-labelled neutrophil-derived migrasomes (yellow) and APC–anti-CD41-labelled platelets (purple) are shown. The dashed white lines indicate the wound boundary. Scale bar, 20 μm. b. Plot showing the ratio of platelets to neutrophil-derived migrasomes at injury sites. n = 20 fields of view. c, Diagram of the flow channel used for the in vitro flow assay. d, Dragonfly images of the flow assay. Scale bars, 50 μm. The dashed line indicates the boundary of collagen coating. e, Plot showing the ratio of platelets to neutrophil-derived migrasomes at collagen-coated sites. n = 7 mice. f, Western blot analysis of platelets and nsNeuMigs. g, Tail tip bleeding assay in control, neutrophil-depleted (anti-Ly6G) and platelet-depleted (anti-CD41) mice. Bloods were dripped on a clear plastic sheet for imaging. h, Statistical analysis of blood volume. n = 14 (Ctrl), 10 (anti-Ly6G) and 13 (anti-CD41) mice. i, Tail tip bleeding assay in control, neutrophil-depleted mice and mice injected with nsNeuMig (i.v.; 2 × 106 per mouse). j, Statistical analysis of blood volume. n = 20 mice per group. k, Dragonfly images of in vitro flow assay using blood from control and neutrophil-depleted mice. Scale bars, 50 μm. l, Measurement of CD41 intensity in the flow channel. n = 8 (Ctrl) and 12 (anti-Ly6G) mice. m, Quantification of neutrophil-derived migrasomes in Tspan9flox/flox;LysM-CreWT/WT (T9f/f;CreW/W) and Tspan9flox/flox;LysM-CreT/T (T9f/f;CreT/T) mouse blood by imaging flow cytometry analysis. n = 13 (T9f/f;CreW/W) and 16 (T9f/f;CreT/T) mice. n, Western blot analysis of nsNeuMigs isolated from T9f/f;CreW/W and T9f/f;CreT/T mice. Samples from ten mice were pooled and analysed together. o, Intravital imaging of neutrophil-derived migrasomes in the livers of T9f/f;CreW/W and T9f/f;CreT/T mice. Scale bars, 20 μm. p, Quantification of neutrophil-derived migrasomes in T9f/f;CreW/W and T9f/f;CreT/T mice. n = 395 (T9f/f;CreW/W) and 410 (T9f/f;CreT/T) cells from six mice each. q, Tail tip bleeding assay in each group. Scale bar, 1 cm. r, Statistical analysis of blood volumes. n = 18 (T9f/f;CreW/W) and 17 (other groups) mice. All statistical data are presented as means ± s.e.m, P values were calculated using a two-tailed, unpaired t-test. The data in b, e, h, j, l, p and r were pooled from three independent experiments. The grey values of the western blots were quantified using ImageJ. Source numerical data and unprocessed blots are available in Source Data Fig. 5. Source data
Fig. 6
Fig. 6. Human neutrophil-derived migrasomes play essential roles in coagulation.
a, Time-lapse imaging of neutrophils isolated from human blood. Neutrophils were seeded in dishes coated with fibronectin (10 μg ml−1 for 30 min) and labelled with APC–anti-CD16 and PE–anti-CD66b. Time interval, 45 s. Scale bars, 20 μm and 3 μm (inserts). b, Quantification of neutrophil-derived migrasomes and platelets in human peripheral blood. Human whole blood samples were stained with PE–anti-CD66b and APC–anti-CD41 for imaging flow cytometry analysis. The gating strategy was the same as for Fig. 1d. n = 20 humans. The data are presented as means ± s.e.m. c, SEM images of neutrophil-derived migrasomes isolated from human peripheral blood by positive selection using anti-CD66b-conjugated microbeads (Miltenyi Biotec). Anti-CD66b microbeads (top left) and platelets incubated with anti-CD66b microbeads (top right) served as controls. Scale bars, 1 μm. d, Neutrophil-derived migrasomes were isolated from human peripheral blood by negative selection, then stained with PE–anti-CD66b (purple) and APC–anti-CD41 (cyan) for imaging using the Dragonfly microscopy system. Scale bar, 10 μm. e, Volcano plot showing the differential abundance of proteins in isolated human neutrophil-derived migrasomes versus human platelets. The migrasomes and platelets were isolated and subjected to label-free quantitative mass spectrometry analysis. The purple dots represent a migrasome/platelet abundance ratio of ≥2 (P < 0.05) and the cyan dots represent a migrasome/platelet abundance ratio of ≤0.5 (P < 0.05). n = 3 biologically independent experiments. P values were calculated using a two-tailed, unpaired t-test. f, Heat map of the distribution of coagulation factors in human platelets and human neutrophil-derived migrasomes. g, Western blot analysis of coagulation factors and marker proteins for platelets or neutrophil-derived migrasomes in human platelets, human nsNeuMig (H-NeuMig) and human s-plasma. h,i, Flow cytometry analyses of platelet activation. Platelets were isolated from human peripheral blood and stimulated with PBS, thrombin (1 U ml−1) or H-NeuMig (Mig:PLT = 1:2). Platelet activation is indicated by CD62P (h) and platelet morphology is indicated by SSC and FSC (i). j, Platelets activated by thrombin or H-NeuMig were stained with the indicated antibodies and imaged by Dragonfly microscopy. Scale bars, 20 μm. The grey values of the western blots were quantified using ImageJ. Source numerical data and unprocessed blots are available in Source Data Fig. 6. Source data
Fig. 7
Fig. 7. Neutrophil-derived migrasome formation is markedly enhanced under infection or inflammation conditions.
a,b, Intravital imaging of neutrophils and neutrophil-derived migrasomes in the livers of control mice or mice infected with E. coli (i.p. injection of 1 × 109 c.f.u. in a) or treated with LPS (i.p. injection of 10 mg kg−1 LPS in b) for 3–4 h. Neutrophils and neutrophil-derived migrasomes were labelled with PE–anti-mouse Ly6G (Gr1; green) and blood vessels were labelled with AF647–WGA (purple). Scale bars, 20 μm. c,d, Quantification of blood neutrophil-derived migrasomes in control, LPS-treated (i.p.; 10 mg kg−1) and E. coli-infected (i.p.; 1 × 109 c.f.u.) mice using Amnis imaging flow cytometry analysis. Blood was collected 4 h after LPS or E. coli injection from the orbital sinus and stained with PE–anti-CD41 and either AF488–anti-Ly6G (c) or AF647–anti-Ly6B.2 (d) for analysis. n = 10 mice per group. The data are presented as means ± s.e.m. P values were calculated using a two-tailed, unpaired t-test. e, Neutrophil-derived migrasomes were negatively isolated from the same volume of blood from control, LPS-treated (i.p.; 10 mg kg−1) or E. coli-infected (i.p;. 1 × 109 c.f.u.) mice and analysed by western blotting using antibodies against marker proteins for migrasomes. Ten mice per group were studied. Samples were pooled per group for subsequent analysis. The grey values of the western blots were quantified using ImageJ. f, Diagram showing how neutrophil-derived migrasomes are involved in the coagulation system. Source numerical data and unprocessed blots are available in Source Data Fig. 7. exp, exposure. Source data
Extended Data Fig. 1
Extended Data Fig. 1. Isolation and characterization of neutrophil-derived migrasomes.
a, Flow cytometry analysis of the blood white cells after staining with PE-anti-Ly6G and APC-anti-CD41 by CytoFLEX. b, The CD41+ Ly6G+ population of the white cells was sorted by MoFlo-Astrios-EQ and imaged by Dragonfly confocal microscopy. Scale bar, 20 μm. c, Platelets were isolated and stained with PE-anti-Ly6G and APC-anti-CD41 for Dragonfly imaging. Scale bar, 10 μm. d, Diagram of the procedures for preparing CES from the blood of platelet-depleted mice (left), and for purifying platelets from the blood of neutrophil-depleted mice (right). e, Flow cytometry analysis of whole blood cells from control (left panels), neutrophil-depleted (middle panels), and platelet-depleted mice (right panels) after staining with PE-anti-Ly6G or APC-anti-CD41. Samples from five mice were pooled and analyzed together. f, Flow cytometry analysis of purified platelets (PLTs) and CES after staining with PE-anti-Ly6G and APC-anti-CD41. Samples from five mice were pooled and analyzed together. g-h, SEM image of CESs (g) or platelets (h). These results come from the same experiments as Fig. 1g, h. Scale bar, 1 μm. i, SEM images of nsNeuMigs which were incubated with anti-Ly6G-conjugated magnetic beads. Scale bar, 10 μm. The migrasome in the dashed-box is enlarged at the left. Scale bar, 1 μm. j, SEM images of NETs. Scale bar, 5 μm (left); 1 μm (enlarged). k, Immunofluorescence staining images of migrasomes and NETs. Scale bar, 20 μm. l, SEM image of NMPs. Scale bar, 1 μm. m-n, Dragonfly confocal images of nsNeuMigs (m) or NMPs (n) stained with PE-anti-Ly6G (Gr1) and Annexin V-FITC. Scale bar, 20 μm. o. NMPs were compared with nsNeuMig by western blot analysis. The samples were normalized with total protein level. Gray values of western blots were quantified by Image J. Source unprocessed blots are available in source data. Source data
Extended Data Fig. 2
Extended Data Fig. 2. Coagulation factors are enriched in neutrophil-derived migrasomes.
a, Western blot analysis of coagulation factors in platelets, nsNeuMig, and s-plasma. S-plasma is the supernatant after centrifuging plasma at 20,000 g for 1 hour. b, Dragonfly confocal microscopy images of nsNeuMigs revealed by immunofluorescence staining (IF). These results come from the same experiments as Fig. 2e. Migrasomes were negatively isolated and fixed with 4% paraformaldehyde for IF using anti-Ly6G and anti-thrombin, anti-prothrombin, anti-factor X and anti-factor XIII. Scale bar, 10 μm. Western blot gray values were quantified by Image J. Source unprocessed blots are available in source data. Source data
Extended Data Fig. 3
Extended Data Fig. 3. Migrasome-mimicking liposomes (Lipo-Mig) activate platelets in vitro.
Flow cytometry analysis of platelet activation. Platelets were isolated from neutrophil-depleted mouse blood and stimulated with PBS, thrombin (1 U/mL), Lipo-Mig (1:2), or s-plasma-incubated Lipo-Mig. Platelet activation is indicated by CD62P. Source data
Extended Data Fig. 4
Extended Data Fig. 4. Neutrophil-derived migrasomes accumulate at injury site by directly adhere to the ECMs.
a, b, d, Intravital imaging of non-wounded liver (a), wounded liver (b) or kidney (d). AF488-WGA labels blood vessels, PE-anti-Ly6G (Gr1) labels neutrophil-derived migrasomes, and APC-anti-CD41 labels platelets. Scale bar, 20 μm (a, b), 50 μm (d). The dashed-white-line indicates the wound boundary. c, e. Quantification of the ratio of platelets to neutrophil-derived migrasomes at the liver (c) or kidney (e) injury site. n = 17 mice (c), n = 15 field-of-views from 3 mice (e). f, Imaging of exogenous-injected neutrophil-migrasomes in wounded liver. Scale bar, 20 μm. g, Imaging of platelets and neutrophil-derived migrasomes within whole blood which were placed in non-coated channels. Scale bar, 20 μm. h, Quantification of the ratio of platelets to migrasomes in non-coated channels with no flow. n = 5 mice. i, l. Dragonfly images present the in vitro flow assay using ctrl and GFOGER (200 μg/mL for 30 min) (i) or anti-integrin α2 (HMα2) (5 μg/mL for 25 min) (l) treated blood. Scale bar, 10 μm. j, m. Statistical analysis of the number of neutrophil-derived migrasomes accumulated at collagen exposing site in each group. n = 35 (Ctrl) 40 (GFOGER) 55 (Ctrl) 57 (anti-integrin α2) field-of-views. k, Heat map of the distribution of adhesion molecules in platelets and neutrophil-derived migrasomes revealed by quantitative mass spectrometry analysis. n-o. Confocal images of nsNeuMigs revealed by immunofluorescence staining. Scale bar, 1 μm. p. Diagram showing how the FRET assay assess the conformation of integrins. q, s. Confocal images of neutrophils and in vitro generated migrasomes (q), or isolated human neutrophil-derived migrasomes, neutrophils and platelets (s) revealed by immunofluorescence staining using anti-integrin β1 (AIIB2-Fab), anti-CD66b and FM4-64-FX before bleach. Scale bar, 10 μm (q), 5 μm (s). r, t. FRET measurement of the samples in q and s. n = 20 for each group. All of the statistical data are presented as the mean ± s.e.m, P values were calculated using the two-tailed, unpaired t-test. Data were pooled from six (c), three (e, j, k), and four (m) independent experiments. Source numerical data are available in source data. Source data
Extended Data Fig. 5
Extended Data Fig. 5. Neutrophil-depletion lead to the dramatic decrease of neutrophil-derived migrasomes.
a-b, Flow cytometry analysis of whole blood cells from control mice and neutrophil-depleted mice (a) or platelet-depleted mice (b) after staining with FITC-anti-Ly6B.2 and PE-anti-Ly6G (a), or FITC-anti-CD61 and APC-anti-CD41 (b). Samples from five mice were pooled and analyzed together. c-d, Quantification of the number of neutrophil-derived migrasomes in ctrl and neutrophil-depleted mice revealed by imaging-flow cytometry analysis. Mouse blood samples were collected and stained with AF488-anti-Ly6G, PE-anti-CD41 and AF647-anti-Ly6B.2 for analysis. n = 5 mice for each group. e, Crude migrasomes were isolated from the same volume of blood from control or neutrophil-depleted mice, and then analyzed by western blotting using antibodies against integrin α5 and Ly6G. f, Dragonfly confocal images of crude migrasomes stained with PE-anti-Ly6G. Scale bar, 20 μm. g, Quantification of the number of neutrophil-derived migrasomes in images of crude migrasomes stained with PE-anti-Ly6G. Samples were pooled from 5 mice for each group. n = 10 field-of-views for each group. h, Dragonfly confocal images of crude migrasomes stained with Alexa Fluor 647-anti-Ly6B.2. Scale bar, 20 μm. i, Quantification of the number of neutrophil-derived migrasomes in images of crude migrasomes stained with AF647-anti-Ly6B.2. Samples were pooled from 5 mice for each group. n = 10 field-of-views for each group. j, Stitch Dragonfly confocal imaging of liver wounds in control mice, neutrophil-depleted (anti-Ly6G) mice, and neutrophil-depleted mice rescued with nsNeuMigs (i.v. 2 × 106 per mouse). AF488-WGA labels vessels; APC-anti-CD41 labels platelets. Scale bar, 200 μm. Dashed white lines indicate the wound boundaries. k, Statistical analysis of the relative fluorescence intensity of CD41 (platelets) enriched around the wound boundaries; n = 8 mice for each group. All of the statistical data are presented as the mean ± s.e.m, P values were calculated using the two-tailed, unpaired t-test. Gray values of western blots were quantified by Image J. Source numerical data and unprocessed blots are available in source data. Source data
Extended Data Fig. 6
Extended Data Fig. 6. Tspan9 is expressed in neutrophils.
a-c, Northern blot analysis of Tspan9 and Actb in mRNAs extracted from platelets, bone marrow neutrophils and spleen neutrophils isolated from WT, Tspan9-/-, T9f/f; CreW/W and T9f/f; CreT/T mice. Northern blotting was performed on mRNA extracted from 3.6 μg platelet total RNA and 10 μg neutrophil total RNA. d, Q-PCR analysis of Tspan9 in platelets and neutrophils isolated from WT and Tspan9-/- mice. n = 3 independent experiments. e, Q-PCR analysis of Tspan9 in platelets and neutrophils isolated from T9f/f; CreW/W and T9f/f; CreT/T mice. n = 3 independent experiments. f, RNA sequencing analysis of Tspan9 in mRNAs extracted from WT blood neutrophils and Tspan9-/- blood neutrophils. Samples from 5 mice were pooled and analyzed together. g. Mass spectrometry analysis of neutrophils and platelets. Bone marrow neutrophils, blood neutrophils, spleen neutrophils and platelets were isolated from WT and Tspan9-/- mice respectively and subjected to mass spectrometry analysis. The identified peptides were validated specifically aligned with Tspan9 using BLAST searching in UniProt and NCBI database. h. Diagram of the HA tag knock-in strategy at the C-terminus of Tspan9. i. Western blot analysis of platelets and various neutrophils isolated from control and Tspan9-HA knock-in mice using indicated antibodies. Gray values of western blots were quantified by Image J. The gray values are normalized to actin. All statistical data are presented as the mean ± s.e.m. P values indicated in plots were calculated using the two-tailed, unpaired t-test. Source numerical data and unprocessed blots are available in source data. Source data
Extended Data Fig. 7
Extended Data Fig. 7. Tspan9 regulates neutrophil-derived migrasomes and is involved in coagulation.
a, Quantification of neutrophil-derived migrasomes in blood from WT and Tspan9-/- mice by imaging-flow cytometry analysis; n = 12 mice for WT, n = 11 mice for Tspan9-/-. b, Western blot analysis of nsNeuMigs isolated from the same volume blood of WT and Tspan9-/- mice using antibodies against the indicated molecules. Samples from 10 mice were pooled and analyzed together. Gray values of western blots were quantified by Image J. c, Tail-tip bleeding assay in WT and Tspan9-/- mice. Blood was dripped onto a clear plastic sheet for imaging. d, Statistical analysis of blood volumes. Data were pooled from four independent experiments. n = 45 mice for each group. e, Tail-tip bleeding assay in WT, Tspan9-/- and nsNeuMig-injected (i.v. 2 × 106 per mouse) mice. Blood was dripped onto a clear plastic sheet for imaging. f, Statistical analysis of bleeding volume. Data were pooled from four independent experiments. n = 20 mice for each group. g, Stitch imaging of liver wounds in WT, Tspan9-/- and nsNeuMig-injected (i.v. 2 × 106 per mouse) mice. AF488-WGA labels vessels; PE-anti-Ly6G (Gr1) labels neutrophils and migrasomes; APC-anti-CD41 labels platelets. Scale bar, 200 μm. Dashed white lines indicate the wound boundaries. h, Statistical analysis of relative fluorescence intensity of CD41 (platelets) enriched around the wound boundaries. n = 6 mice for the WT group; n = 7 mice for the Tspan9-/- and Tspan9-/- + nsNeuMig groups. i, Tail-tip bleeding assay in T9f/f; CreW/W and T9f/f; CreT/T mice. Blood was dripped on a clear plastic sheet for imaging. j, Statistical analysis of bleeding volumes. Data were pooled from four independent experiments. n = 43 mice in T9f/f; CreW/W group; n = 42 mice in T9f/f; CreT/T group. All statistical data are presented as the mean ± s.e.m. P values were calculated using the two-tailed, unpaired t-test. Source numerical data and unprocessed blots are available in source data. Source data

References

    1. Versteeg HH, Heemskerk JW, Levi M, Reitsma PH. New fundamentals in hemostasis. Physiol. Rev. 2013;93:327–358. doi: 10.1152/physrev.00016.2011. - DOI - PubMed
    1. Mussbacher, M., Kral-Pointner, J. B., Salzmann, M., Schrottmaier, W. C. & Assinger, A. in Fundamentals of Vascular Biology (ed. Geiger, M.) 145–169 (Springer International Publishing, 2019).
    1. Davie EW, Ratnoff OD. Waterfall sequence for intrinsic blood clotting. Science. 1964;145:1310–1312. doi: 10.1126/science.145.3638.1310. - DOI - PubMed
    1. Macfarlane RG. An enzyme cascade in the blood clotting mechanism, and its function as a biochemical amplifier. Nature. 1964;202:498–499. doi: 10.1038/202498a0. - DOI - PubMed
    1. Ma L, et al. Discovery of the migrasome, an organelle mediating release of cytoplasmic contents during cell migration. Cell Res. 2015;25:24–38. doi: 10.1038/cr.2014.135. - DOI - PMC - PubMed

Publication types

Substances

LinkOut - more resources