. 2024 Sep;8(9):1654-1666.
doi: 10.1038/s41559-024-02461-1. Epub 2024 Jul 12.

The nature of the last universal common ancestor and its impact on the early Earth system

Affiliations

The nature of the last universal common ancestor and its impact on the early Earth system

Edmund R R Moody et al. Nat Ecol Evol. 2024 Sep.

Abstract

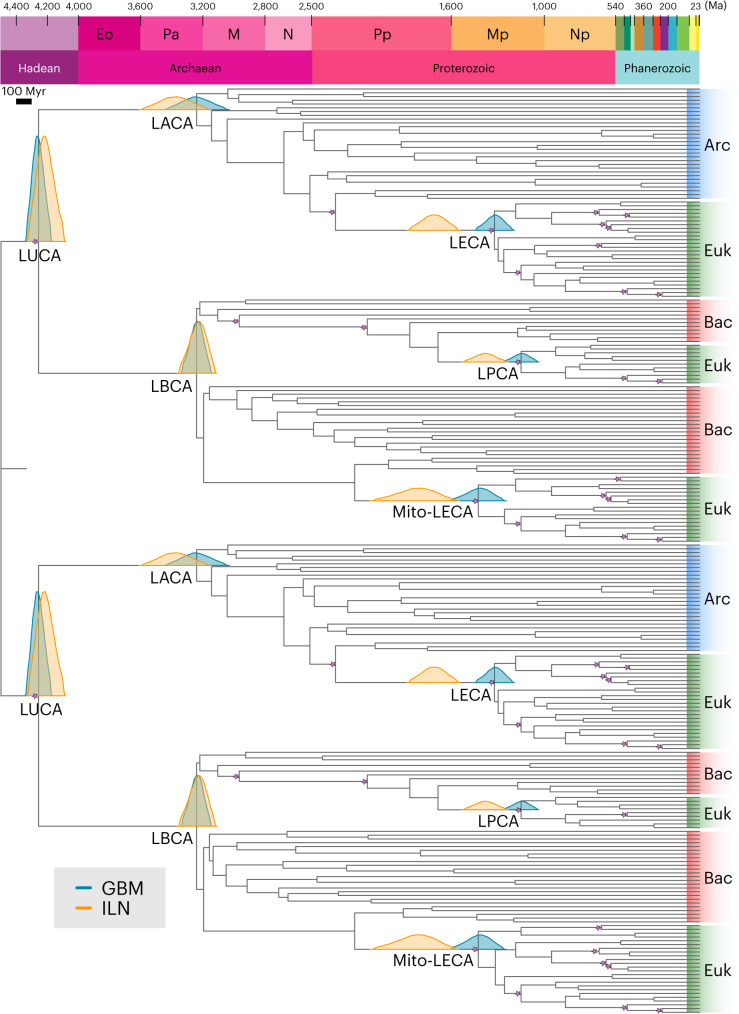
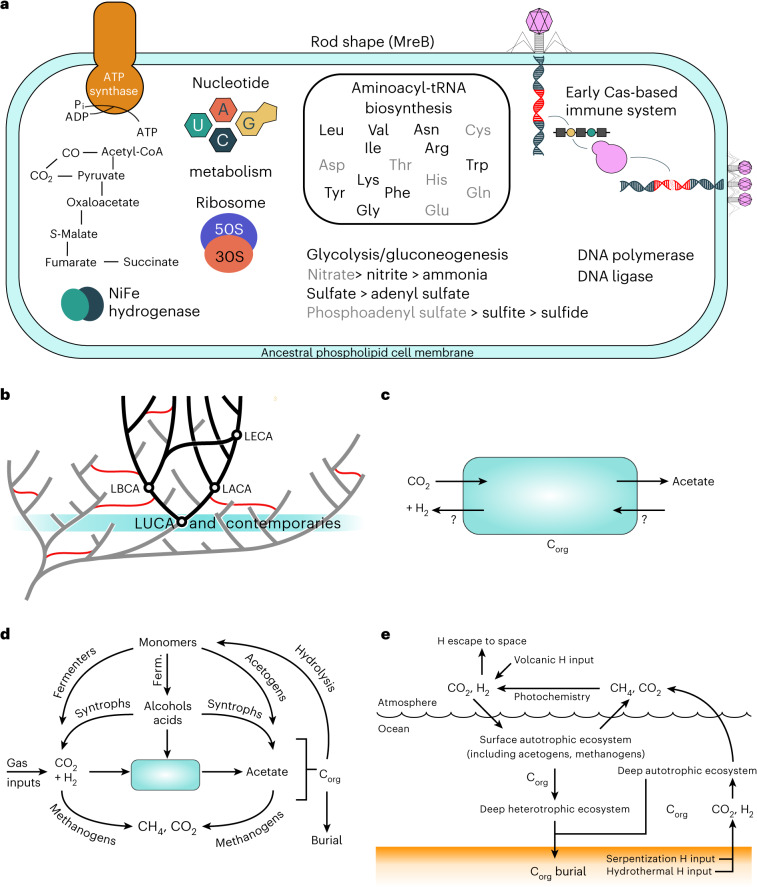
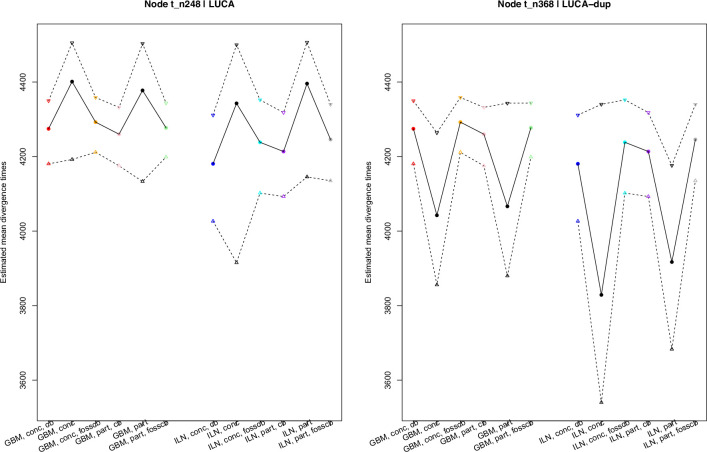
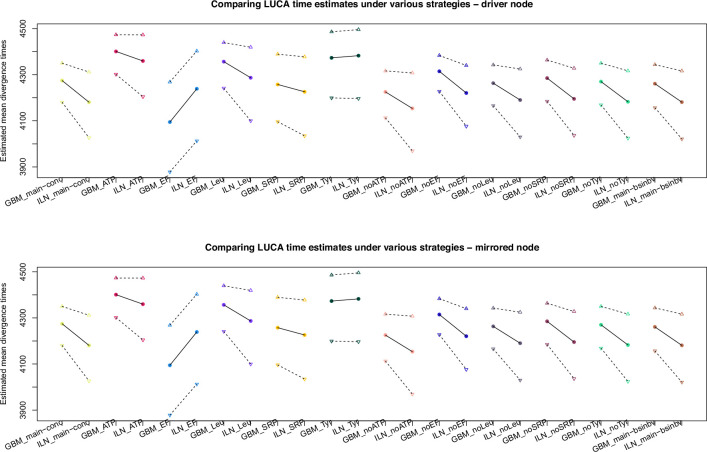
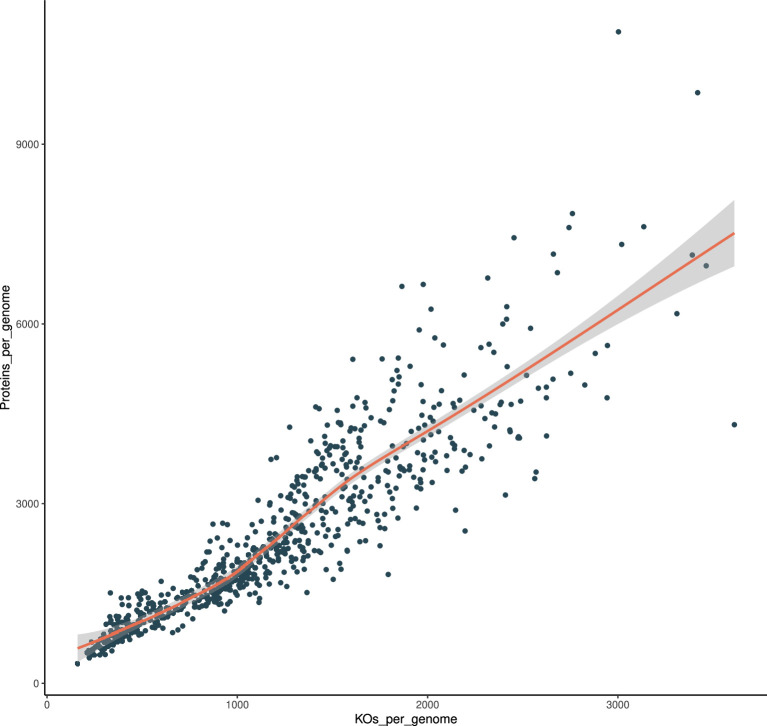
The nature of the last universal common ancestor (LUCA), its age and its impact on the Earth system have been the subject of vigorous debate across diverse disciplines, often based on disparate data and methods. Age estimates for LUCA are usually based on the fossil record, varying with every reinterpretation. The nature of LUCA's metabolism has proven equally contentious, with some attributing all core metabolisms to LUCA, whereas others reconstruct a simpler life form dependent on geochemistry. Here we infer that LUCA lived ~4.2 Ga (4.09-4.33 Ga) through divergence time analysis of pre-LUCA gene duplicates, calibrated using microbial fossils and isotope records under a new cross-bracing implementation. Phylogenetic reconciliation suggests that LUCA had a genome of at least 2.5 Mb (2.49-2.99 Mb), encoding around 2,600 proteins, comparable to modern prokaryotes. Our results suggest LUCA was a prokaryote-grade anaerobic acetogen that possessed an early immune system. Although LUCA is sometimes perceived as living in isolation, we infer LUCA to have been part of an established ecological system. The metabolism of LUCA would have provided a niche for other microbial community members and hydrogen recycling by atmospheric photochemistry could have supported a modestly productive early ecosystem.


Conflict of interest statement

The authors declare no competing interests.

Figures

Fig. 1
Fig. 1. Timetree inferred under a Bayesian node-dating approach with cross-bracing using a partitioned dataset of five pre-LUCA paralogues.
Our results suggest that LUCA lived around 4.2 Ga, with a 95% confidence interval spanning 4.09–4.33 Ga under the ILN relaxed-clock model (orange) and 4.18–4.33 Ga under the GBM relaxed-clock model (teal). Under a cross-bracing approach, nodes corresponding to the same species divergences (that is, mirrored nodes) have the same posterior time densities. This figure shows the corresponding posterior time densities of the mirrored nodes for the last universal, archaeal, bacterial and eukaryotic common ancestors (LUCA, LACA, LBCA and LECA, respectively); the last common ancestor of the mitochondrial lineage (Mito-LECA); and the last plastid-bearing common ancestor (LPCA). Purple stars indicate nodes calibrated with fossils. Arc, Archaea; Bac, Bacteria; Euk, Eukarya.
Fig. 2
Fig. 2. Probabilistic estimates of metabolic networks from modern life that were present in LUCA.
In black: enzymes and metabolic pathways inferred to be present in LUCA with at least PP = 0.75, with sampling in both prokaryotic domains. In grey: those inferred in our least-stringent threshold of PP = 0.50. The analysis supports the presence of a complete WLP and an almost complete TCA cycle across multiple confidence thresholds. Metabolic maps derived from KEGG database through iPath. GPI, glycosylphosphatidylinositol; DDT, 1,1,1-trichloro-2,2-bis(p-chlorophenyl)ethane.
Fig. 3
Fig. 3. A reconstruction of LUCA, within its evolutionary and ecological context.
a, A representation of LUCA based on our ancestral gene content reconstruction. Gene names in black have been inferred to be present in LUCA under the most-stringent threshold (PP = 0.75, sampled in both domains); those in grey are present at the least-stringent threshold (PP = 0.50, without a requirement for presence in both domains). b, LUCA in the context of the tree of life. Branches on the tree of life that have left sampled descendants today are coloured black, those that have left no sampled descendants are in grey. As the common ancestor of extant cellular life, LUCA is the oldest node that can be reconstructed using phylogenetic methods. It would have shared the early Earth with other lineages (highlighted in teal) that have left no descendants among sampled cellular life today. However, these lineages may have left a trace in modern organisms by transferring genes into the sampled tree of life (red lines) before their extinction. c, LUCA’s chemoautotrophic metabolism probably relied on gas exchange with the immediate environment to achieve organic carbon (Corg) fixation via acetogenesis and it may also have run the metabolism in reverse. d, LUCA within the context of an early ecosystem. The CO2 and H2 that fuelled LUCA’s plausibly acetogenic metabolism could have come from both geochemical and biotic inputs. The organic matter and acetate that LUCA produced could have created a niche for other metabolisms, including ones that recycled CO2 and H2 (as in modern sediments). e, LUCA in an Earth system context. Acetogenic LUCA could have been a key part of both surface and deep (chemo)autotrophic ecosystems, powered by H2. If methanogens were also present, hydrogen would be released as CH4 to the atmosphere, converted to H2 by photochemistry and thus recycled back to the surface ecosystem, boosting its productivity. Ferm., fermentation.
Extended Data Fig. 1
Extended Data Fig. 1. Comparison of the mean divergence times and confidence intervals estimated for the two duplicates of LUCA under each timetree inference analysis.
Black dots refer to estimated mean divergence times for analyses without cross-bracing, stars are used to identify those under cross-bracing and triangles for estimated upper and lower confidence intervals. Straight lines are used to link mean divergence time estimates across the various inference analyses we carried out, while dashed lines are used to link the estimated confidence intervals. The node label for the driver node is “248”, while it is “368” for the mirror node, as shown in the title of each graph. Coloured stars and triangles are used to identify which LUCA time estimates were inferred under the same cross-braced analysis for the driver-mirror nodes (that is, equal time and CI estimates). Black dots and triangles are used to identify those inferred when cross-bracing was not enabled (that is, different time and CI estimates). -Abbreviations. “GBM”: Geometric Brownian motion relaxed-clock model; “ILN”: Independent-rate log-normal relaxed-clock model; “conc, cb” dots/triangles: results under cross-bracing A when the concatenated dataset was analysed under GBM (red) and ILN (blue); “conc, fosscb”: results under cross-bracing B when the concatenated dataset was analysed under GBM (orange) and ILN (cyan); “part, cb” dots/triangles: results under cross-bracing A when the partitioned dataset was analysed under GBM (pink) and ILN (purple); “part, fosscb”: results under cross-bracing B when the concatenated dataset was analysed under GBM (light green) and ILN (grey); black dots and triangles: results when cross-bracing was not enabled for both concatenated and partitioned datasets.
Extended Data Fig. 2
Extended Data Fig. 2. Comparison of the posterior time estimates and confidence intervals for the two duplicates of LUCA inferred under the main calibration strategy cross-bracing A with the concatenated dataset and with the datasets for the three additional sensitivity analyses.
Dots refer to estimated mean divergence times and triangles to estimated 2.5% and 97.5% quantiles. Straight lines are used to link the mean divergence times estimated in the same analysis under the two different relaxed-clock models (GBM and ILN). Labels in the x axis are informative about the clock model under which the analysis ran and the type of analysis we carried (see abbreviations below). Coloured dots are used to identify which time estimates were inferred when using the same dataset and strategy under GBM and ILN, while triangles refer to the corresponding upper and lower quantiles for the 95% confidence interval. -Abbreviations. “GBM”: Geometric Brownian motion relaxed-clock model; “ILN”: Independent-rate log-normal relaxed-clock model; “main-conc”: results obtained with the concatenated dataset analysed in our main analyses under cross-bracing A; “ATP/EF/Leu/SRP/Tyr”: results obtained when using each gene alignment separately; “noATP/noEF/noLeu/noSRP/noTyr”: results obtained when using concatenated alignments without the gene alignment mentioned in the label as per the “leave-one-out” strategy; “main-bsinbv”: results obtained with the concatenated dataset analysed in our main analyses when using branch lengths, Hessian, and gradient calculated under a more complex substitution model to infer divergence times.
Extended Data Fig. 3
Extended Data Fig. 3. Maximum Likelihood species tree.
The Maximum Likelihood tree inferred across three independent runs, under the best fitting model (according to BIC: LG + F + G + C60) from a concatenation of 57 orthologous proteins, support values are from 10,000 ultrafast bootstraps. Referred to as topology I in the main text. Tips coloured according to taxonomy: Euryarchaeota (teal), DPANN (purple), Asgardarchaeota (cyan), TACK (blue), Gracilicutes (orange), Terrabacteria (red), DST (brown), CPR (green).
Extended Data Fig. 4
Extended Data Fig. 4. Maximum Likelihood tree for focal reconciliation analysis.
Maximum Likelihood tree (topology II in the main text), where DPANN is constrained to be sister to all other Archaea, and CPR is sister to Chloroflexi. Tips coloured according to taxonomy: Euryarchaeota (teal), DPANN (purple), Asgardarchaeota (cyan), TACK (blue), Gracilicutes (orange), Terrabacteria (red), DST (brown), CPR (green). AU topology test, P = 0.517, this is a one-sided statistical test.
Extended Data Fig. 5
Extended Data Fig. 5. The relationship between the number of KO gene families encoded on a genome and its size.
LOESS regression of the number of KOs per sampled genome against the genome size in megabases. We used the inferred relationship for modern prokaryotes to estimate LUCA’s genome size based on reconstructed KO gene family content, as described in the main text. Shaded area represents the 95% confidence interval.
Extended Data Fig. 6
Extended Data Fig. 6. The relationship between the number of KO gene families encoded on a genome and the total number of protein-coding genes.
LOESS regression of the number of KOs per sampled genome against the number of proteins encoded for per sampled genome. We used the inferred relationship for modern prokaryotes to estimate the total number of protein-coding genes encoded by LUCA based on reconstructed KO gene family content, as described in the main text. Shaded area represents the 95% confidence interval.

Similar articles

Cited by

References

    1. Theobald, D. L. A formal test of the theory of universal common ancestry. Nature465, 219–222 (2010). - PubMed
    1. Woese, C. R. & Fox, G. E. The concept of cellular evolution. J. Mol. Evol.10, 1–6 (1977). - PubMed
    1. Mirkin, B. G., Fenner, T. I., Galperin, M. Y. & Koonin, E. V. Algorithms for computing parsimonious evolutionary scenarios for genome evolution, the last universal common ancestor and dominance of horizontal gene transfer in the evolution of prokaryotes. BMC Evol. Biol.3, 2 (2003). - PMC - PubMed
    1. Ouzounis, C. A., Kunin, V., Darzentas, N. & Goldovsky, L. A minimal estimate for the gene content of the last universal common ancestor—exobiology from a terrestrial perspective. Res. Microbiol.157, 57–68 (2006). - PubMed
    1. Gogarten, J. P. & Deamer, D. Is LUCA a thermophilic progenote? Nat. Microbiol1, 16229 (2016). - PubMed

LinkOut - more resources