. 2024 Aug;9(8):2099-2112.
doi: 10.1038/s41564-024-01755-1. Epub 2024 Jul 12.

A safe, effective and adaptable live-attenuated SARS-CoV-2 vaccine to reduce disease and transmission using one-to-stop genome modifications

Affiliations

A safe, effective and adaptable live-attenuated SARS-CoV-2 vaccine to reduce disease and transmission using one-to-stop genome modifications

Jacob Schön et al. Nat Microbiol. 2024 Aug.

Abstract

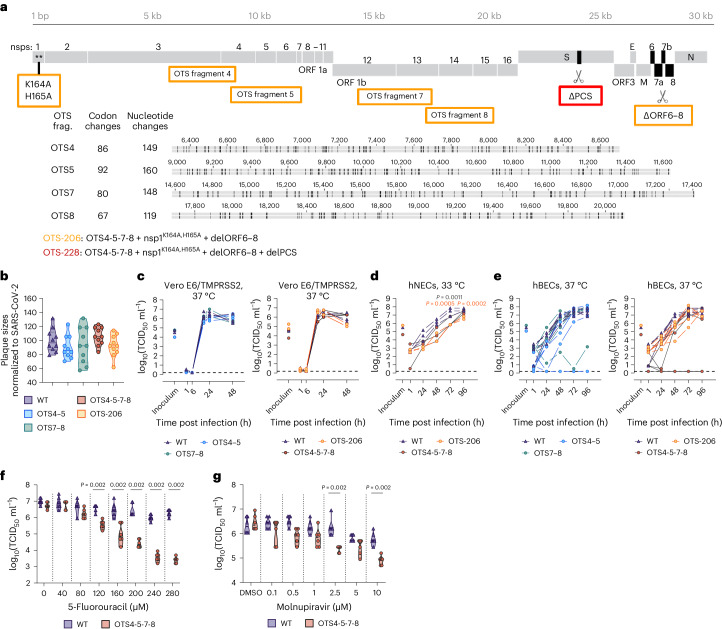
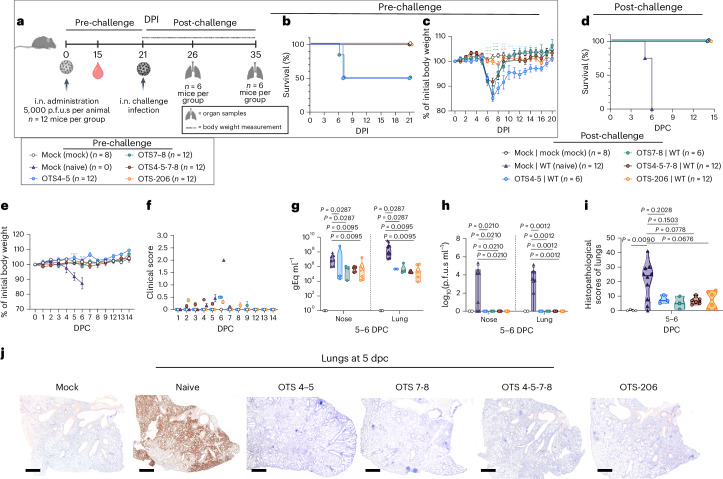
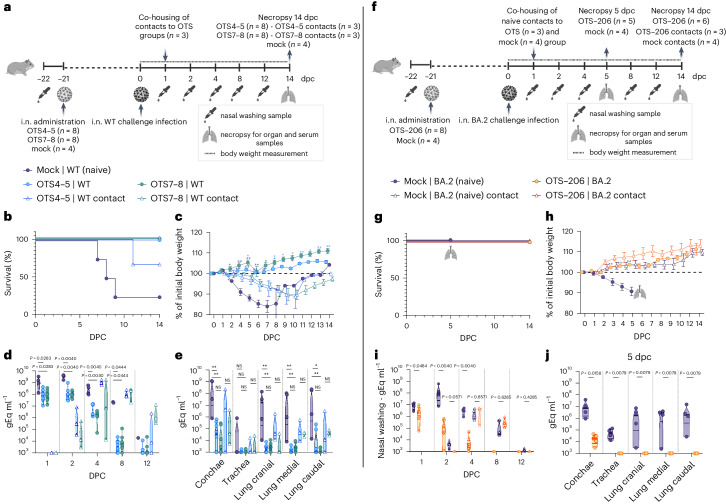
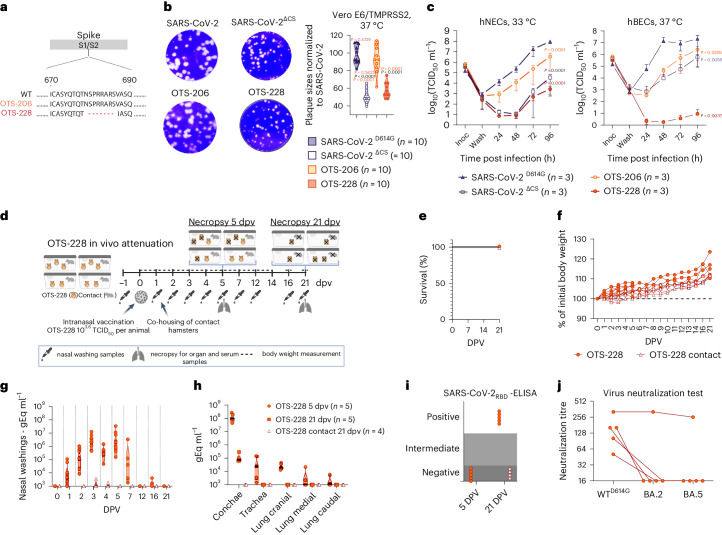
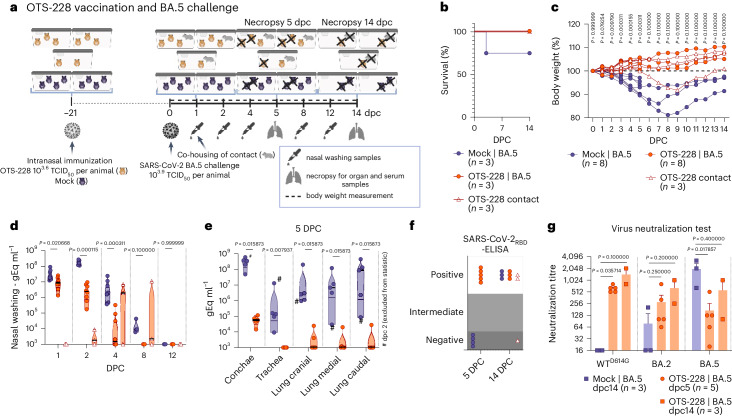
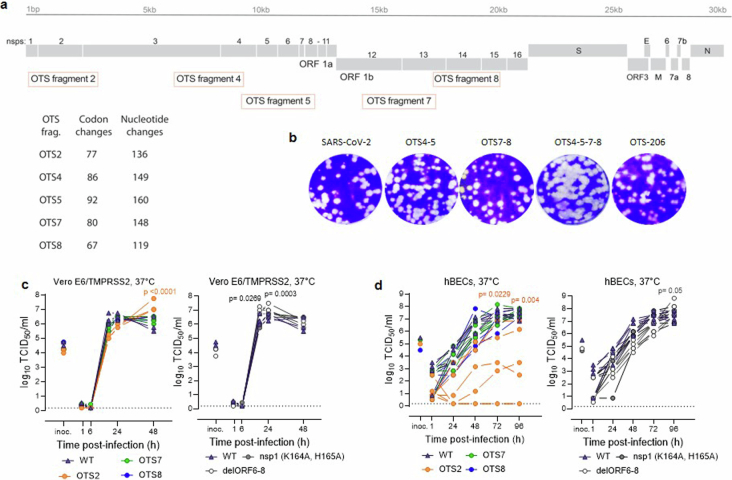
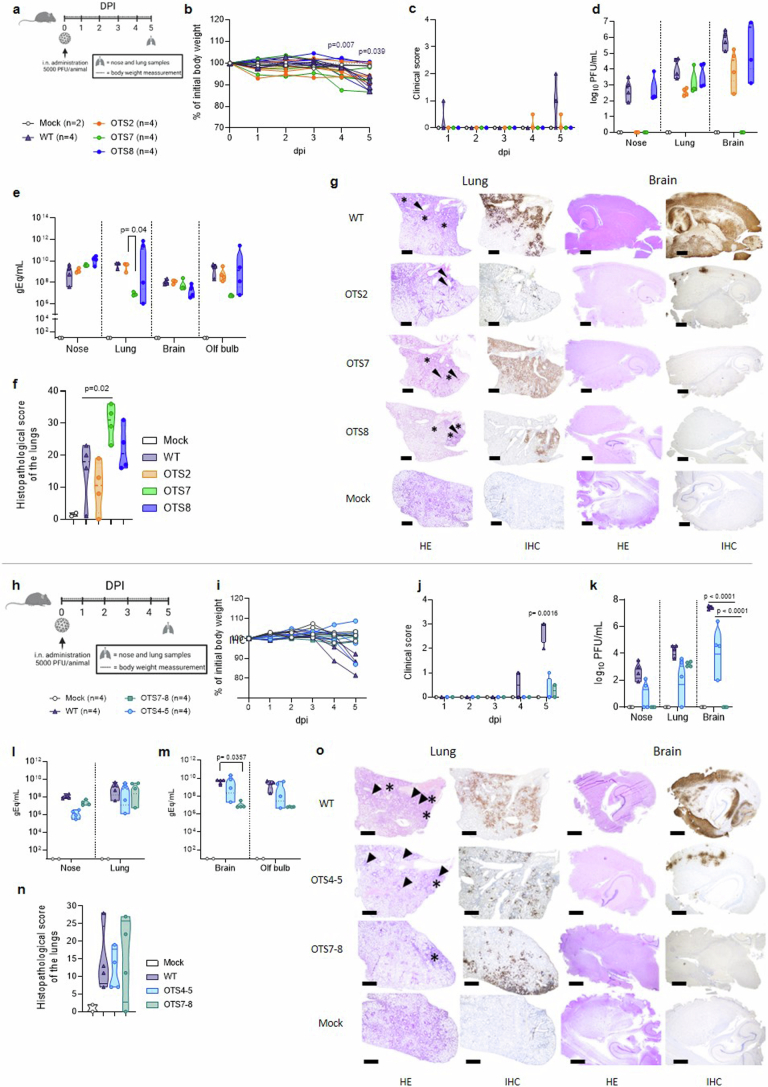
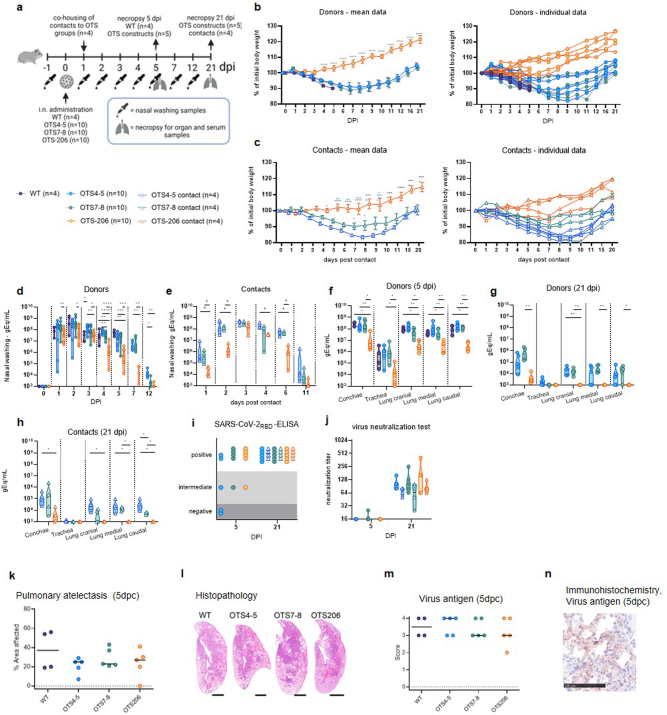
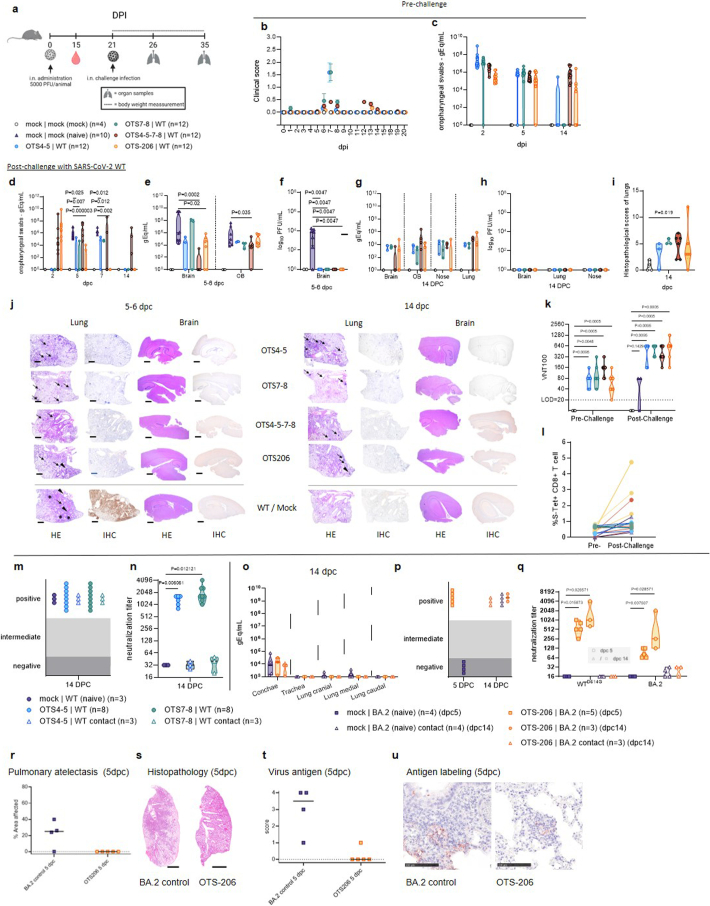
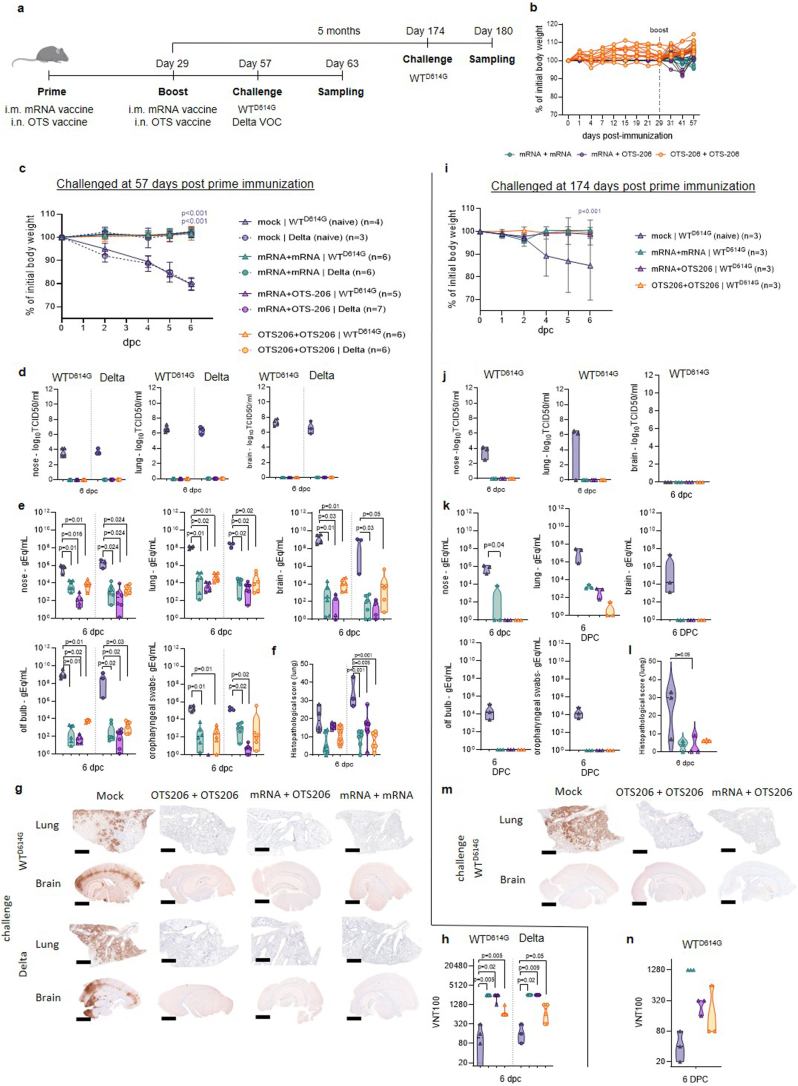
Approved vaccines are effective against severe COVID-19, but broader immunity is needed against new variants and transmission. Therefore, we developed genome-modified live-attenuated vaccines (LAV) by recoding the SARS-CoV-2 genome, including 'one-to-stop' (OTS) codons, disabling Nsp1 translational repression and removing ORF6, 7ab and 8 to boost host immune responses, as well as the spike polybasic cleavage site to optimize the safety profile. The resulting OTS-modified SARS-CoV-2 LAVs, designated as OTS-206 and OTS-228, are genetically stable and can be intranasally administered, while being adjustable and sustainable regarding the level of attenuation. OTS-228 exhibits an optimal safety profile in preclinical animal models, with no side effects or detectable transmission. A single-dose vaccination induces a sterilizing immunity in vivo against homologous WT SARS-CoV-2 challenge infection and a broad protection against Omicron BA.2, BA.5 and XBB.1.5, with reduced transmission. Finally, this promising LAV approach could be applicable to other emerging viruses.


Conflict of interest statement

Related to this work, the University of Bern has filed a patent application for the use of OTS-206 and OTS-228 as vaccine. In this application, J.S., G.T.B., B.S.T., N.J.H., A.K., L.U., F.L., J.J., N.E., D.H., M.B. and V.T. are named as inventors. The University of Bern and the Friedrich-Loeffler Institute are collaborating with RocketVax AG for the development of OTS vaccines and receive funding for research. V.T. is consulting for RocketVax AG. P.V. and V.C. are employees of RocketVax AG. The remaining authors declare no competing interests.

Figures

Fig. 1
Fig. 1. OTS constructs exhibit similar replication kinetics to WT in vitro but are more sensitive to mutagenic drugs.
a, Overview of mutations introduced into the SARS-CoV-2 genome to generate LAVs. Fragments 4, 5, 7 and 8 were modified to generate one-to-stop codons. Specific changes are indicated for each fragment. OTS-206 also has additional Nsp1 mutations (K164A/H165A) and deletions of ORF6 to ORF8. OTS-228 is additionally missing the PCS. b, Violin plot of individual plaque sizes in Vero E6/TMPRSS2 cells. Mean plaque sizes (indicated by a line) were comparable between OTS and WT viruses (n = 10 plaques measured per group). No significant difference was found using ordinary one-way ANOVA and P values were adjusted using Tukey’s multiple-comparisons test. ce, Growth kinetics of WT and OTS viruses in Vero E6/TMPRSS2 cells (c) (n = 3 independent biological replicates per group), hNECs (d) (n = 3 independent biological replicates per group) and hBECs (e) (n = 6; 3 independent biological replicates from 2 donors per group). Samples were collected at designated timepoints and assessed for infectious particle titres using TCID50. Graphs show each biological replicate. Statistical analysis was performed using two-way ANOVA. f,g, Treatment of Vero E6/TMPRSS2 cells with 5-fluorouracil (5-FU) and molnupiravir (n = 6 independent biological replicates per group), followed by infection with WT or OTS4-5-7-8, indicating a higher sensitivity of OTS-4-5-7-8 to 5-FU and molnupiravir. Statistical significance was assessed using two-sided, unpaired, non-parametric multiple t-test with Mann–Whitney test (compared ranks). *P < 0.05, **P < 0.01, ***P < 0.001, ****P < 0.0001. Additional data in Extended Data Fig. 1. Source data
Fig. 2
Fig. 2. Immunization with OTS constructs provides full protection against SARS-CoV-2 challenge in sensitive preclinical K18-hACE2 mice model.
a, Intranasal inoculation of age-matched K18-hACE2 mice (n = 12 mice per group) with OTS4–5, OTS7–8, OTS4-5-7-8 and OTS-206, and subsequent challenge with WT at 21 dpi (n = 12 mice per group, n = 6 mice in OTS4–5 and OTS7–8 groups). A mock (vaccinated and challenged with culture media) and a naïve control group (vaccinated with only media, but infected with challenge virus) were included. Data were obtained from one experiment. Overview created with BioRender.com. b,c, Pre-challenge survival (b, %) and body weight (c) (n = 12 mice (OTS), n = 8 (mock), group mean ± s.e.m.) loss showed correlation between increased OTS modifications and improved outcomes. d,e, All OTS constructs provided full protection against challenge infection in terms of survival (d) and body weight (e) (n = 12 mice in naïve, OTS-4-5-7-8, OTS-206 and OTS4–5 (until 7 dpi) and OTS7–8 (until 6 dpi) groups; n = 6 mice in OTS4–5 (from 7 dpi onwards), n = 10 mice in OTS7–8 at 6 dpi and n = 6 mice from 7 dpi onwards; n = 8 mice in the mock group) (group mean ± s.e.m.). f, Clinical scores post challenge were high only in naïve mice (group mean ± s.e.m.). g, Viral genome copies in nose and lung samples were significantly reduced for the vaccinated animals (n = 3 mice in OTS4–5, OTS7–8 groups; n = 6 mice in OTS4-5-7-8, OTS-206 groups; n = 4 in mock group, n = 10 in naïve group). h, At 5–6 dpc, no infectious virus was detectable in nose and lung samples of the vaccinated animals. i,j, Histopathological scores (i) and immunohistochemical analysis (j) of lung sections demonstrate protection in OTS-construct-inoculated mice. Scale bar, 500 μm. Statistical significance was calculated using two-sided ordinary two-way ANOVA with Tukey´s multiple-comparisons test (compare columns (simple effect within rows), 95% CI) for c and e; and two-sided, unpaired, non-parametric multiple t-test with Mann–Whitney test (compare ranks, 95% CI) for gi. Violin plots in gi show individual samples with mean values (middle lines). Source data
Fig. 3
Fig. 3. Immunization with OTS constructs provides full protection against SARS-CoV-2 challenge in the Syrian hamster.
a, Syrian hamsters (M. auratus, male, 12 weeks old) inoculated with either no vaccine (naïve/control) or OTS4–5 or OTS7–8 (n = 8 hamsters per group, n = 4 hamsters for naïve/control group), and subsequently challenged. Overview created with BioRender.com. be, Survival (b) and weight stability (c) post challenge (mean ± s.e.m.), with reduced viral genome copies in nasal washings (d) and respiratory tissues (e). Nevertheless, contact animals (n = 3 hamsters per group) became infected, leading to body weight loss (c), virus shedding in nasal washings (d) and virus genome loads in respiratory tract samples (e). f, Similar results are observed in hamsters (male, 8 weeks old) inoculated with OTS-206 (n = 8, n = 4 hamsters for naïve/control group) and challenged with BA.2 VOC. Overview created with BioRender.com. g,h, Challenged hamsters did not exhibit any mortality (g) and vaccinated animals were protected from weight loss (h) (mean ± s.e.m.). i,j, Detected amount of virus genome was significantly reduced in the nasal washings (i) as well as in conchae samples (j) and was absent in all lung samples examined at 5 dpc. More data, such as serology and individual body weights, are presented in Extended Data Fig. 4 and Supplementary Fig. 6. Statistical significance was assessed using two-sided, unpaired, non-parametric multiple t-test with Mann–Whitney test (compare ranks, 95% CI) (ce, hj). *P < 0.05, **P < 0.01, ***P < 0.001, ****P < 0.0001; NS, not significant. Data obtained from two independent experiments (ae and fj). Violin plots in d, e, i and j show individual samples with mean values (middle lines). Source data
Fig. 4
Fig. 4. OTS-206 induces comparable efficacy to mRNA vaccines and superior virus clearance after challenge infection.
a, Short-term experimental setup: age-matched K18-hACE2 mice were vaccinated with Spikevax mRNA vaccine (intramuscularly, i.m.) or OTS-206 (intranasally) (n = 8 mice per group) and later challenged with SARS-CoV-2 Delta VOC. Lungs were collected at 2 (n = 4) or 5 dpc (n = 4). Mock control group was vaccinated with culture medium. Data obtained from one experiment. Overview created with BioRender.com. b, Immunohistochemistry for SARS-CoV-2 nucleocapsid protein (N) of lung sections. c, Quantification of nucleocapsid-stained lung cells of n = 4 independently inoculated mice (bars indicate mean ± s.e.m.). d,e, Summed (d) and normalized (e) SARS-CoV-2 gene counts (N, ORF1ab, M, E, S, ORF3a). Both IHC and gene count quantification indicate faster clearance of SARS-CoV-2 for the OTS-206 group. f, Increased JAK-STAT pathway activity post challenge (left), with highest activity for the mRNA-vaccine group at 2 dpc, based on the mean pathway activity score (right) of n = 4 independently inoculated mice per group. Box and violin plots in e and f show minimum, maximum, mean (line) and s.d. Source data
Fig. 5
Fig. 5. OTS-228 is significantly attenuated in vitro and not transmitted in vivo.
a, Schematic representation of the deleted polybasic cleavage site in OTS-228 spike compared to WT and OTS-206. b, Reduced plaque sizes were observed with PCS deletion (n = 10 plaques measured per group). c, Infection of hNECs and hBECs with indicated viruses (n = 3 biologically independent samples, one experiment). Infectious particle titres were assessed over time, confirming attenuation of OTS-228 in both cell lines. Data are presented as mean ± s.e.m. d, Attenuation experiment in Syrian hamsters (M. auratus, male, 9 weeks old) with OTS-228 over 21 dpv. Data obtained from OTS-228-inoculated hamsters (n = 10) and naïve contact animals (n = 4) from one experiment. Overview created with BioRender.com. e,f, Full attenuation of OTS-228 in terms of survival (e) and body weight changes (f) of vaccinated and contact hamsters (1–5 dpv n = 10; 6–21 dpv n = 5; 1–21 dpv n = 4 contacts). g, OTS-228 was not transmitted to naïve direct contact hamsters (0, 1, 2, 3, 4, 5 dpv n = 10; 7, 12, 16, 21 dpv n = 5; 0, 2, 3, 4, 5, 7, 12, 16, 21 dpv n = 4 contacts). h, High genome loads were detected in conchae samples of the inoculated animals at 5 dpv but low genome loads in the lung samples, especially at later timepoints. i,j, Analysed serum samples confirmed lack of transmission to contacts (i), highlighting a partly cross-neutralizing antibody response (j). Statistical significance was assessed using two-sided, two-way ANOVA with Tukey’s multiple-comparisons adjusted P values (95% CI) (b and c). Violin plots in b, g and h show individual samples with mean values (middle lines). Source data
Fig. 6
Fig. 6. OTS-228 cross-protects against SARS-CoV-2 BA.5 challenge infections and limits transmission.
a, Omicron BA.5 challenge infection of OTS-228-vaccinated Syrian hamsters (M. auratus, male, 12 weeks old). Data obtained from n = 8 hamsters per group (OTS-228 and mock) and n = 3 naïve contact animals (direct contact to OTS-228 group) from one experiment. Overview created with BioRender.com. b,c, Mortality (b) and body weight loss (c) were prevented by OTS-228 vaccination; OTS-228 group (1–5 dpc n = 8; 6–14 dpc n = 3); mock group (1–2 dpc n = 8; 3–5 dpc n = 7; 6–14 dpc n = 3); OTS-228 contact animals (1–14 dpc n = 3). d,e, Shedding of Omicron BA.5 virus genome was significantly reduced in the OTS-228-vaccinated animals (d) (OTS-228 group (1, 2, 4 dpc n = 8; 8, 12 dpc n = 3), mock group (1, 2 dpc n = 8; 4 dpc n = 7; 8, 12 dpc n = 3), OTS-228 contact animals (1, 2, 4, 8, 12 dpc n = 3)) and in the respiratory organ samples (e) at 5 dpc (OTS-228 group n = 5, mock group n = 4 (samples from 2 dpc animal excluded)). Organ samples of the 14 dpc group (Supplementary Fig. 4) confirmed virus clearance at this timepoint in contrast to the mock group, which still exhibited virus genome in conchae and lung samples. f, Serological evaluation confirmed reduced transmission to naïve contact animals. g, Evaluation of the post-challenge humoral immune response showed broad neutralization capacity of OTS-228 against WTD614G, but also against Omicron BA.2 and BA.5, while control sera only reacted against Omicron BA.5 (bars indicate mean ± s.e.m.). Statistical significance was assessed using two-sided, unpaired, non-parametric multiple t-test with Mann–Whitney test (compared ranks, 95% CI) (ce and g). Violin plots in d and e show individual samples with means (middle lines). Source data
Extended Data Fig. 1
Extended Data Fig. 1. OTS constructs show comparable replication kinetics to WT in vitro, but higher sensitivity to treatment with antivirals.
a, Schematic overview of the mutations introduced to SARS-CoV-2 genome to generate OTS codons. Fragments 2, 4, 5, 7, and 8, which are used for TAR cloning of recombinant SARS-CoV-2 clones have been modified to enrich the number of one-to-stop codons. The number of codons and nucleotides that have been changed are indicated for each fragment. For the OTS-206 construct, two additional point mutations were introduced in Nsp1 (K164A/H165A) and open reading frames ORF6 to ORF8 were deleted. The number of codons and nucleotides that have been changed in each fragment are listed in Supplementary Table 1. b, Representative pictures of the plaque sizes of viruses in 6-well plates 2 dpi. Virus growth kinetics assessed by TCID50 assay on c, Vero E6/TMPRSS2 cells (n=3) and d, human bronchial epithelial cell (hBECs) (n=6 (3 replicates from 2 donors)). Each line in the graphs shows the titers obtained from one individual sample. Statistical significance was determined using two-sided, two-way ANOVA and p-values were adjusted using Tukey’s multiple comparison test (CI: 95%); *P<0.05, **P<0.01, ***P<0.001, ****P<0.0001. Source data
Extended Data Fig. 2
Extended Data Fig. 2. Attenuation of OTS2, OTS7, OTS8, OTS4-5 and OTS7-8 in K18-hACE2 mice.
a, K18-hACE2 mice (7–16 weeks old, n=4 mice/group, n=2 mice/mock group) were infected with 5,000 PFU of either OTS2, OTS7, OTS8, or SARS-CoV-2 WT virus, or only with medium for 5 days. Overview created with BioRender.com. b, c, Mice were monitored for body weight change (mean ± SEM) (Mock vs WT, p=0.0442) and clinical symptoms over the 5-day course of infection. On day 5 post-infection (dpi), mice were euthanized, and samples from the nose, lungs, brain, and olfactory bulbs were collected for evaluation of infectious virus titers, viral genome copy numbers, and pathology. d, Infectious virus titers from the nose, lung, and brain samples were determined using plaque assays in VeroE6 cells. e, Genome copy numbers in the nose, lung, brain, and olfactory bulb samples of infected mice were quantified using probe-specific RT–qPCR. f, Histopathological lung score was given for characterization and comparison of the severity of lung lesions. g, Hematoxylin and eosin stain (left panel) and immunohistochemical analysis (right panel) specific for SARS-CoV-2 nucleocapsid protein of lung and brain sections. Scale bar, 500 μm. h, Experimental setup of comparison of OTS4-5, OTS7-8 to WT infection in short-term (7–16 weeks-old, n=4 mice/group). Overview created with BioRender.com. i, j, Mice were monitored for body weight (mean ± SEM) (Mock vs WT, p<0.0001) change and clinical symptoms over the 5-day course of infection. k, Infectious virus titers from the nose, lung, and brain samples were determined using plaque assays. l, m, Genome copy numbers in the nose, lung, brain, and olfactory bulb samples of infected mice were quantified using RT–qPCR. n, Histopathological lung score was given for characterization and comparison of the severity of lung lesions. o, Hematoxylin and eosin stain (left panel) and immunohistochemical analysis (right panel) specific for SARS-CoV-2 nucleocapsid protein of lung and brain sections (n=4 per group) (magnification 50x). Scale bar, 500 μm. Statistical significance was determined using two-sided, two-way ANOVA (b-f, i-m), and P values were adjusted using Tukey’s multiple-comparison test or was assessed by two-sided, unpaired, nonparametric multiple t-test with Mann-Whitney test (compared ranks, CI: 95%); *P < 0.05, **P < 0.01, ***P < 0.001, ****P < 0.0001. Data were obtained from one experiment, with each data point representing one biological replicate. Body weight changes, clinical scores, and histopathological scores of all K18-hACE2 mice experiments are shown in Supplementary Table 6. Source data
Extended Data Fig. 3
Extended Data Fig. 3. Safety study of OTS4-5, OTS7-8 and OTS-206 in Syrian hamster model.
a, Experimental setup of intranasal inoculation of Syrian hamsters (Mesocricetus auratus, male, 12 weeks old (WT, OTS4-5 and OTS7-8) and 8 weeks old (OTS-206) (Donors) (n=10 hamsters/OTS-group until 5dpi, n=5 hamsters/OTS-group until 21dpi, n=4 hamster WT-group until 5dpi) with OTS4-5, OTS7-8, or OTS-206 SARS-CoV-2, including co-housing of naïve contact animals (Contacts) (n=4 hamsters/group until 21dpi) 1 day post inoculation (dpi). Data obtained from two independent experiments (experiment 1 (OTS4-5, OTS7-8, WT) and experiment 2 (OTS-206). Overview created with BioRender.com. b, c, Body weight changes of inoculated and contact hamsters in percent as mean data (+/- SEM) and on individual level. d, e, Virus genome copy numbers in nasal washings of donor and contact hamsters. f, g, Virus genome copy numbers in the organ samples of donors at 5 and 21 dpi. h, Virus genome copy numbers in the organ samples of contact hamsters at 21 dpi. i, Serum samples of 5 and 21 dpi analyzed by SARS-CoV-2RBD-ELISA. j, Serum samples were additionally analyzed in live virus neutralization assay (capacity to neutralize 100 TCID50) against ancestral WT SARS-CoV-2. k, Pneumonia-induced pulmonary atelectasis 5 dpi given in % affected area. l, Histopathology, lung whole slide images showing atelectasis, hematoxylin-eosin stain. Scale bar, 2.5 mm. m, Virus antigen score, 0= no antigen, 1 = focal, 2 = multifocal, 3 = coalescing, 4 = diffuse. n, Representative virus antigen imaging (WT group) by immunohistochemistry (SARS-CoV nucleocapsid protein detection), mainly in type-1 pneumocytes, bar 100 µm. Statistical significance was assessed by two-sided, unpaired, nonparametric multiple t-test with Mann-Whitney test (compared ranks, CI: 95%) (panel b-h). *P<0.05, **P < 0.01, ***P<0.001, ****P<0.0001. No asterisk indicates no statistical significance. Source data
Extended Data Fig. 4
Extended Data Fig. 4. Immunization with OTS4-5, OTS7-8, OTS4-5-7-8, and OTS-206 protects K18-hACE2 mice and Syrian hamsters from SARS-CoV-2 infection.
a, K18-hACE2 transgenic mice (7-16 weeks of age, n=8 mice/group) were immunized with either OTS viruses and SARS-CoV-2 WT or mock medium. Blood samples were taken on day 15 post-immunization. At 21 days post-immunization, mice were challenged with SARS-CoV-2 WT and euthanized on days 5 and 14 post-challenge to obtain organ samples (nose, lungs, brain, and olfactory bulbs) for evaluation. Overview created with BioRender.com. b, Clinical symptoms over the course of infection (mean +/- SEM) and c, genome copy numbers (genome equivalence per ml, gEq/mL) oropharyngeal swabs and in post challenge samples ((d, orophayngial swabs, e, brain and olfactory bulb (OB) 5-6 dpc) and g, brain, OB, nose and lung 14 dpc).f, h, Infectious virus titers from the brain, lung and nose samples. i, Histopathological lung scores at 14 dpc. j, Hematoxylin and eosin stain of lung sections (n=4 per group and time point). Pneumonia (asterisk), perivascular and peribronchiolar cuffings (arrowhead), tertiary lymphoid follicle formations (arrow). Scale bar, 500 μm. k, Virus neutralization test of 15 dpi (pre-challenge) and 5 and 14 dpc (post-challenge) sera against WT. l, Share of CD8+ T cells reacting to spike-stimulated condition. Workflow is given in Supplementary Fig. 1 and in the methods section. m, Sera samples from OTS4-5 or OTS7-8 vaccinated Syrian hamsters challenged with SARS-CoV-2 WT (Fig. 3a), as well as sera of co-housed contact animals, were analyzed and tested positive by SARS-CoV-2-RBD specific ELISA. n, Additionally, virus neutralizing capacity was confirmed for these samples, while mock, OTS4-5 contact, and OTS7-8 contact animals showed only low titers. o, Organ samples of 14 dpc of OTS-206 vaccinated and subsequently SARS-CoV-2 Omicron BA.2 challenged Syrian hamsters (Fig. 3f) were analyzed by RT-qPCR. p, Serological evaluation by SARS-CoV-2-RBD specific ELISA confirmed transmission of BA.2 challenge virus to the naïve contact animals for the mock vaccinated as well as for the OTS-206 vaccinated animals. q, Live virus neutralizing capacity comparison showed substantial neutralizing titers of the OTS-206 vaccinated animals against ancestral SARS-CoV-2 and Omicron BA.2 VOC. r, Pneumonia-induced pulmonary atelectasis at 5 dpi was assessed, and s, histopathology images showed atelectasis. Scale bar, 2.5 mm. t, Virus antigen score and u, immunohistochemistry for SARS-CoV nucleocapsid protein detection were conducted. Scale bar, 100 µm. Statistical significance was assessed by two-sided, unpaired, nonparametric multiple t-test with Mann-Whitney test (compared ranks) (panel d-f, i, k, n and q). *P<0.05, **P<0.01, ***P<0.001, ****P<0.0001. No asterisk indicates no statistical significance. Source data
Extended Data Fig. 5
Extended Data Fig. 5. Spatial transcriptomics shows that OTS-206 vaccination induces similar activation of genes related to the immune response to viral infection and reduced inflammatory response.
Short term experimental setup: Age-matched K18-hACE2 mice vaccinated with Spikevax mRNA-vaccine (intramuscularly) or OTS-206 (intranasally) (n=8 mice/group). Challenge with SARS-CoV-2 Delta VOC, lung harvest at 2- (n=4) or 5-days (n=4) post challenge (dpc). Mock control group was vaccinated with culture medium. Spatial transcriptomics samples (n=11): OTS 2dpc – (n=2), OTS 5dpc (n=2), mRNA 2dpc (n=2), mRNA 5dpc (n=3), mRNA mock (n=1), OTS mock (n=1). a, Pearson’s correlation coefficients were calculated between total SARS-CoV-2 gene counts and all host genes to determine spatial correlations. These values are plotted against each other on the x and y axis for the OTS and mRNA 2 dpc samples to show that the spatial gene expression signatures are very similar, as their correlation coefficients are nearly identical. b, Top 20 spatially most correlated genes in the lungs of infected mice vaccinated with OTS-206 or mRNA vaccine. c, Changes in proinflammatory cytokine expression between conditions (n=4/group). d, Spatial JAK-STAT pathway activity in the lung. We can see the co-occurrence between SARS-CoV-2 transcripts from d, and the increased JAK-STAT activity. Source data
Extended Data Fig. 6
Extended Data Fig. 6. OTS-206 show comparable efficacy to mRNA-vaccines and inducing long-term immunity in K18-hACE2 mice.
a, K18-hACE2 transgenic mice (7–15 weeks old, n=8 mice/group) were immunized (prime & boost) either intramuscularly with a single dose of 1 μg of mRNA-Vaccine Spikevax (Moderna), or intranasally with 5’000 PFU of OTS-206. b, During immunization, mice were regularly monitored for body weight changes. Each line in the body weight loss graphs represents a mouse. Six days post-challenge, mice were euthanized and organ samples were collected for evaluation of infectious virus titers, viral genome copy numbers, and pathology. At 57 dpi a group of mice was intranasally inoculated with 104 TCID50 of SARS-CoV-2D614G, or SARS-CoV-2 Delta VOC (c-h). The rest of the immunized mice were kept for approximately 5 months and then intranasally inoculated with 104 TCID50 of SARS-CoV-2D614G (i-n). d, j, Infectious virus titers from the brain samples were determined using plaque assays in VeroE6 cells. e, k, Genome copy numbers (genome equivalence per ml, gEq/mL) in nose, lung, brain, olfactory bulb, and oropharyngeal swab samples of mice infected with different viruses were quantified using probe-specific RT–qPCR. f, l, High level of long-term protection was confirmed by histopathological scores for lung pathology. Data obtained from one experiment. g, m, Immunohistochemical analysis specific for SARS-CoV-2 nucleocapsid protein (magnification 50x). Scale bar, 500 µm. h, n, Sera collected on 6 dpc (post-challenge) were tested against SARS-CoV-2 Wuhan WT virus in a serum neutralization test. Data obtained from one experiment. Infectious viral particle concentrations, genome copies, immunohistochemical analysis and individual body weights in Extended Data Fig. 6 and Supplementary Fig. 6e and f). Body weight changes, clinical scores, and histopathological scores in Supplementary Table 6. Statistical significance was determined using two-sided, two-way ANOVA (Tukey’s multiple comparison test) (panels c, and i,) or ordinary one-way ANOVA (panels f, and l,) or by using two-sided, unpaired nonparametric t-test (Mann Whitney test) (panels d, e, j and k). No asterisk indicates no statistical significance. *P<0.05, **P<0.01, ***P<0.001, ****P<0.0001. Source data
Extended Data Fig. 7
Extended Data Fig. 7. OTS-228 shows replication kinetics comparable to WT and OTS-206 in VeroE6/TMPRSS2 cells.
Vero E6/TMPRSS2 cells were infected with 0.1 MOI of the indicated viruses and incubated at 37 °C for 1 h. After 1 h, supernatant was discarded and the cells were washed 3 times with PBS, and the third wash was kept for analysis. Following the addition of new sera on the cells, they were incubated at 37 °C. Samples were collected on designated time points post-infection. Infectious particle titers were assessed by TCID50 assays on VeroE6/TMPRSS2 cells. Each line in the graphs shows one replicate of samples. Statistical significances in the titer differences of OTS viruses vs WT on given times were determined using two-sided two-way ANOVA and p-values were adjusted using Tukey’s multiple-comparison test; *P<0.05, **P<0.01, ***P<0.001, ****P<0.0001. Source data
Extended Data Fig. 8
Extended Data Fig. 8. SARS-CoV-2 WT challenge infection of OTS-228 immunized Syrian hamsters.
a, Experimental setup. Syrian hamsters (Mesocricetus auratus, male, 12 weeks old) were OTS-228 vaccinated and subsequently challenged by SARS-CoV-2 WT. Overview created with BioRender.com. b, Survival post-challenge infection. c, Relative body weight in percent. d, Virus genome copy numbers in nasal washing (until dpc5: n=8 OTS-228 and mock group, n=3 OTS-228 contact group; from dpc 6 on: n=3 OTS-228 and contacts and n=4 mock group) and e, organ samples of 5 dpc (n=5 OTS-228 group, n=4 mock group). f, Genome loads of organ samples taken 14 dpc (¾ mock vaccinated animal sampled on 7dpc) g, Serum samples of 5 and 14 dpc were analyzed by SARS-CoV-2 RBD-ELISA. h, Serum samples that reacted positively in the ELISA, were analyzed in addition by live virus neutralization assay (capacity to neutralize 100 TCID50) against ancestral (B.1) SARS-CoV-2 as well as against Omicron BA.2 and BA.5 variants. Statistical significance was assessed by two-sided, unpaired, nonparametric multiple t-test with Mann-Whitney test (compared ranks) (panel c-e). *P<0.05, **P<0.01, ***P<0.001, ****P<0.0001. No asterisk indicates no statistical significance. Source data
Extended Data Fig. 9
Extended Data Fig. 9. Omicron BA.2 challenge of OTS-228 vaccinated Syrian hamsters.
a, Experimental setup. Syrian hamsters (Mesocricetus auratus, male, 12 weeks old) were OTS-228 vaccinated and subsequently challenged by SARS-CoV-2 BA.2. Data obtained from n = 8 OTS-228 inoculated hamster from one experiment, with n=3 naïve direct contact hamsters. Overview created with BioRender.com. b, Survival post challenge infection. c, Relative body weight in percent. Shown are the mean with standard error. d, Virus genome copy numbers in nasal washing (until dpc5 n=8 and n=3 (contacts), from dpc6 on n=3 for both groups) and e, organ samples of 5 dpc (n=5 OTS-228) and f, 14 dpc (n=3 OTS-228 and contacts). g, Serum samples of 5 and 14 dpc were analyzed by SARS-CoV-2RBD-ELISA. h, Serum samples which reacted positively in the ELISA, were analyzed in addition by live virus neutralization assay (capacity to neutralize 100 TCID50) against ancestral (B.1) as well as against Omicron BA.2 variant. Source data
Extended Data Fig. 10
Extended Data Fig. 10. Syrian hamsters' shows protection against XBB.1.5 Omicron challenge infection after a single intranasal OTS-228 vaccination.
a, Experimental setup. Syrian hamsters (Mesocricetus auratus, male and female equally mixed, 9 weeks old) were OTS-228 vaccinated and subsequently challenged by SARS-CoV-2 XBB.1.5, with co-housing of naive direct contact animals 1-day post-challenge (dpc). Data were obtained from n=16 hamsters/group, with n=6 naïve direct contact hamsters/group, comparing vaccinated to nonvaccinated. Overview created with BioRender.com. b, Body weight percentages of donor animals over time indicated no weight loss post-infection (dpc1-2: n=16/group, dpc3-5: n=11/group, dpc6-14 n=6/group). Data are presented as mean values +/- SEM. c, Body weight percentage of contact animals over time showed weight loss following co-housing (n=6). d, Relative survival post-challenge (n=6/group), with one unrelated death and its contact animal excluded from comparisons (see Supplementary Fig. 7). e, RT-qPCR analysis of donor hamster nasal washing samples for SARS-CoV-2 viral genomes revealed reduced shedding for the OTS-228 vaccinated group (dpc1-2: n=16/group, dpc3-5: n=11/group, dpc6-14 n=6/group). f, RT-qPCR analysis of contact hamster nasal washing samples for SARS-CoV-2 viral genomes indicated positive results for most animals (n=6/group). g, RT-qPCR analysis for SARS-CoV-2 viral genomes of organ samples from donor animals euthanized at 2 dpc (n=5/group) showed reduced viral loads in OTS-228 vaccinated animals. h, RT-qPCR analysis for SARS-CoV-2 viral genomes of organ samples from donor animals euthanized at 5 dpc (n=5/group) demonstrated pronounced virus clearance in the OTS-228 group. i, RT-qPCR analysis for SARS-CoV-2 viral genomes of organ samples from donor hamsters euthanized at 14 dpc (n=6/group) showed reduced viral loads in vaccinated animals. j, RT-qPCR analysis for SARS-CoV-2 viral genomes of organ samples from contact hamsters euthanized at 14 dpc (n=6/group) revealed no differences between groups. k, SARS-CoV-2RBD-ELISA of serum from donor and contact animals confirmed positive reactions in all vaccinated animals’ post-vaccination. l, Virus neutralization test (VNT100) against homologous WT SARS-CoV-2 verified detectable neutralization at 19 dpv and post-challenge (dpv19: n=16/group, dpc2: n=5/group, dpc5: n=5/group, dpc14: n=6/group). m, Virus neutralization test (VNT100) against SARS-CoV-2 variant Omicron XBB1.5 showed lower and delayed neutralizing immune responses compared to the ancestral virus. Statistical significance was assessed by two-sided, unpaired, nonparametric multiple t-test with Mann-Whitney test (compared ranks) (panel b, c, e-j, l and m). *P<0.05, **P < 0.01, ***P<0.001, ****P<0.0001. No asterisk indicates no statistical significance. Source data

Similar articles

Cited by

References

    1. Markov, P. V. et al. The evolution of SARS-CoV-2. Nat. Rev. Microbiol.21, 361–379 (2023). 10.1038/s41579-023-00878-2 - DOI - PubMed
    1. Moratorio, G. et al. Attenuation of RNA viruses by redirecting their evolution in sequence space. Nat. Microbiol.2, 17088 (2017). 10.1038/nmicrobiol.2017.88 - DOI - PMC - PubMed
    1. Mendez, A. S. et al. The N-terminal domain of SARS-CoV-2 nsp1 plays key roles in suppression of cellular gene expression and preservation of viral gene expression. Cell Rep.37, 109841 (2021). 10.1016/j.celrep.2021.109841 - DOI - PMC - PubMed
    1. Cao, Z. et al. Ubiquitination of SARS-CoV-2 ORF7a promotes antagonism of interferon response. Cell. Mol. Immunol.18, 746–748 (2021). 10.1038/s41423-020-00603-6 - DOI - PMC - PubMed
    1. Li, J. Y. et al. The ORF6, ORF8 and nucleocapsid proteins of SARS-CoV-2 inhibit type I interferon signaling pathway. Virus Res.286, 198074 (2020). 10.1016/j.virusres.2020.198074 - DOI - PMC - PubMed

MeSH terms

Supplementary concepts