. 2024 Sep;9(9):2410-2421.
doi: 10.1038/s41564-024-01748-0. Epub 2024 Jul 12.

A dynamic subpopulation of CRISPR-Cas overexpressers allows Streptococcus pyogenes to rapidly respond to phage

Affiliations

A dynamic subpopulation of CRISPR-Cas overexpressers allows Streptococcus pyogenes to rapidly respond to phage

Marie J Stoltzfus et al. Nat Microbiol. 2024 Sep.

Abstract

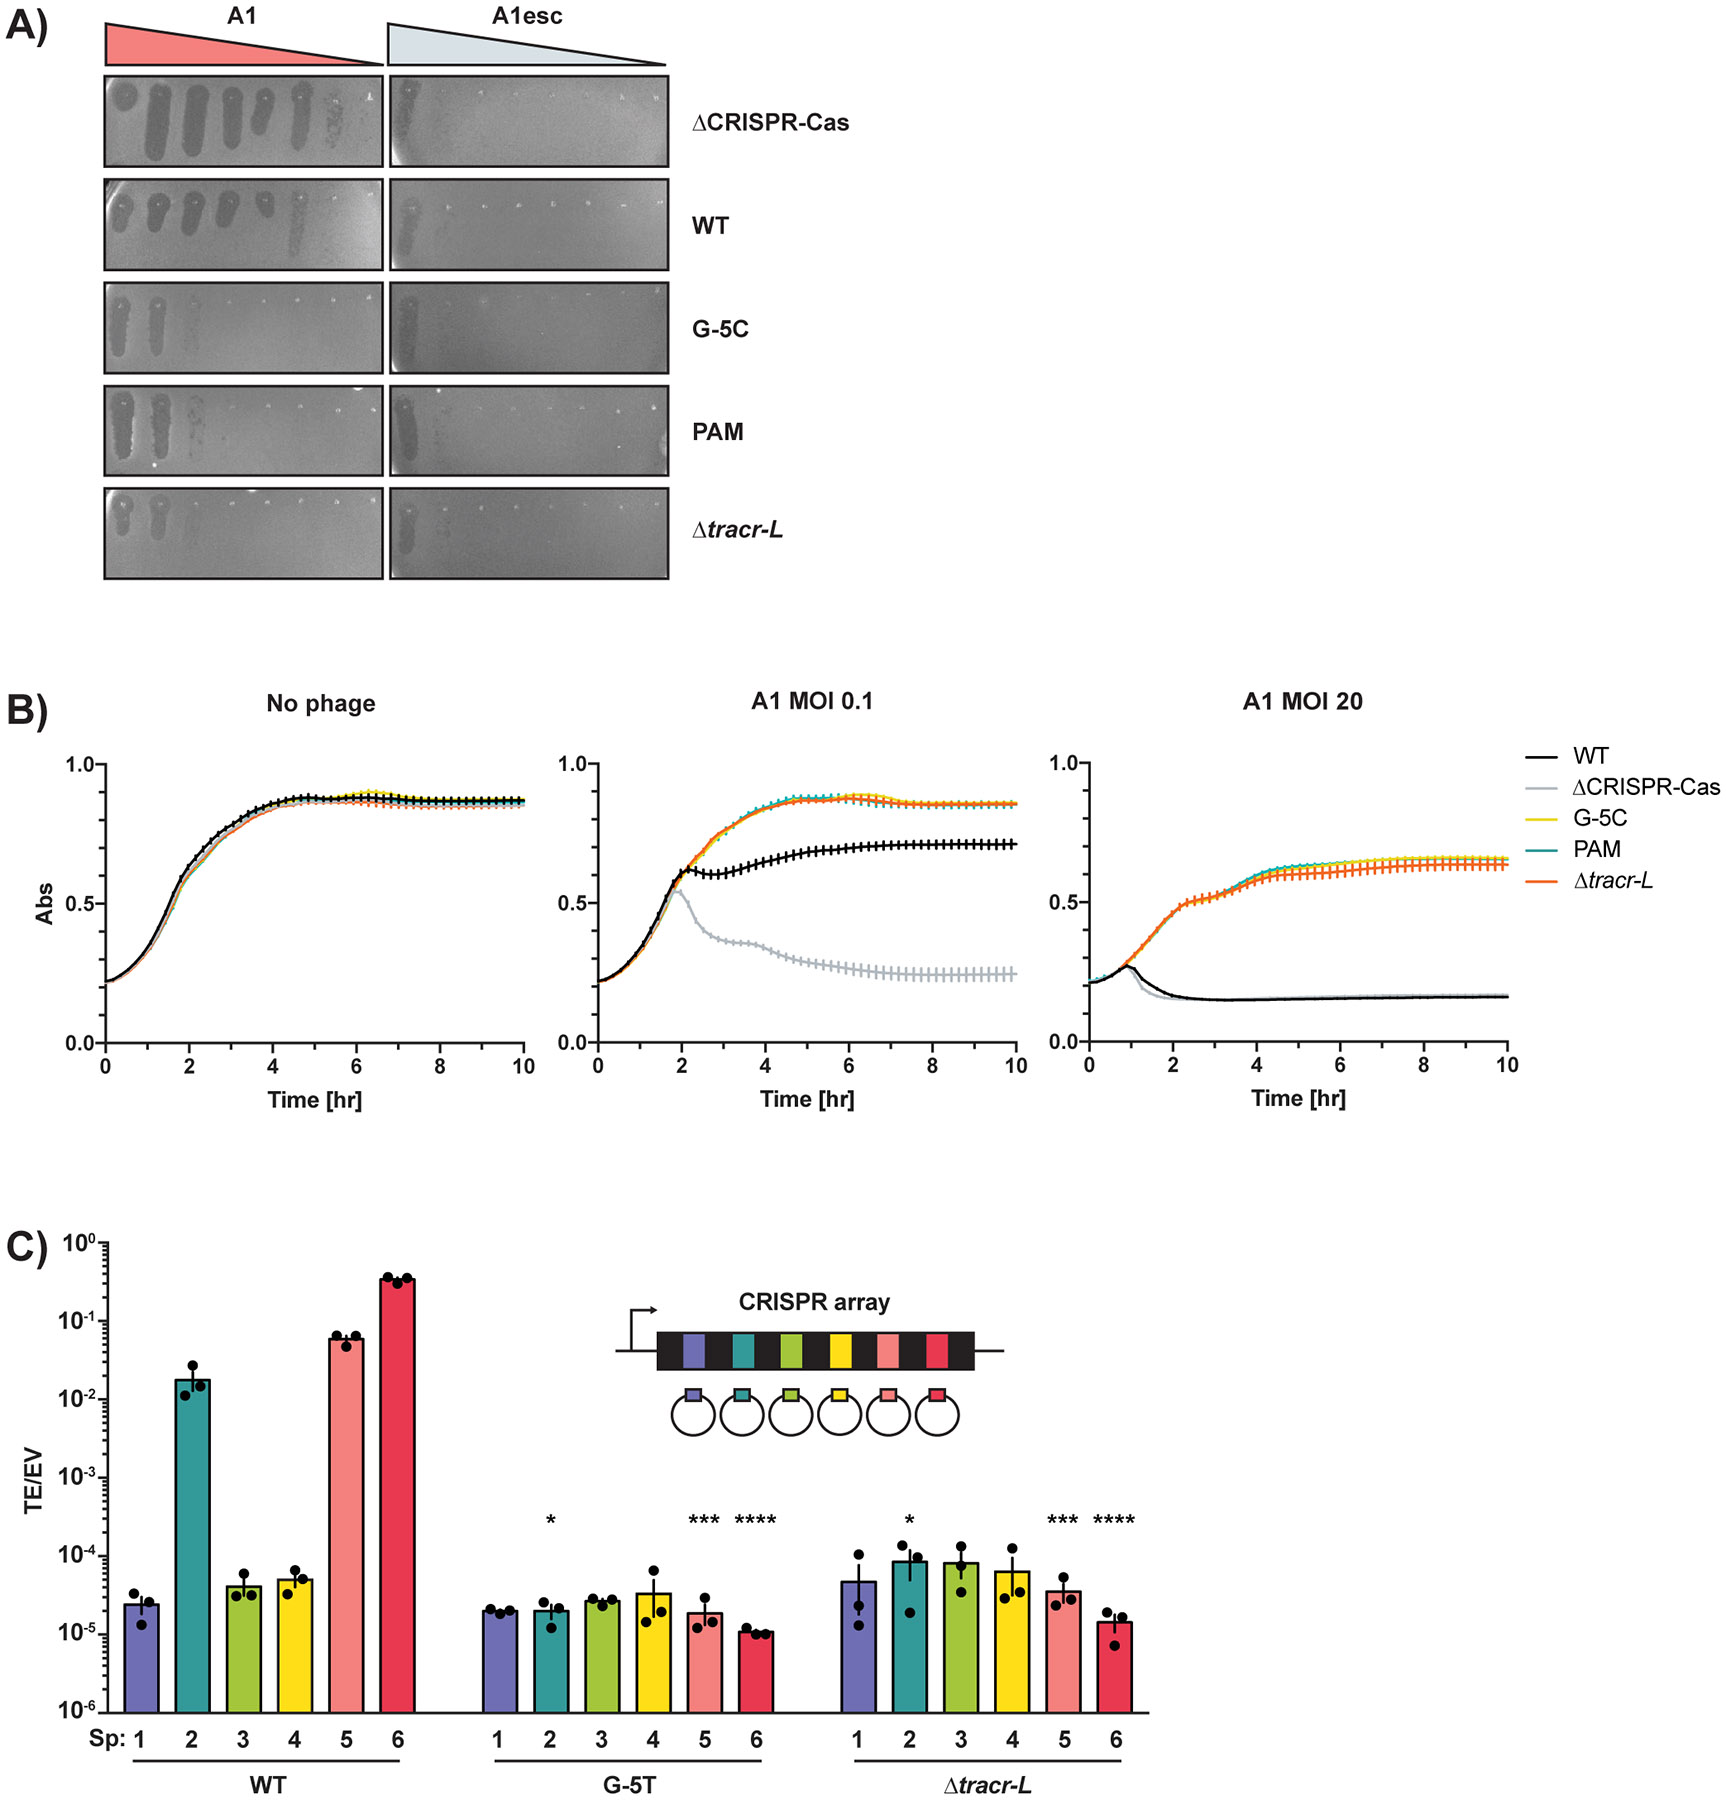
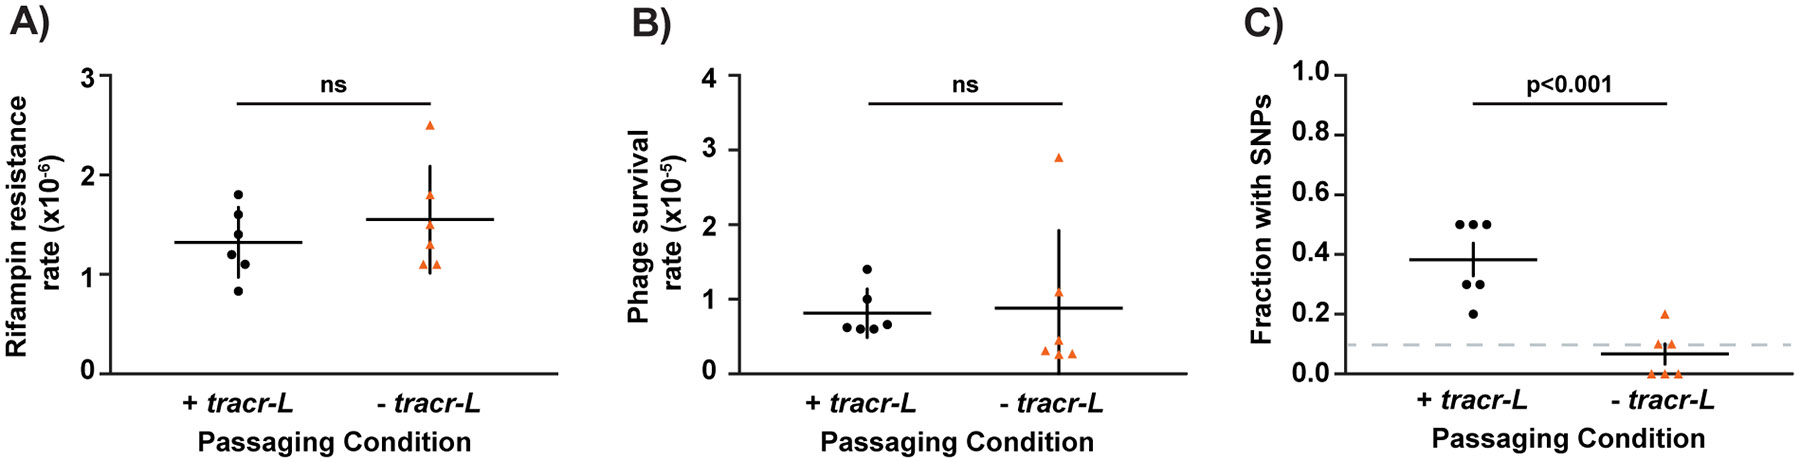
Many CRISPR-Cas (clustered regularly interspaced short palindromic repeats and CRISPR-associated protein) systems, which provide bacteria with adaptive immunity against phages, are transcriptionally repressed in their native hosts. How CRISPR-Cas expression is induced as needed, for example, during a bacteriophage infection, remains poorly understood. In Streptococcus pyogenes, a non-canonical guide RNA tracr-L directs Cas9 to autorepress its own promoter. Here we describe a dynamic subpopulation of cells harbouring single mutations that disrupt Cas9 binding and cause CRISPR-Cas overexpression. Cas9 actively expands this population by elevating mutation rates at the tracr-L target site. Overexpressers show higher rates of memory formation, stronger potency of old memories and a larger memory storage capacity relative to wild-type cells, which are surprisingly vulnerable to phage infection. However, in the absence of phage, CRISPR-Cas overexpression reduces fitness. We propose that CRISPR-Cas overexpressers are critical players in phage defence, enabling bacterial populations to mount rapid transcriptional responses to phage without requiring transient changes in any one cell.


Figures

Extended Data Fig. 1.
Extended Data Fig. 1.. A subpopulation of CRISPR-Cas overexpressers expands during phage infection.
A) Primers that bind to the leader sequence and spacer 1 were used to check for spacer acquisition in survivors of A1 infection (Fig. 1B). The size of the PCR product (representative agarose gel shown) was used to determine the number of spacers acquired by each survivor. B) Mutations observed in the tracr-L target sequence as summarized in Fig 1C, separated by replicate. ‘n’ refers to the total number of survivors screened per replicate for spacer acquisition and SNPs. C) Mutations in tracr-L regulatory sequences from surviving dCas1 colonies, separated by replicate. ‘n’ refers to the total number of survivors sequenced per replicate. D) Number of SF370 cells in individual chains plotted for three biological replicates. The average chain length for all replicates is 10 cells. n = 130 – 300 chains per replicate.
Extended Data Fig. 2.
Extended Data Fig. 2.. Old spacers remain potent in overexpressers.
A) Representative plates used to determine efficiency of plaquing in Fig. 2A. B) Liquid infections of cells with mutations in tracrL regulatory sequences at MOI 0, 0.1, and 20. C) WT and CRISPR-Cas overexpressing cells were transformed with plasmids containing protospacers targeted by each of the 6 spacers in the native CRISPR array. Transformation efficiency was calculated relative to an empty vector. Significance was determined by comparing TE/EV to the same plasmid transformed into the WT strain. Data are presented as mean values and error bars are standard error. Significance was determined using unpaired, two-tailed t-tests (* p < 0.05, ** p < 0.01, *** p < 0.001, **** p < 0.0001). n=3 biological replicates. P-values for spacers 2, 5, and 6, respectively, were 0.0214, 0.0006, and < 0.0001 for G-5T and 0.0217, 0.0006, and < 0.0001 for ΔtracrL.
Extended Data Fig. 3.
Extended Data Fig. 3.. CRISPR-Cas overexpressers generate greater functional spacer diversity.
A) Representative views of colonies on soft agar plates from immunity assay in Fig. 3A. B) Spacers acquired in six surviving colonies of each strain from (A) were sequenced, and their targets were identified by alignment to the phage A1 or SF370 genome. Each row represents one colony. The newly acquired spacers are represented by boxes on the left, where the leftmost box is the newest, leader-proximal spacer, and the target PAM sequence is represented by the color of and symbol within each box. The locations of the spacer targets within the A1 phage genome are shown and labelled with a number corresponding to the order in which they were acquired. C) Order of spacers in WT SF370 and a strain in which the spacers were flipped (Note: the 5’-3’ orientation of each spacer sequence is maintained). D) Transformation efficiency of plasmids targeted by the first or last spacer in the SF370 array transformed into WT cells, and a strain with the order of spacers flipped.
Extended Data Fig. 4.
Extended Data Fig. 4.. Overexpression of the cas operon decreases fitness.
A) Binding sites of primers used for amplicon sequencing (F1/R1) and semi-quantitative PCR (F2/R2) to quantify fractions of overexpressers in competition assays. B) Validation of amplicon sequencing strategy to quantify WT vs. PAM/target site mutant competitions. The region containing the tracrL target site and PAM was amplified and sequenced with Next Generation Sequencing. The fraction of reads corresponding to each genotype was quantified. n = 2 for all fractions except “0” and “1,” where n=1. C) Validation of semi-quantitative PCR to quantify WT vs. ΔtracrL competitions. PCR across the tracr locus was performed using mixtures of known fractions of WT and ΔtracrL cells as template, resulting in a longer product from WT cells and a band 52bp shorter from ΔtracrL cells, and run on agarose gels. Gel is representative of two replicates. D) To quantify the fraction of ΔtracrL cells in a culture (lane “0.5” from (C) shown), the integrated densities (ID) of the WT (box 2) and ΔtracrL (box 3) bands were quantified with ImageJ, along with regions of the same size immediately above and below the bands (boxes 1 and 4). To calculate a corrected WTID(IDWT), IDbox1 was subtracted from IDbox2. To calculate a corrected ΔtracrL ID(IDΔtrL), IDbox4 was subtracted from IDbox3. To calculate the fraction of ΔtracrL, IDΔtrL was divided by the sum of IDΔtrL and IDWT. E) The fraction of ΔtracrL cells from (C) was quantified and graphed relative to the expected fraction. n = 2 for all fractions except “1,” where n=1. F) Cas9 ChIP data from stationary (stat) and logarithmic (log) phase cultures are shown at Pcas and partial matches to tracrL and crRNAs in SF370, an SF370 ΔtracrL strain, and the M1 GAS strain 5448. Windows are centered around the target site (black arrow), and the sequence of the target and its guide RNA are shown below. Matching bases are underlined, and PAM sequences are bolded. In strain 5448, the sequence of tracrL and all target sites shown are perfectly conserved, but spacer 4 is not present in the CRISPR array. n = 1. G) Competitions between WT SF370 and CRISPR-Cas PAM mutant overexpressers. The fraction of overexpresser relative to day 0 is shown. Data are presented as mean values and error bars are standard error. n=3 biological replicates.
Extended Data Fig. 5.
Extended Data Fig. 5.. Cas9:tracrL binding is mutagenic.
A) Rifampin resistance rates of populations passaged with and without tracrL expressed. B) Survival rate of cells passaged with and without tracrL expression when infected with ϕNM4γ4 at MOI 100 in soft agar. C) The fraction of sequenced colonies with mutations leading to CRISPR-Cas overexpression from plates described in (B). Dotted line indicates limit of detection. P = 0.0006. Data are presented as mean values and error bars are standard error. Significance was determined using unpaired, two-tailed t-tests. n=6 biological replicates.
Figure 1.
Figure 1.. A subpopulation of CRISPR-Cas overexpressers expands during phage infection.
A) The type II-A S. pyogenes CRISPR-Cas system. The repressive Cas9:tracrL complex binds downstream from the cas operon transcriptional start site. Spacer 5 targets phage A1. B) S. pyogenes cells were infected with phage A1 at MOI = 1 in soft agar and the genotype of surviving colonies was determined by PCR and Sanger Sequencing (OX, overexpresser with mutation in the Pcas target site). Data are presented as mean values and error bars are standard error. n=3 biological replicates. C) The R-loop formed between tracrL (orange) and the Pcas target site (grey). Mutations in the target site observed in survivors of the infection described in (B) are shown. Subscripts indicate the number of individual survivors with each mutation. D) Western blot (representative of 3 biological replicates) probing for Cas9 levels in stationary phase cultures of S. pyogenes with the indicated mutations in Pcas (G-5C, PAM) or a tracrL deletion (TP, Ponceau stain for total protein).
Figure 2.
Figure 2.. Old spacers regain potency in CRISPR-Cas overexpressers.
A) Efficiency of plaquing of a targeted phage (A1) and a non-targeted mutant (A1esc) on S. pyogenes with the indicated CRISPR-Cas overexpressing mutations. Efficiency of plaquing (EOP) was calculated relative to a ΔCRISPR-Cas strain. B) Phages targeted by each of the 6 spacers within the native CRISPR array were plated on WT and CRISPR-Cas overexpressing cells. EOP was calculated relative to a non-targeting strain with all spacers in the CRISPR array deleted. Data are presented as mean values and errors bars are standard error. Significance values indicate significant difference from the EOP of the same phage on WT and were determined by unpaired, two-tailed t-tests (* p < 0.05, ** p < 0.01). In A, P-values for A1 EOPs on all overexpressing strains are 0.0074. In B, P-values for spacers 2, 5, and 6 are 0.0119, 0.0158, and 0.0381, respectively. n=3 biological replicates.
Figure 3.
Figure 3.. CRISPR-Cas overexpressers generate greater functional spacer diversity.
A) Survival rates of S. pyogenes infected with non-targeted phage A1esc at MOI 5 in soft agar relative to ΔCRISPR-Cas. P-values are < 0.0001, 0.0044, and 0.0004 for G-5C, PAM, and ΔtracrL, respectively. B) Genotypes of survivors from (A) determined by PCR across the CRISPR array of 9 colonies per replicate. Significance was determined by comparing the fraction of survivors with 2 or more newly acquired spacers to WT. P-value for ΔtracrL is 0.0476. C) WT cells and cells that acquired one additional spacer were transformed with plasmids targeted by the indicated spacer (“Sp”) in the WT array. Transformation efficiency was calculated relative to an empty vector control. The leader-proximal spacer is labeled as spacer 1. nt, non-targeted. P-values are 0.0002, 0.0410, and 0.0484 for WT+1 spacers 1, 4, and 5, respectively. D) PAM mutants that acquired 1-3 additional spacers during infection with A1esc were transformed with a plasmid targeted by spacer 6 in the WT array. Three independent PAM mutants that acquired one spacer were tested. Transformation efficiency is shown, along with the parent strain (PAM). WT data from (B) are included for comparison. P-values are, moving from left to right starting with PAM, 0.0095, 0.0106, 0.0132, 0.0132, 0.0104, and 0.0160. Data are presented as mean values and error bars are standard error. Significance values indicate significant difference from the WT strain and were determined by unpaired, two-tailed t-tests (* p < 0.05, ** p < 0.01, *** p < 0.001, **** p < 0.0001). n=3 biological replicates.
Figure 4.
Figure 4.. Overexpression of the cas operon decreases fitness.
A) Schematic showing experimental setup for competition experiments. Equal amounts of overnight cultures were mixed and passaged every morning and evening for 4 days (8 total passages). The fraction of each strain in the coculture was quantified every two days. B) Competitions between WT SF370 and CRISPR-Cas PAM mutant (n=5) or tracrL target site mutant (G-5C; n=3) overexpressers. The fraction of overexpresser is shown. C) Competition between WT and ΔtracrL cells. n=3. Data are presented as mean values and errors bars are standard error. Significance values were determined by paired, two-tailed t-tests (** p < 0.01, **** p < 0.0001). P-values are < 0.0001, 0.0044, and 0.0015 for PAM, G-5C, and ΔtracrL competitions, respectively. “n” indicates the number of biological replicates.
Figure 5.
Figure 5.. Cas9:tracrL binding is mutagenic.
A) Mutagenesis reporter strain. The S. pyogenes CRISPR-Cas system was integrated into the S. aureus RN4220 genome. tracrL was expressed ectopically on two plasmids from an IPTG-inducible promoter. The CRISPR array contains one spacer targeting ϕNM4γ4. B) Experimental schematic. The reporter strain in (A) was passaged with (+ IPTG) and without (− IPTG) tracrL induction. tracrL expression was induced in all cultures before infecting with ϕNM4γ4 in soft agar. C) Colonies from phage infection in (B) were sequenced to determine if they had mutations in the tracrL target site or PAM. The fraction of surviving OXs relative to the starting population is shown. Data are presented as mean values and error bars are standard error. Significance was determined by a two-tailed, unpaired t-test. n=6 biological replicates.
Figure 6.
Figure 6.. Competing pressures of phage infection and fitness costs lead to cycles of CRISPR-Cas repression and overexpression.
A subpopulation of S. pyogenes overexpresses CRISPR-Cas and is enriched during phage infection when the majority of WT cells lyse. Cas9:tracrL binding is mutagenic and increases the size of this overexpressing population. In the absence of phage, overexpressers are outcompeted due to fitness costs and CRISPR-Cas repression is restored. The cycle begins anew when the population is again threatened by phage.

Similar articles

Cited by

References

    1. Zhang S & Voigt CA Engineered dCas9 with reduced toxicity in bacteria: implications for genetic circuit design. Nucleic Acids Res. 46, 11115–11125 (2018). - PMC - PubMed
    1. Jacobs JZ, Ciccaglione KM, Tournier V & Zaratiegui M Implementation of the CRISPR-Cas9 system in fission yeast. Nat. Commun 5, 5344 (2014). - PMC - PubMed
    1. Aguirre AJ et al. Genomic copy number dictates a gene-independent cell response to CRISPR/Cas9 targeting. Cancer Discov. 6, 914–929 (2016). - PMC - PubMed
    1. Álvarez MM, Biayna J & Supek F TP53-dependent toxicity of CRISPR/Cas9 cuts is differential across genomic loci and can confound genetic screening. Nat. Commun 13, 4520 (2022). - PMC - PubMed
    1. Pul Ü. et al. Identification and characterization of E. coli CRISPR-cas promoters and their silencing by H-NS. Mol. Microbiol 75, 1495–1512 (2010). - PubMed

MeSH terms

Substances