. 2024 Sep;9(9):2278-2291.
doi: 10.1038/s41564-024-01756-0. Epub 2024 Jul 12.

Bacterial reprogramming of tick metabolism impacts vector fitness and susceptibility to infection

Affiliations

Bacterial reprogramming of tick metabolism impacts vector fitness and susceptibility to infection

Sourabh Samaddar et al. Nat Microbiol. 2024 Sep.

Abstract

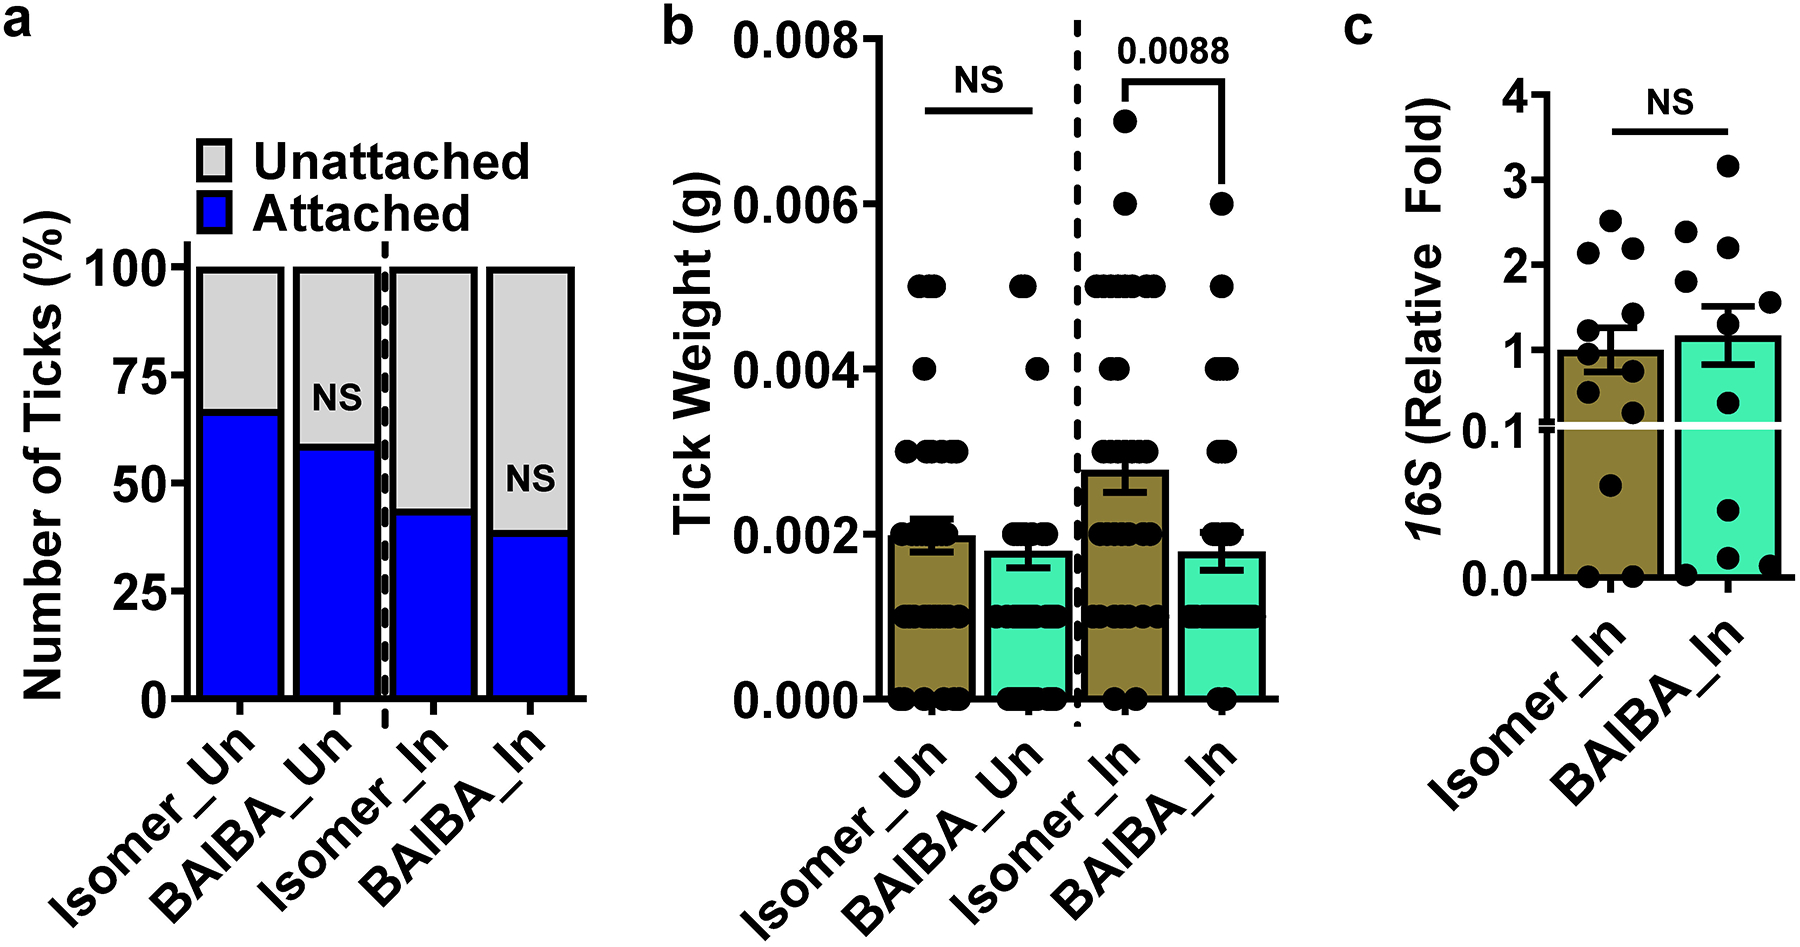
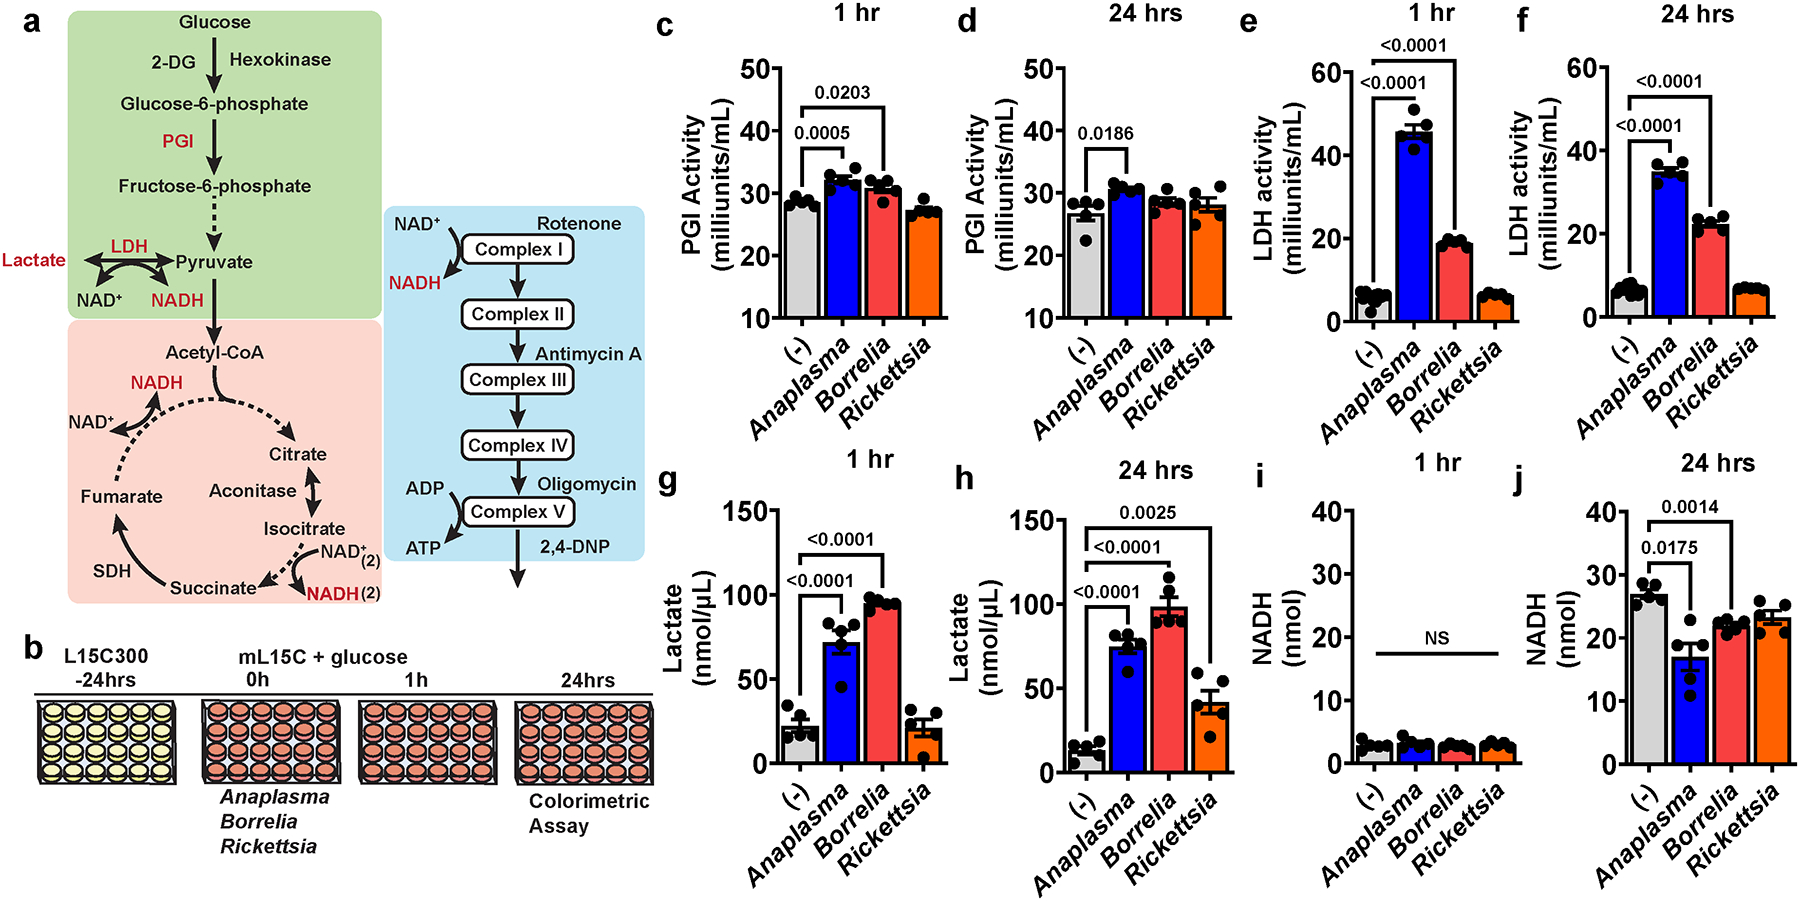
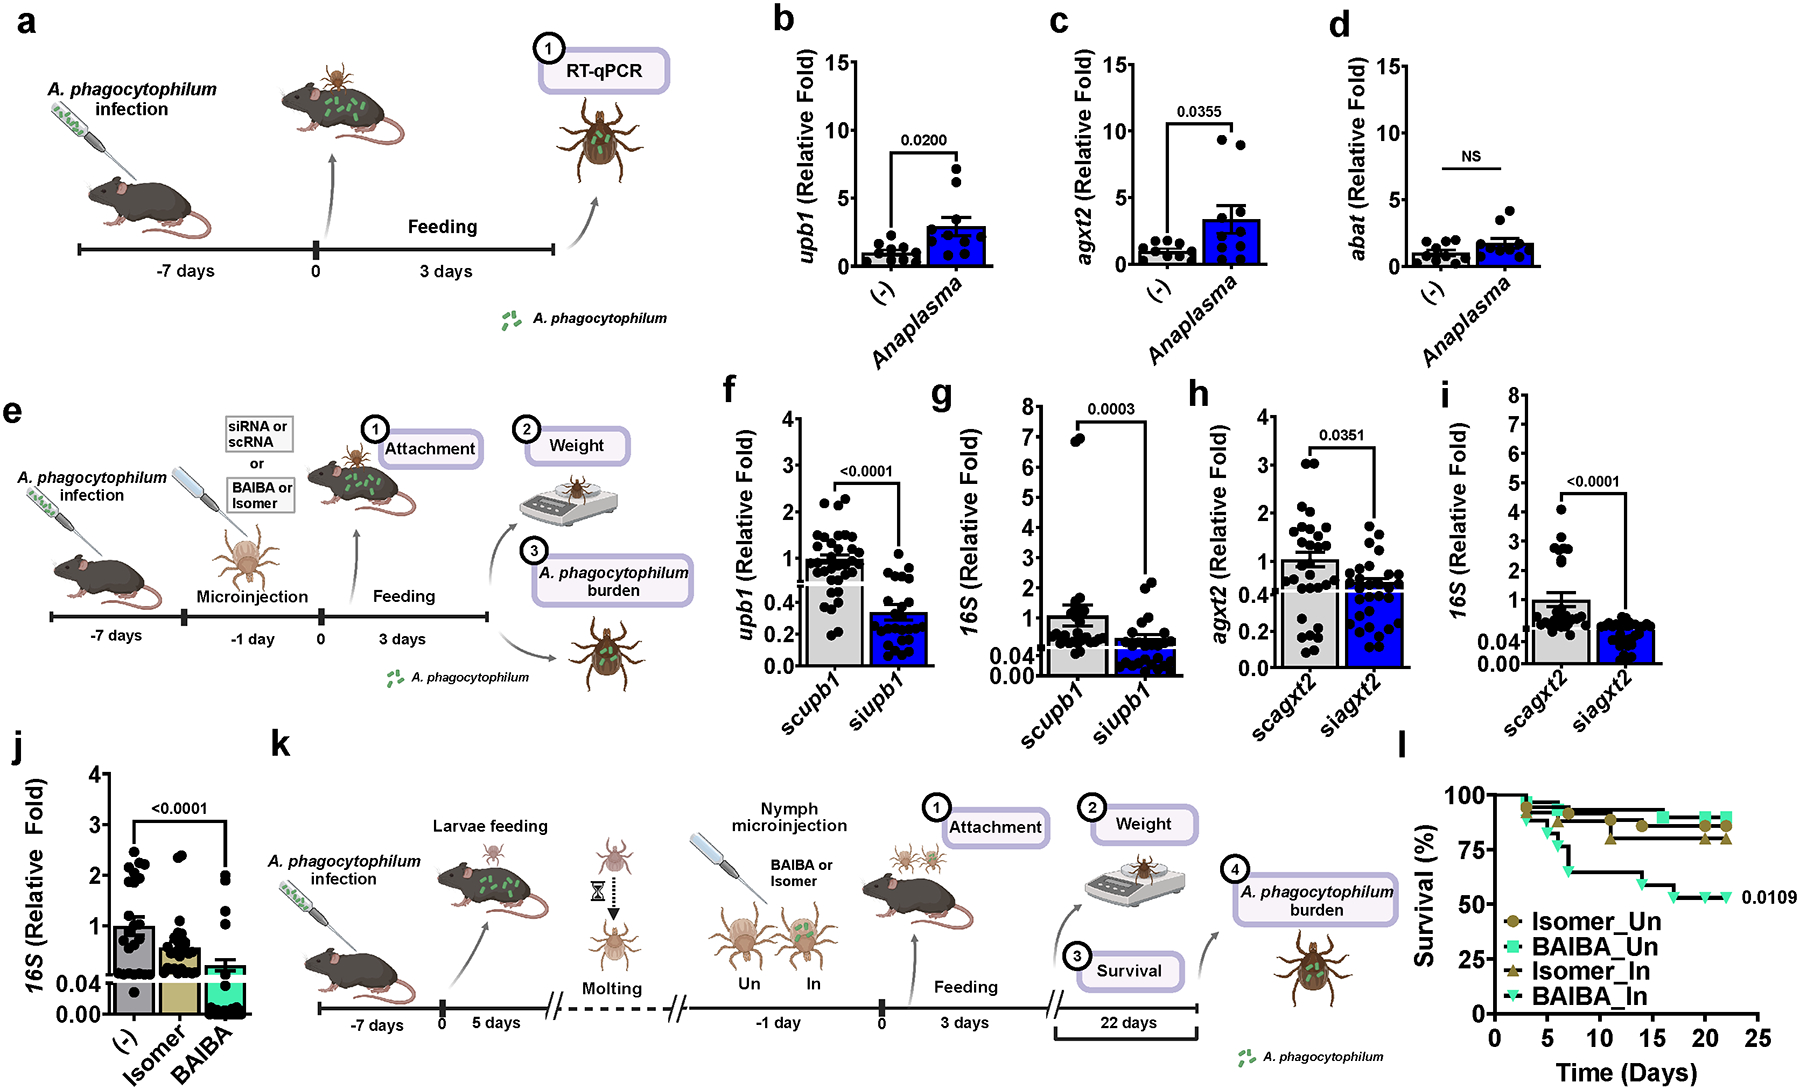
Arthropod-borne pathogens are responsible for hundreds of millions of infections in humans each year. The blacklegged tick, Ixodes scapularis, is the predominant arthropod vector in the United States and is responsible for transmitting several human pathogens, including the Lyme disease spirochete Borrelia burgdorferi and the obligate intracellular rickettsial bacterium Anaplasma phagocytophilum, which causes human granulocytic anaplasmosis. However, tick metabolic response to microbes and whether metabolite allocation occurs upon infection remain unknown. Here we investigated metabolic reprogramming in the tick ectoparasite I. scapularis and determined that the rickettsial bacterium A. phagocytophilum and the spirochete B. burgdorferi induced glycolysis in tick cells. Surprisingly, the endosymbiont Rickettsia buchneri had a minimal effect on bioenergetics. An unbiased metabolomics approach following A. phagocytophilum infection of tick cells showed alterations in carbohydrate, lipid, nucleotide and protein metabolism, including elevated levels of the pleiotropic metabolite β-aminoisobutyric acid. We manipulated the expression of genes associated with β-aminoisobutyric acid metabolism in I. scapularis, resulting in feeding impairment, diminished survival and reduced bacterial acquisition post haematophagy. Collectively, we discovered that metabolic reprogramming affects interspecies relationships and fitness in the clinically relevant tick I. scapularis.


Conflict of interest statement

Competing interests

The authors declare no competing interests.

Figures

Extended Data Figure 1:
Extended Data Figure 1:. Drug susceptibility of tick cell lines.
Cell viability (%) of (a-e) I. scapularis (IDE12), (f-j) Amblyomma americanum (AAE2) and (k-o) Dermacentor andersoni (DAE100) cell lines treated with different inhibitor concentrations for 48 hours (n=5 for each condition; n represents individual culture wells). Purple bars indicate non-significant, whereas red bars denote significant differences in cell viability compared to untreated control (grey). Data are representative of two independent experiments with mean ± SEM. Statistical significance was calculated by one-way ANOVA followed by Dunnett’s multiple comparison test. Significant p values (<0.05) are displayed in the figure.
Extended Data Figure 2:
Extended Data Figure 2:. Growth kinetics of A. phagocytophilum and R. buchneri in ISE6 cells under Seahorse conditions.
(a) Schematic of the infection assay. ISE6 cells were cultured in L15C300 complete medium. Upon infection with A. phagocytophilum or R. buchneri at multiplicity of infection (MOI) 50 or 100, the L15C300 medium was replaced with the modified L15C (mL15C) medium on day 0. Bacterial infection was assessed at 1, 24 and 48 hours post-infection by RT-qPCR. (b-c) A. phagocytophilum infection for (b) MOI 50 or (c) MOI 100, quantified by amplification of 16s rRNA gene (n=10 for each condition; n represents individual culture wells). (d-e) R. buchneri infection for (d) MOI 50 or (e) MOI 100, measured using the citrate synthase (gltA) gene (n=10 for each condition; n represents individual culture wells). Data were normalized to 1 hr, and tick actin was used as a housekeeping gene. Data are representative of two independent experiments with mean ± SEM. Statistical significance was evaluated by (b, d-e) Kruskal Wallis followed by Dunn’s multiple comparison test or (c) one-way ANOVA followed by Dunnett’s multiple comparison test. Significant p values (<0.05) are displayed in the figure.
Extended Data Figure 3:
Extended Data Figure 3:. A. phagocytophilum infection in response to bioenergetic alterations.
(a) Schematic of microbial infection upon glycolysis or OxPhos inhibitor treatment in vitro. 1 x10⁶ ISE6 cells were treated with 50 mM 2-deoxy-D-glucose (2-DG), 0.1 μM rotenone (Rot), 0.5 μM antimycin (Anti), 0.5 μM oligomycin (Oligo) or 20 μM 2,4-dinitrophenol (2,4-DNP) for 1 hour prior to infection with A. phagocytophilum at MOI 50. Cells were collected 2 days post-infection for bacterial quantification. Infected cells without inhibitor treatment (-) served as a control. (b) A. phagocytophilum infection quantified by amplification of 16S rRNA gene (n=5 for each condition; n represents individual culture wells). (c) Experimental design of inhibitor treatment on A. phagocytophilum infection in vivo. Created with BioRender.com. (d-e) Ticks were injected with either PBS (-, grey) or 2-DG (purple) at indicated amounts prior to feeding on A. phagocytophilum-infected C57BL/6 mice. (d) Tick weight (n=17, 29, 14 and 21) and (e) A. phagocytophilum infection (n=7, 17, 7 and 12) were recorded. (f-g) Ticks were injected with either PBS (-, grey) or 0.8 pmol oligomycin (orange) prior to feeding on A. phagocytophilum-infected C57BL/6 mice. (f) Tick weight (n=27 and 31) and (g) A. phagocytophilum infection (n=10 and 12) were measured. (b, d-g) Data are representative of two independent experiments with mean ± SEM. Statistical significance was evaluated by (b, d-e) Kruskal Wallis test followed by Dunn’s multiple comparisons test or (f-g) two-sided Mann-Whitney test. NS=not significant. Significant p values (<0.05) are displayed in the figure.
Extended Data Figure 4:
Extended Data Figure 4:. R. buchneri infection in response to bioenergetic alterations.
(a) Schematic of microbial infection upon glycolysis or OxPhos inhibitor treatment. 1 x10⁶ ISE6 cells were treated with 50 mM 2-deoxy D-glucose (2-DG), 0.1 μM rotenone (Rot), 0.5 μM antimycin (Anti), 0.5 μM oligomycin (Oligo) or 20 μM 2,4-dinitrophenol (2,4-DNP) for 1 hour prior to infection with R. buchneri at MOI 50. Cells were collected 2 days post-infection for bacterial quantification via RT-qPCR. Infected cells without inhibitor treatment (-) served as controls. (b) R. buchneri infection was measured using the citrate synthase (gltA) gene by RT-qPCR (n=6 for each condition, n represents individual culture wells). Data are representative of two independent experiments with mean ± SEM. Statistical significance was evaluated by Kruskal Wallis test followed by Dunn’s multiple comparisons test. Significant p values (<0.05) are displayed in the figure.
Extended Data Figure 5:
Extended Data Figure 5:. Attachment of ticks silenced for genes associated with the D-BAIBA metabolism.
I. scapularis nymphs were injected with siRNA or scrambled control for beta-ureidopropionase 1 (upb1) or alanine-glyoxylate aminotransferase 2 (agxt2) and allowed to feed on uninfected C57BL/6 mice for 3 days. The attachment of silenced ticks compared to scrambled controls was recorded for (a) upb1 (n=69 and 83) or (b) agxt2 (n=76 and 110). Data are representative of two independent experiments where n= an individual tick. Statistical significance was evaluated by the Fisher’s exact test. NS=not significant. Significant p values (<0.05) are displayed in the figure.
Extended Data Figure 6:
Extended Data Figure 6:. Effect of abat silencing on tick fitness.
(a-d) I. scapularis nymphs were injected with siRNA (blue) or scrambled control (grey) for 4-aminobutyrate aminotransferase (abat) and allowed to feed on uninfected C57BL/6 mice for 3 days. Fitness parameters were recorded. (a) Silencing efficiency (n=11 and 10); (b) tick attachment (n=76 and 81); (c) weight (n=37 and 34); and (d) survival (n=30 and 31). (a-d) Data are representative of two independent experiments with mean ± SEM where n= an individual tick. Statistical significance was evaluated by (a, c) two-sided t-test with Welch’s correction for unequal variances (b) Fisher’s exact test (d) Log-rank (Mantel-Cox). NS=not significant. Significant p values (<0.05) are displayed in the figure.
Extended Data Figure 7:
Extended Data Figure 7:. Fitness parameters in ticks silenced for genes related to D-BAIBA metabolism during A. phagocytophilum acquisition.
(a-d) Nymphs were injected with siRNA or scrambled control for genes involved in D-BAIBA metabolism and allowed to feed on A. phagocytophilum-infected mice for 3 days. (a-b) Effect of beta-ureidopropionase 1 (upb1) silencing on (a) attachment (n=100 and 150) and (b) weight (n=33 and 22) of fed ticks compared to the scrambled control treatment. (c-d) Effect of alanine-glyoxylate aminotransferase 2 (agxt2) silencing on (c) attachment (n=146 and 100) and (d) weight (n=38 and 35) of fed ticks compared to the scrambled control treatment. (a-d) Data are representative of two independent experiments with mean ± SEM where n= an individual tick. Statistical significance was evaluated by (a, c) Fisher’s exact test or (b, d) two-sided unpaired t-test with Welch’s correction. NS=not significant. Significant p values (<0.05) are displayed in the figure.
Extended Data Figure 8:
Extended Data Figure 8:. Fitness in ticks microinjected with BAIBA and chronically infected with A. phagocytophilum.
Uninfected (Un) or chronically infected (In) A. phagocytophium nymphs were injected with 40 pmol of β-aminoisobutyric acid (BAIBA) or isomer and allowed to feed on C57BL/6 mice for 3 days. (a) Tick attachment to the mammalian host (n= 93,108, 102 and 97); (b) tick weight (n=62, 64, 45 and 38) and (c) A. phagocytophilum quantification by amplification of the 16S rRNA gene (n=12 and 11). (a-c) Data are representative of two independent experiments with mean ± SEM where n= an individual tick. Statistical significance was evaluated by (a) Fisher’s exact test, (b) two-sided Mann-Whitney test or (c) two-sided unpaired t-test with Welch’s correction. NS=not significant. Significant p values (<0.05) are displayed in the figure.
Extended Data Figure 9:
Extended Data Figure 9:. Contribution of BAIBA to A. phagocytophilum infection in ticks.
Proposed crosstalk between the infection cycle of A. phagocytophilum (brown) and I. scapularis metabolic pathways. Infection induces an expensive host process, and energy is partially supplied by rapid ATP generation through increased glycolysis and conversion of pyruvate to lactate (carbohydrate metabolism, green). Infection with A. phagocytophilum increases fatty acid, cholesterol, and phospholipids levels in the host cell, which are utilized for membrane restructuring and inclusion membrane synthesis during bacterium replication (lipid metabolism, yellow). A. phagocytophilum enhances proteolysis in the host cell and acquires amino acids through ER-dependent trans-Golgi network (TGN) vesicles, scavenging essential amino acids that the bacterium uses for synthesizing its own virulence factors and structural proteins (protein metabolism, blue). A. phagocytophilum also acquires nucleotides and their derivatives from the host to synthesize DNA and RNA for replication (nucleotide metabolism, purple). Finally, A. phagocytophilum synthesizes vitamins and cofactors during the infection cycle which serves as a supplementary source of nutrients for the host (vitamins and cofactors, orange). β-aminoisobutyric acid (BAIBA) acts as a key metabolite, playing pleiotropic roles by connecting the four major metabolic pathways altered by A. phagocytophilum infection: nucleotide, protein, lipid and carbohydrate pathways. Fine-tuned regulation of BAIBA metabolism is required to balance infection and fitness costs in I. scapularis. Figure created with BioRender.com.
Figure 1.
Figure 1.. Alterations in glycolysis and oxidative phosphorylation affects I. scapularis fitness.
(a) Schematic of glycolysis (green), tricarboxylic acid (TCA) (pink) and oxidative phosphorylation (OxPhos; blue) pathways with inhibitors (red). Sequential (solid line) and non-sequential (dashed line) steps are indicated for each pathway. (b-f) 1x 10⁶ ISE6 cells were plated and left unstimulated (-) or treated with inhibitors for 48 hours prior to analysis (n=4 for each condition). Cell viability was determined and compared against unstimulated cells (grey bars). For each drug, concentrations causing a significant decrease on viability are shaded red, while concentrations with non-significant effects on viability are highlighted in blue. (g-h) Extracellular acidification rate (ECAR) and oxygen consumption rate (OCR) of 1.2x 10⁵ ISE6 cells treated with metabolic compounds at different timepoints (indicated by dashed lines and arrows) by the Seahorse analyzer. Untreated cells (-) were used as controls. (g) Glucose (Glu) and 2-Deoxy-D-glucose (2-DG) were administered at 25 mM and 50 mM, respectively (n=6 for each condition). (h) 2,4-dinitrophenol (2,4-DNP), rotenone (Rot) and antimycin A (Anti) were administered at 20 μM, 0.1 μM and 0.5 μM, respectively (n=6 for each condition). (i) Schematic of tick microinjection with inhibitor or PBS. Created with BioRender.com. (j) The percentage of ticks injected with 2-DG that successfully attached to C57BL/6 mice (blue) after 24 hours of placement compared to PBS (-) control (n=75, 50, 50, 50, 25, 25 and 25). (k-l) Ticks were injected with 0.8 pmol of oligomycin and fed on C57BL/6 mice. (k) The length of time to molt to adults and (l) the percentage of ticks that successfully molted (orange) compared to PBS (-) controls (n=10 and 11). (b-h, j-l) Data represent at least two independent experiments with mean ± SEM. Significance was assessed by (b-f) one-way ANOVA followed by Dunnett’s multiple comparison test, (g-h) two-way ANOVA followed by Dunnett’s multiple comparison test (significance displayed for the last timepoint of each treatment), (j) Chi-square test with pairwise comparison post hoc test determined by False Discovery Rate (FDR<0.05), (k) Log rank (Mantel-Cox) test, or (l) Fisher’s exact test. Significant p values (<0.05) are displayed. LDH=lactate dehydrogenase; SDH=succinate dehydrogenase.
Figure 2.
Figure 2.. A. phagocytophilum and B. burgdorferi induce glycolysis upon infection of tick cells.
(a) Schematic of the infection assay. ISE6 cells were cultured in L15C300 complete medium. L15C300 medium was replaced with the modified L15C (mL15C) medium upon infection with A. phagocytophilum, B. burgdorferi, or R. buchneri at day 0. Cells were subjected to Seahorse analysis 2 days post-infection at the indicated multiplicity of infection (MOI). (b-d) ECAR of 1.2 x10⁵ ISE6 cells stimulated with (b) A. phagocytophilum (blue), (c) B. burgdorferi (red), or (d) R. buchneri (orange). Glucose (Glu) and 2-Deoxy-D-glucose (2-DG) were administered at 25 mM and 50 mM, respectively, at indicated timepoints (dashed lines and arrows). Unstimulated cells (-) were used as control (n=6 for each condition). (e-g) OCR of 1.2 x10⁵ ISE6 cells stimulated with (e) A. phagocytophilum, (f) B. burgdorferi, or (g) R. buchneri. 2,4-dinitrophenol (2,4-DNP), rotenone (Rot) and antimycin A (Anti) were administered at 20 μM, 0.1 μM and 0.5 μM, respectively, at indicated timepoints (dashed lines and arrows). Unstimulated cells (-) were used as control (n=6 for each condition). (b-g) Data represent at least two independent experiments with mean ± SEM. Statistical significance was evaluated by two-way ANOVA followed by Dunnett’s multiple comparison test (significance displayed for the last timepoint of each treatment; color gradient representing the MOI). NS=not significant; Significant p values (<0.05) are displayed in the figure.
Figure 3.
Figure 3.. A. phagocytophilum and B. burgdorferi enhance the glycolytic flux from glucose to lactate in tick cells.
(a) Schematic of glycolysis (green), tricarboxylic acid (TCA) cycle (pink) and oxidative phosphorylation (OxPhos; blue). Readouts for glycolytic flux are highlighted in red. Sequential (solid line) and non-sequential (dashed line) steps are indicated for each pathway. (b) Experimental design for colorimetric assays following tick-borne bacterial infection. (c-j) 1 x10⁶ ISE6 cells were plated without stimulation (-) or stimulated with A. phagocytophilum (blue), B. burgdorferi (red), or R. buchneri (orange) for 1 or 24 hours (multiplicity of infection: 50; n=5 for each condition). (c-d) Phosphoglucoisomerase (PGI) activity, (e-f) lactate dehydrogenase (LDH) activity, (g-h) lactate levels and (i-j) reduced nicotinamide adenine dinucleotide (NADH) levels were measured through colorimetric assays at the indicated timepoints. (c-j) Data are representative of at least two independent experiments with mean ± SEM. Statistical significance was evaluated by (c-i) one-way ANOVA followed by Dunnett’s multiple comparison test or (j) Brown Forsythe test followed by a Dunnett T3 multiple comparison test. NS=not significant; Significant p values (<0.05) are displayed in the figure.
Figure 4.
Figure 4.. Global changes to tick cellular metabolism in response to A. phagocytophilum or R. buchneri infection.
ISE6 cells were stimulated with A. phagocytophilum or R. buchneri at MOI 50 for 1 or 24 hours before cell pellets were subjected to UHPLC/MS to determine metabolite abundance. Heatmap represents log10 fold changes in metabolites compared to unstimulated cells (used as control) and displays metabolites which levels were statistically altered after 24 hours of A. phagocytophilum infection. Metabolites were clustered into (a) nucleotide, (b) protein, (c) lipid, (d) vitamin or (e) carbohydrate pathways. β-aminoisobutyric acid (BAIBA) is highlighted in red. Metabolites marked by an asterisk (*) represent significant differences compared to uninfected cells, while a hashtag symbol (#) represents metabolites statistically significant between A. phagocytophilum and R. buchneri infection at the corresponding timepoint. Data represent four independent experiments. Statistical significance was assessed by False Discovery Rate (q values<0.05).
Figure 5.
Figure 5.. BAIBA metabolism affects tick fitness.
(a) Schematic of b-aminoisobutyric acid (BAIBA) metabolism, including its two enantiomers: D-BAIBA and L-BAIBA (red), and its interconnection with carbohydrate, lipid, nucleotide, and protein pathways. Genes involved in BAIBA metabolism, beta-ureidopropionase 1 (upb1), alanine-glyoxylate aminotransferase 2 (agxt2) and 4-aminobutyrate aminotransferase (abat), are outlined in red. (b) Experimental design of tick microinjection of siRNA targeting BAIBA metabolism. Created with BioRender.com. (c-h) Nymphs were injected with siRNA (blue) or scrambled control (grey) for BAIBA metabolizing genes and allowed to feed on uninfected C57BL/6 mice for 3 days. (c) Silencing efficiency (n=26 scrambled and 22 silenced) and (d) weight post-feeding of siupb1 ticks (n=36 scrambled and 30 silenced), normalized to scrambled controls. (e) Survival curve of siupb1- or scupb1-injected ticks recorded up to 18 days post-detachment from mice (n=26 scrambled and 23 silenced). (f) Silencing efficiency (n=22 scrambled and 16 silenced) and (g) weight post-feeding of siagxt2 ticks (n=22 scrambled and 16 silenced), normalized to scrambled controls. (h) Survival curve of siagxt2- or scagxt2-injected ticks recorded up to 18 days post-detachment from mice (n=17 scrambled and 19 silenced). (i) Experimental design of tick microinjection of BAIBA or isomer control (-). Created with Biorender.com. (j) Survival was recorded for up to 18 days (n=11, 14, 14 and 9). (c-h, j) Data are representative of at least two independent experiments with mean ± SEM. Statistical significance was assessed by (c) two-sided unpaired t-test with Welch’s correction, (d, f-g) two-sided Mann-Whitney test, or (e, h, j) Log rank (Mantel-Cox) test. Significant p values (<0.05) are displayed in the figure.
Figure 6.
Figure 6.. BAIBA metabolism is involved in A. phagocytophilum infection in I. scapularis nymphs.
(a) Schematic of tick feeding on A. phagocytophilum-infected C57BL/6 mice. (b-d) Graphs represent the relative expression of (b) beta-ureidopropionase 1 (upb1), (c) alanine-glyoxylate aminotransferase 2 (agxt2) or (d) 4-aminobutyrate aminotransferase (abat) measured after A. phagocytophilum acquisition normalized to uninfected ticks (n=10 for each condition). (e) Experimental design of tick feeding on A. phagocytophilum-infected C57BL/6 mice after microinjection of siRNA targeting genes associated with BAIBA metabolism. (f-i) Nymphs were injected with siRNA (blue) or scrambled control (grey) targeting D-BAIBA metabolizing genes. (f) Silencing efficiency (n=34 scrambled and n=26 silenced) and (g) A. phagocytophilum burden in siupb1 ticks (n=26 scrambled and n=26 silenced), normalized to scrambled controls. (h) Silencing efficiency (n=30 scrambled and n=31 silenced) and (i) A. phagocytophilum burden in siagxt2 ticks (n=28 scrambled and n=34 silenced), normalized to scrambled controls. (j) Nymphs were injected with PBS carrier (-) or 40 pmol of either β-aminoisobutyric acid (BAIBA) or the isomer control (n=24 PBS, n=28 isomer and n=28 BAIBA). Graphs represent A. phagocytophilum infection between conditions, normalized to PBS carrier ticks. (k) Experimental design of altering BAIBA metabolism in chronically A. phagocytophilum-infected nymphs. (l) Uninfected (Un) or chronically A. phagocytophium-infected (In) nymphs were injected with 40 pmol of either b-aminoisobutyric acid (BAIBA, teal) or its isomer (gold). Survival was analyzed for up to 22 days in ticks weighing 2 mg or above (n=35 isomer_Un, 29 BAIBA_Un, 25 isomer_In and 17 BAIBA_In). (b-d, f-j, l) Data are representative of at least two independent experiments with mean ± SEM. Statistical significance was evaluated (b) by two-sided unpaired t-test with Welch’s correction, (c-d, f-i) two-sided Mann-Whitney test, (j) Kruskal Wallis followed by Dunn’s multiple comparisons test, or (l) Log rank (Mantel-Cox) test. NS=not significant. Significant p values (<0.05) are displayed in the figure. Figures a, e and k were created with Biorender.com.

Update of

References

    1. WHO. Vector-borne diseases, https://www.who.int/news-room/fact-sheets/detail/vector-borne-diseases (2020).
    1. Kurokawa C et al. Interactions between Borrelia burgdorferi and ticks. Nat Rev Microbiol 18, 587–600 (2020). - PMC - PubMed
    1. Lochhead RB, Strle K, Arvikar SL, Weis JJ & Steere AC Lyme arthritis: linking infection, inflammation and autoimmunity. Nat Rev Rheumatol 17, 449–461 (2021). - PMC - PubMed
    1. O’Neal AJ, Singh N, Mendes MT & Pedra JHF The genus Anaplasma: drawing back the curtain on tick-pathogen interactions. Pathog Dis 79, ftab022 (2021). - PMC - PubMed
    1. Smith RP Tick-borne diseases of humans. Emerg Infect Dis 11, 1808–1809 (2005).

LinkOut - more resources