. 2024 Oct;30(10):3004-3014.
doi: 10.1038/s41591-024-03125-0. Epub 2024 Jul 12.

Disruption of neural periodicity predicts clinical response after deep brain stimulation for obsessive-compulsive disorder

Affiliations

Disruption of neural periodicity predicts clinical response after deep brain stimulation for obsessive-compulsive disorder

Nicole R Provenza et al. Nat Med. 2024 Oct.

Erratum in

Abstract

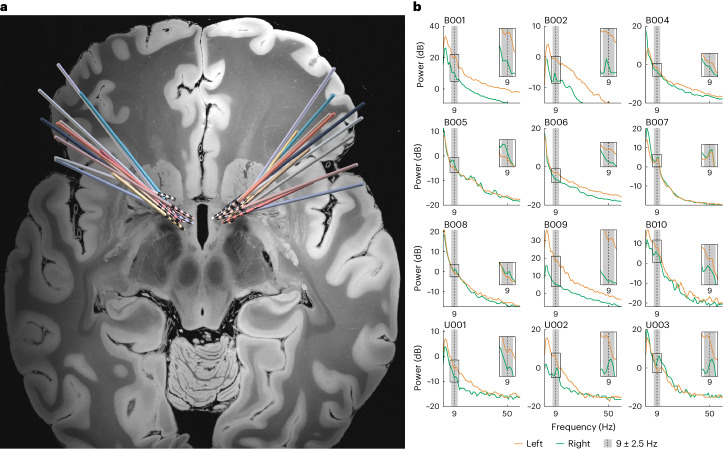
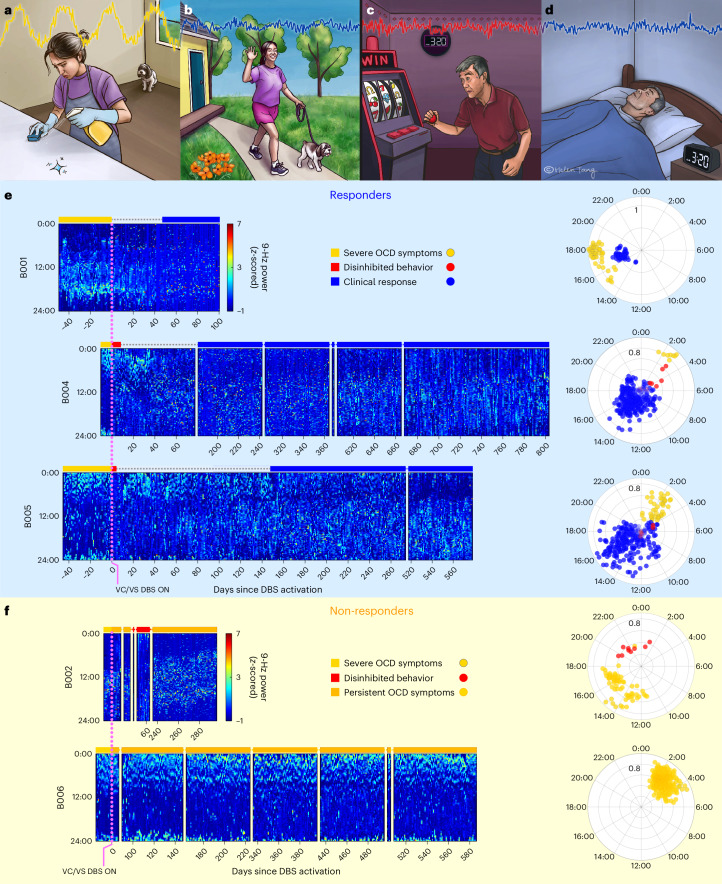
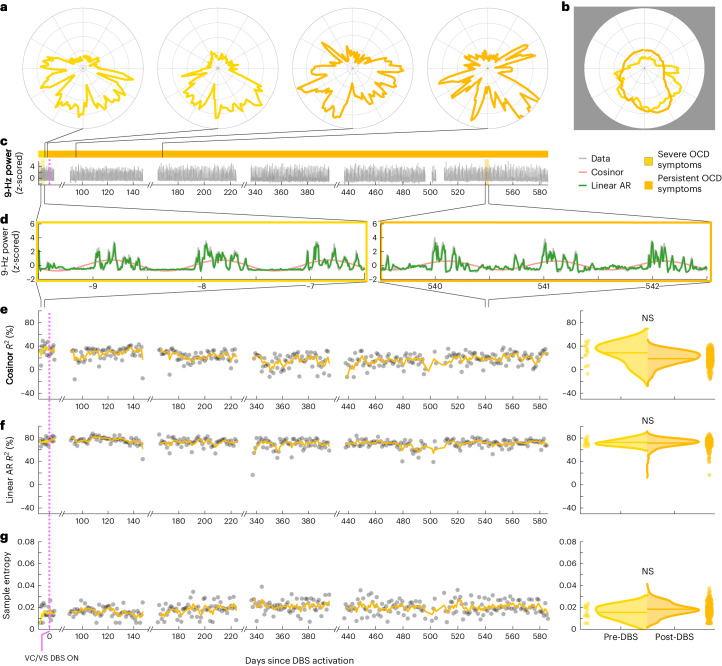
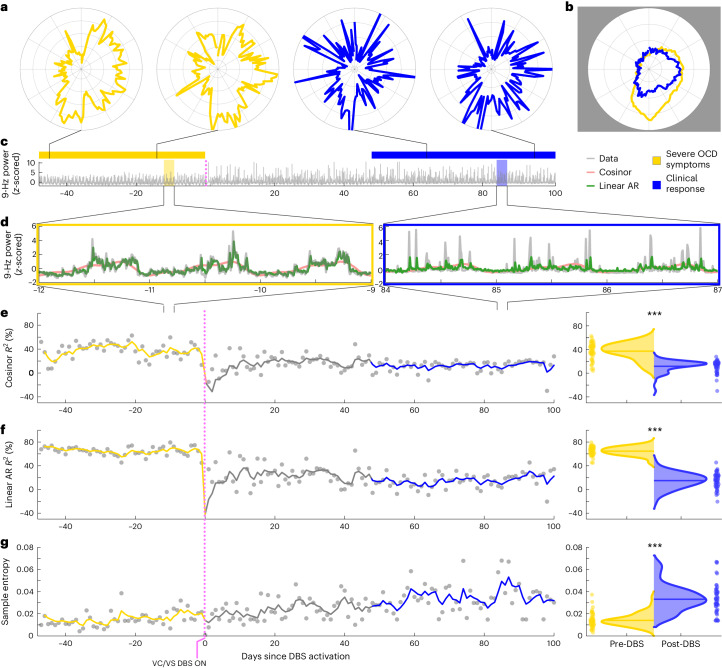
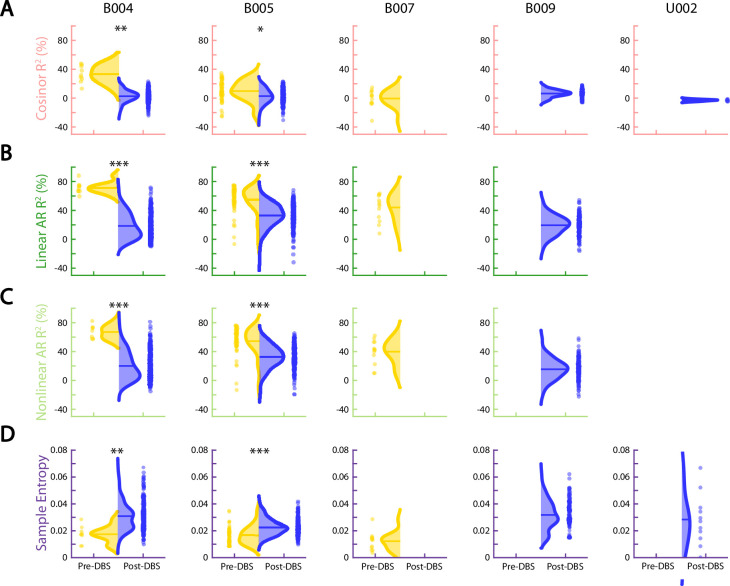
Recent advances in surgical neuromodulation have enabled chronic and continuous intracranial monitoring during everyday life. We used this opportunity to identify neural predictors of clinical state in 12 individuals with treatment-resistant obsessive-compulsive disorder (OCD) receiving deep brain stimulation (DBS) therapy ( NCT05915741 ). We developed our neurobehavioral models based on continuous neural recordings in the region of the ventral striatum in an initial cohort of five patients and tested and validated them in a held-out cohort of seven additional patients. Before DBS activation, in the most symptomatic state, theta/alpha (9 Hz) power evidenced a prominent circadian pattern and a high degree of predictability. In patients with persistent symptoms (non-responders), predictability of the neural data remained consistently high. On the other hand, in patients who improved symptomatically (responders), predictability of the neural data was significantly diminished. This neural feature accurately classified clinical status even in patients with limited duration recordings, indicating generalizability that could facilitate therapeutic decision-making.


Conflict of interest statement

S.A.S. has been a consultant for Boston Scientific, Zimmer Biomet, Koh Young, Sensoria Therapeutics, Varian Medical Systems, Abbott and Neuropace and is co-founder of Motif Neurotech. W.K.G. receives royalties from Nview, LLC and OCDscales, LLC. E.A.S. reports receiving research funding to his institution from the Ream Foundation, the International OCD Foundation and the National Institutes of Health. He was formerly a consultant for Brainsway and Biohaven Pharmaceuticals in the past 12 months. He owns stock less than $5,000 in NView/Proem for distribution related to the Y-BOCS scales. He receives book royalties from Elsevier, Wiley, Oxford, the American Psychological Association, Guildford, Springer, Routledge and Jessica Kingsley. A.B.P. has been an advisor to Endoluxe, CSDISCO and SCAN Health Plan and is co-founder and CEO of Audit AI. B.J.M. has received research support from LivaNova and Health Rhythms in the past 2 years. The other authors declare no competing interests.

Figures

Fig. 1
Fig. 1. VS recordings in patients with OCD show narrow band ~9 Hz power feature.
a, Reconstruction of DBS lead placement in VC/VS (n = 12) in standard atlas space. b, Power spectral density plots for each patient (green: left hemisphere; dark yellow: right hemisphere). In some cases, we were only able to acquire recordings from one hemisphere due to stimulation configuration. Insets zoom in on 9 Hz, marked by the vertical dotted line. Gray shaded region shows the frequency band that we configured for chronic recordings (9 ± 2.5 Hz).
Fig. 2
Fig. 2. Temporal dynamics of VS neural activity reflect behavioral phenotype and clinical status.
ad, Illustration depicting prototypical clinical/behavioral states associated with OCD and treatment with DBS. a, Avoidant rituals of the severely symptomatic state. b, Adaptive behaviors of clinical response. c, Excessively approachful behaviors of overstimulation, including disinhibition and decreased need for sleep. d, Balanced activities and sleep/wake patterns characteristic of clinical response. e, Left, heatmaps of left hemisphere VS 9-Hz power (color bar) versus time of day (y axis) and days since VC/VS DBS activation (x axis) in the three clinical responders from Cohort 1. Colored bars over heatmaps indicate behavioral/clinical state. Right, polar plots with cosinor fit amplitude versus acrophase over time. The circadian pattern amplitude clearly distinguishes among the symptomatic state (light yellow; strong circadian pattern), the overly disinhibited state (red; abolished circadian pattern) and clinically stable response (blue; reduced circadian pattern). f, Same as e but for non-responders. There is less separation between the pre-DBS (light yellow) and long-term non-response (dark yellow) states.
Fig. 3
Fig. 3. VS neural activity is highly circadian and predictable in the severe OCD symptom state.
All figure panels were constructed using data from one patient as an example non-responder, B006. a, Circularized plots of daily neural activity patterns showing z-scored 9-Hz power (radial axis) versus time of day (angular axis). The first two plots show representative days from the pre-DBS period, and the second two plots show representative days from the post-DBS period. The data within each day were rotated to align the peak daily amplitude to 3π/2 to allow averaging across days. b, Circularized plot showing the average daily neural activity pattern over the entire pre-DBS period in light yellow and the post-DBS period in dark yellow. c, z-scored 9-Hz power over days throughout the entire monitoring period. d, Callouts of normalized 9-Hz power and model fits showing 3-d periods before DBS (left) and after DBS (right). We fit a cosinor model (pink) and linear autoregressive model (green) to the raw data (gray). The linear autoregressive model was better able to capture intra-day fluctuations in 9-Hz power than was the cosinor model. The nonlinear model fit is not depicted as it was visually indistinguishable from the linear model fit. Daily cosinor R2 (e), linear autoregressive R2 (f) and sample entropy values (gray) (g) are plotted over time and overlaid by a 5-d exponential moving average (EMA) line (left). The color of the EMA line over time reflects clinical status as described in b. The half-violin plots (right) indicate the distribution of daily values within each clinical state. The daily values are not significantly different before versus after DBS activation in any of the metrics, via a two-tailed Welch’s t-test without multiple comparisons. Respective P values are 0.066, 0.510 and 0.772. AR, autoregressive; NS, not significant.
Fig. 4
Fig. 4. Clinical response is marked by a significant decrease in the predictability of VS neural activity.
All figure panels were constructed using data from one patient as an example responder, B001. a, Same schema as in Fig. 3a, showing two representative days from the pre-DBS period (light yellow) and two from the post-DBS responder period (blue). b, Circularized plot showing the average daily neural activity pattern over the entire pre-DBS symptomatic period (light yellow) and the post-DBS responder period (blue). cg, Same schema as in Fig. 3c–g. As opposed to the close fits in the non-responder data in Fig. 3, the statistical metrics do not fit the post-DBS period well in this clinical responder. Cosinor amplitude (pink model fit line in d) and R2 (e) are reduced in the post-DBS versus pre-DBS data. The linear autoregressive model (green line in d) does not match the raw data (gray line in d) as well as it did in Fig. 3, and the model R2 (f) is also reduced in the post-DBS versus pre-DBS data. Consistently, sample entropy increases over time. All three metric outputs (half-violin plots in eg) are significantly different between the pre-DBS and post-DBS periods (asterisks), via a two-tailed Welch’s t-test without multiple comparisons. Respective P values are 1.02 × 10−16, 2.46 × 10−40 and 4.10 × 10−14. AR, autoregressive.
Fig. 5
Fig. 5. Autoregressive model output metrics accurately distinguish responder status.
a, Clothesline plots show per-patient delta (that is, normalized to pre-DBS) values for each of the four output measures for the seven patients with pre-DBS and post-DBS data, such that a mean difference could be calculated and five-fold cross-validated (from left to right: cosinor ΔR2, linear autoregressive ΔR2, nonlinear autoregressive ΔR2 and Δ Sample entropy). Blue triangles represent responders, and dark yellow circles represent non-responders. Separation between responders and non-responders was achieved for linear and nonlinear autoregressive ΔR2 values and Δ Sample entropy using a maximum margin classifier (horizontal dashed black line). b, ROC curves demonstrate classifier performance (symptom burdened versus symptom unburdened) of a logistic regression model trained and tested on delta values for each of the four output measures (cosinor ΔR2, pink; linear autoregressive ΔR2, green; nonlinear autoregressive ΔR2, light green; and Δ Sample entropy, purple). c, Analogous clothesline plots to a but including data from all 12 patients, including those with only segments of pre-DBS or post-DBS recordings. U002 does not appear in linear and nonlinear autoregressive R2 estimations due to missing data preventing calculation of the daily output measures. Pre-DBS (light yellow circles with gray outlines) and post-DBS non-responder (dark yellow circles) points represent symptom burdened states, and post-DBS responder (blue triangles) points represent symptom unburdened states. Only the linear autoregressive model narrowly achieved separation between symptom burdened and unburdened states. d, Analogous ROC curves to b but including mean estimates of daily output measures rather than delta values. AR, autoregressive.
Extended Data Fig. 1
Extended Data Fig. 1. Temporal dynamics of ventral striatum neural activity reflects behavioral phenotype and clinical status.
(a) (left), Heatmaps of right hemisphere VS 9 Hz power (colorbar) vs. time of day (y-axis) and days since VC/VS DBS activation (x-axis) in the three clinical responders from Cohort 1. Colored bars over heatmaps indicate behavioral/clinical state. (right), Polar plots with cosinor fit amplitude vs. acrophase over time. The amplitude of the circadian pattern clearly distinguishes between the severely symptomatic state (light yellow with grey outline; strong circadian pattern), overly disinhibited state (red; abolished circadian pattern), and clinically stable response (blue; reduced circadian pattern). (b), Same as in (A) but for non-responders. There is less separation between the pre-DBS symptomatic state (light yellow with grey outline) and the state of long-term non-response (dark yellow).
Extended Data Fig. 2
Extended Data Fig. 2. Ventral striatum output measures distinguish pre-DBS severe symptom state from post-DBS clinical response.
(a) Half-violin plots indicate the distribution of daily cosinor R2 values for the pre-DBS severe OCD symptom state (yellow) and the post-DBS clinical response state (blue). The horizontal line denotes the median of each distribution. Distributions with a statistically significant difference (*p < 0.01, **p < 10-4, ***p < 10-6) between the pre-DBS and clinical response period using two-tailed Welch’s t-tests without multiple comparisons are denoted with an asterisk above the corresponding plot. Panels B, C, and D are formatted identically to Panel A, but show (b) daily linear AR R2, (c) daily non-linear AR R2, and (d) daily sample entropy. U002 does not appear in linear and nonlinear autoregressive R2 estimations due to missing data preventing calculation of the daily output measures. Exact p-values correspond to the top-left quadrant of Extended Data Tables 1–4. Abbreviations: R2, coefficient of determination; AR, autoregression.
Extended Data Fig. 3
Extended Data Fig. 3. Ventral striatum output measures are indistinguishable before and after DBS in non-responders.
(a) Half-violin plots indicate the distribution of daily cosinor R2 values for the pre-DBS severe OCD symptom state (yellow) and the post-DBS persistent symptom state state (dark yellow). The horizontal line denotes the median of each distribution. Distributions with a statistically significant difference (*p < 0.01, **p < 10-4, ***p < 10-6) between the pre-DBS and clinical response period are denoted with an asterisk above the corresponding plot. Panels B, C, and D are formatted identically to Panel A, but show (b) daily linear AR R2, (c) daily non-linear AR R2, and (d) daily sample entropy. Exact p-values correspond to the top-left quadrant of Extended Data Tables 1–4 for B002 and B008 and the top-left quadrant of Extended Data Table 5 for U001. Abbreviations: R2, coefficient of determination; AR, autoregression.

References

    1. Insel, T. et al. Research domain criteria (RDoC): toward a new classification framework for research on mental disorders. Am. J. Psychiatry167, 748–751 (2010). - PubMed
    1. Mostofsky, S. H. & Simmonds, D. J. Response inhibition and response selection: two sides of the same coin. J. Cogn. Neurosci.20, 751–761 (2008). - PubMed
    1. Botvinick, M. M., Braver, T. S., Barch, D. M., Carter, C. S. & Cohen, J. D. Conflict monitoring and cognitive control. Psychol. Rev.108, 624–652 (2001). - PubMed
    1. Kahneman, D. Thinking, Fast and Slow (Macmillan, 2011).
    1. Gillan, C. M. et al. Enhanced avoidance habits in obsessive-compulsive disorder. Biol. Psychiatry75, 631–638 (2014). - PMC - PubMed

Publication types

LinkOut - more resources