

Comprehensive analysis of the Xya riparia genome uncovers the dominance of DNA transposons, LTR/Gypsy elements, and their evolutionary dynamics
- PMID: 38997681
- PMCID: PMC11245825
- DOI: 10.1186/s12864-024-10596-5
Comprehensive analysis of the Xya riparia genome uncovers the dominance of DNA transposons, LTR/Gypsy elements, and their evolutionary dynamics
Abstract
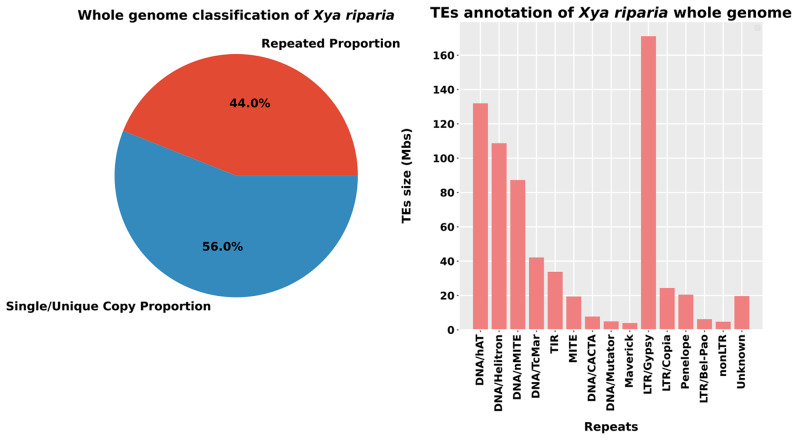
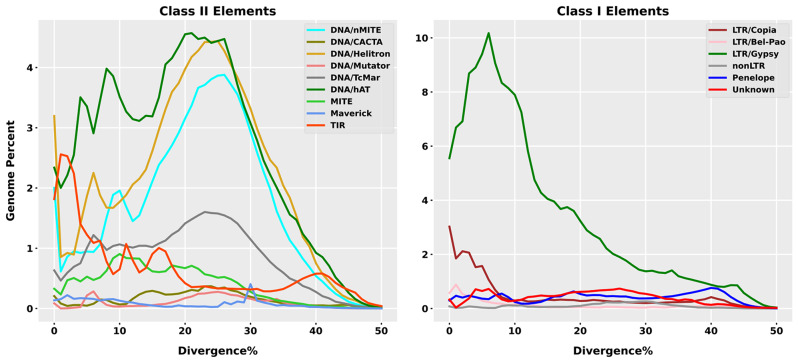
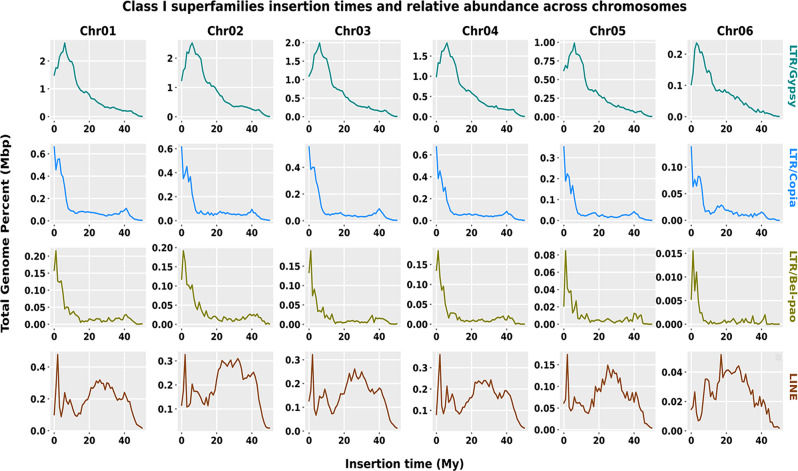
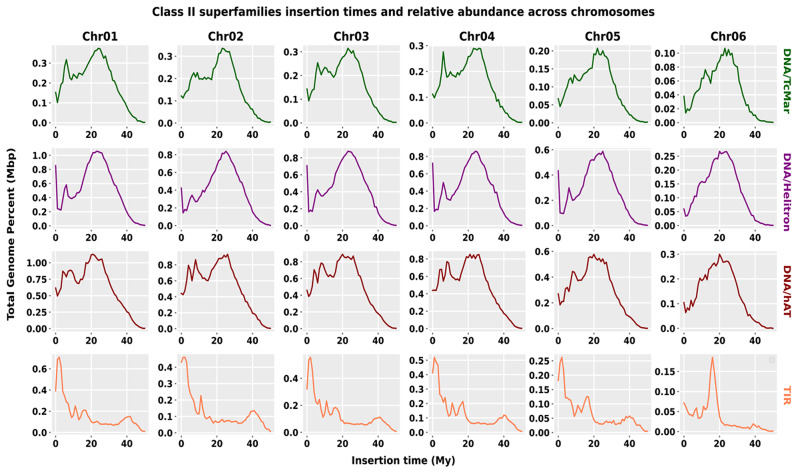
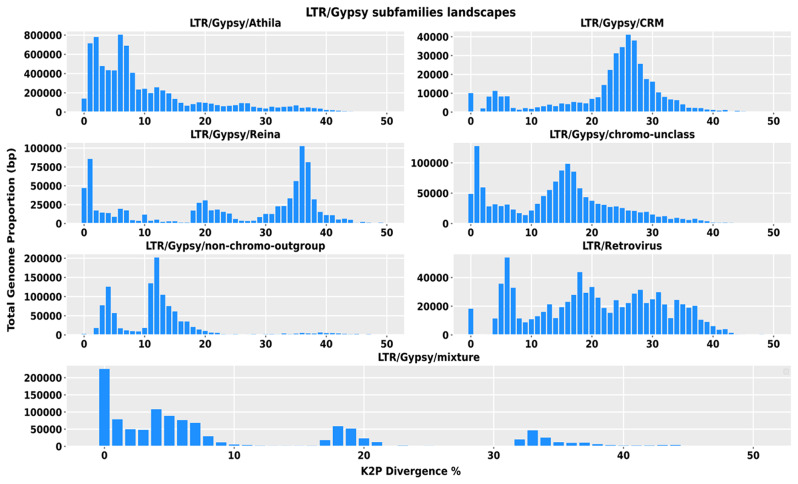
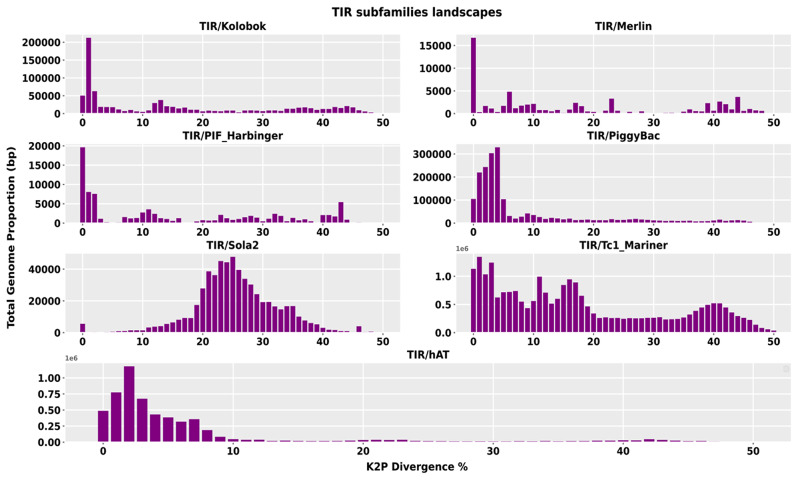
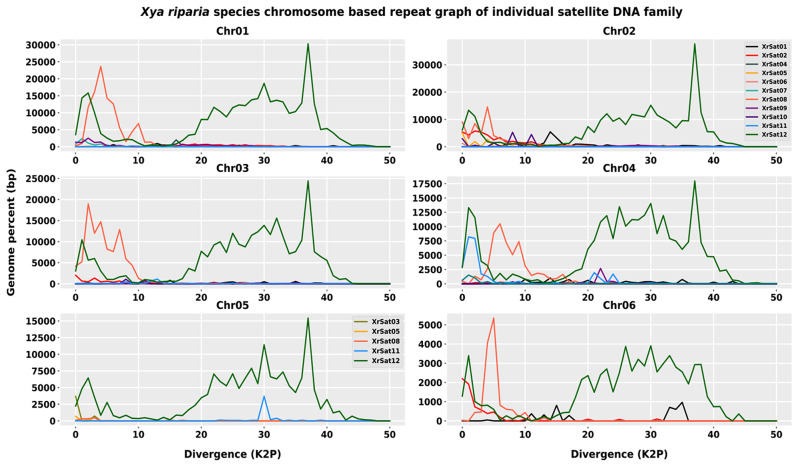
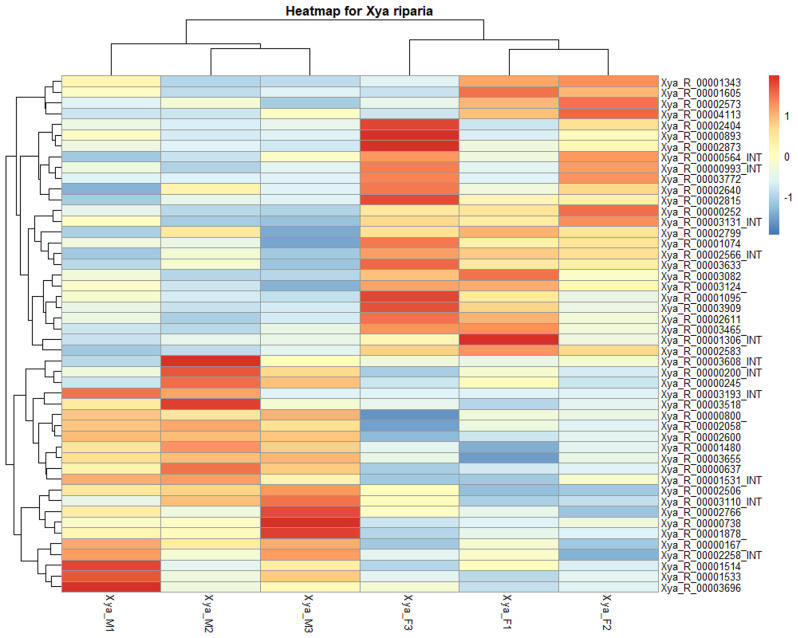
Transposable elements (TEs) are DNA sequences that can move or replicate within a genome, and their study has become increasingly important in understanding genome evolution and function. The Tridactylidae family, including Xya riparia (pygmy mole cricket), harbors a variety of transposable elements (TEs) that have been insufficiently investigated. Further research is required to fully understand their diversity and evolutionary characteristics. Hence, we conducted a comprehensive repeatome analysis of X. riparia species using the chromosome-level assembled genome. The study aimed to comprehensively analyze the abundance, distribution, and age of transposable elements (TEs) in the genome. The results indicated that the genome was 1.67 Gb, with 731.63 Mb of repetitive sequences, comprising 27% of Class II (443.25 Mb), 16% of Class I (268.45 Mb), and 1% of unknown TEs (19.92 Mb). The study found that DNA transposons dominate the genome, accounting for approximately 60% of the total repeat size, with retrotransposons and unknown elements accounting for 37% and 3% of the genome, respectively. The members of the Gypsy superfamily were the most abundant amongst retrotransposons, accounting for 63% of them. The transposable superfamilies (LTR/Gypsy, DNA/nMITE, DNA/hAT, and DNA/Helitron) collectively constituted almost 70% of the total repeat size of all six chromosomes. The study further unveiled a significant linear correlation (Pearson correlation: r = 0.99, p-value = 0.00003) between the size of the chromosomes and the repetitive sequences. The average age of DNA transposon and retrotransposon insertions ranges from 25 My (million years) to 5 My. The satellitome analysis discovered 13 satellite DNA families that comprise about 0.15% of the entire genome. In addition, the transcriptional analysis of TEs found that DNA transposons were more transcriptionally active than retrotransposons. Overall, the study suggests that the genome of X. riparia is complex, characterized by a substantial portion of repetitive elements. These findings not only enhance our understanding of TE evolution within the Tridactylidae family but also provide a foundation for future investigations into the genomic intricacies of related species.
Keywords: Age analysis; Orthoptera; Pygmy mole crickets; Transposable elements.
© 2024. The Author(s).
Conflict of interest statement
The authors declare no competing interests.
Figures

Similar articles
-
Chromosomal distribution and evolution of abundant retrotransposons in plants: gypsy elements in diploid and polyploid Brachiaria forage grasses.Chromosome Res. 2015 Sep;23(3):571-82. doi: 10.1007/s10577-015-9492-6. Chromosome Res. 2015. PMID: 26386563
-
Genome-wide analysis of transposable elements in the coffee berry borer Hypothenemus hampei (Coleoptera: Curculionidae): description of novel families.Mol Genet Genomics. 2017 Jun;292(3):565-583. doi: 10.1007/s00438-017-1291-7. Epub 2017 Feb 15. Mol Genet Genomics. 2017. PMID: 28204924
-
Diversity and evolution of transposable elements in the plant-parasitic nematodes.BMC Genomics. 2024 May 23;25(1):511. doi: 10.1186/s12864-024-10435-7. BMC Genomics. 2024. PMID: 38783171 Free PMC article.
-
Human transposable elements in Repbase: genomic footprints from fish to humans.Mob DNA. 2018 Jan 4;9:2. doi: 10.1186/s13100-017-0107-y. eCollection 2018. Mob DNA. 2018. PMID: 29308093 Free PMC article. Review.
-
Mammalian transposable elements and their impacts on genome evolution.Chromosome Res. 2018 Mar;26(1-2):25-43. doi: 10.1007/s10577-017-9570-z. Epub 2018 Feb 1. Chromosome Res. 2018. PMID: 29392473 Free PMC article. Review.
Cited by
-
Comparative Analysis of Transposable Element Evolution in Crustaceans.Genome Biol Evol. 2025 Jul 3;17(7):evaf115. doi: 10.1093/gbe/evaf115. Genome Biol Evol. 2025. PMID: 40462399 Free PMC article.
References
-
- Woo B. A new species of pygmy mole cricket (Orthoptera: Tridactylidae) from the Lake Wales ridge of Florida and new records of Ellipes eisneri from the northern Brooksville ridge. J Orthoptera Res. 2021;30(2):131–43. doi: 10.3897/jor.30.65603. - DOI
-
- Song H, Amédégnato C, Cigliano MM, Desutter-Grandcolas L, Heads SW, Huang Y, Otte D, Whiting MF. 300 million years of diversification: elucidating the patterns of orthopteran evolution based on comprehensive taxon and gene sampling. Cladistics. 2015;31(6):621–51. doi: 10.1111/cla.12116. - DOI - PubMed
MeSH terms
Substances
LinkOut - more resources
Full Text Sources
Miscellaneous
