. 2024 Jul 12;44(1):32.
doi: 10.1186/s41232-024-00346-1.

Proteomic insights into extracellular vesicles in ALS for therapeutic potential of Ropinirole and biomarker discovery

Affiliations

Proteomic insights into extracellular vesicles in ALS for therapeutic potential of Ropinirole and biomarker discovery

Chris Kato et al. Inflamm Regen. .

Abstract

Background: Extracellular vesicles (EVs) hold the potential for elucidating the pathogenesis of amyotrophic lateral sclerosis (ALS) and serve as biomarkers. Notably, the comparative and longitudinal alterations in the protein profiles of EVs in serum (sEVs) and cerebrospinal fluid (CSF; cEVs) of sporadic ALS (SALS) patients remain uncharted. Ropinirole hydrochloride (ROPI; dopamine D2 receptor [D2R] agonist), a new anti-ALS drug candidate identified through induced pluripotent stem cell (iPSC)-based drug discovery, has been suggested to inhibit ALS disease progression in the Ropinirole Hydrochloride Remedy for Amyotrophic Lateral Sclerosis (ROPALS) trial, but its mechanism of action is not well understood. Therefore, we tried to reveal longitudinal changes with disease progression and the effects of ROPI on protein profiles of EVs.

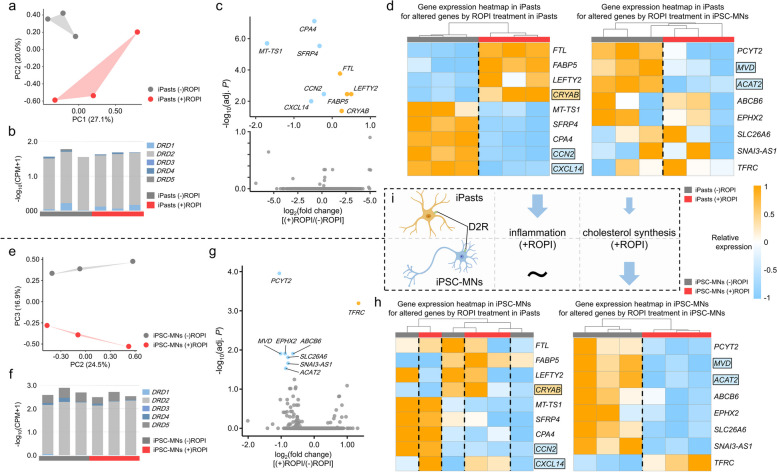
Methods: We collected serum and CSF at fixed intervals from ten controls and from 20 SALS patients participating in the ROPALS trial. Comprehensive proteomic analysis of EVs, extracted from these samples, was conducted using liquid chromatography/mass spectrometer (LC/MS). Furthermore, we generated iPSC-derived astrocytes (iPasts) and performed RNA sequencing on astrocytes with or without ROPI treatment.

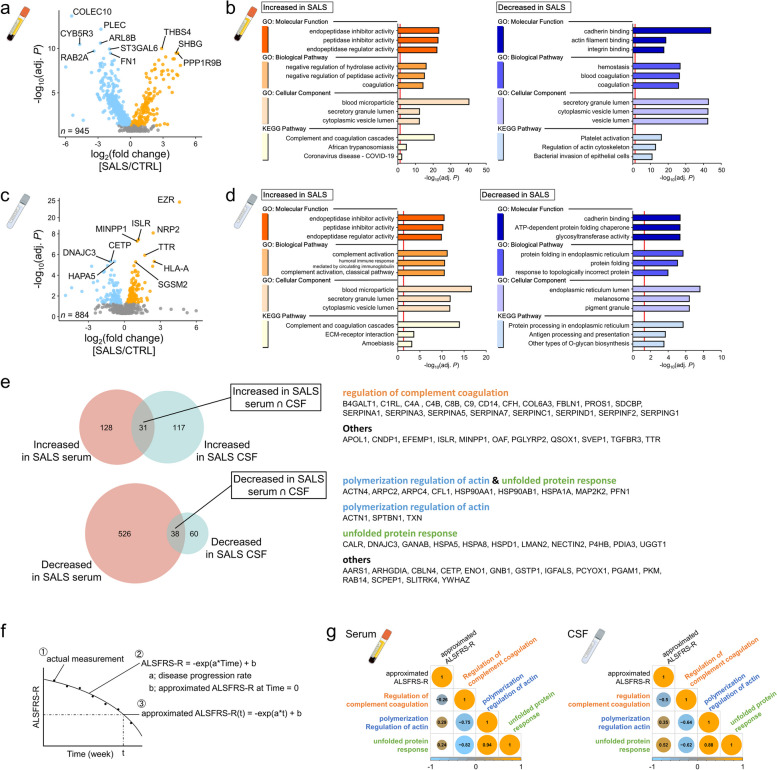
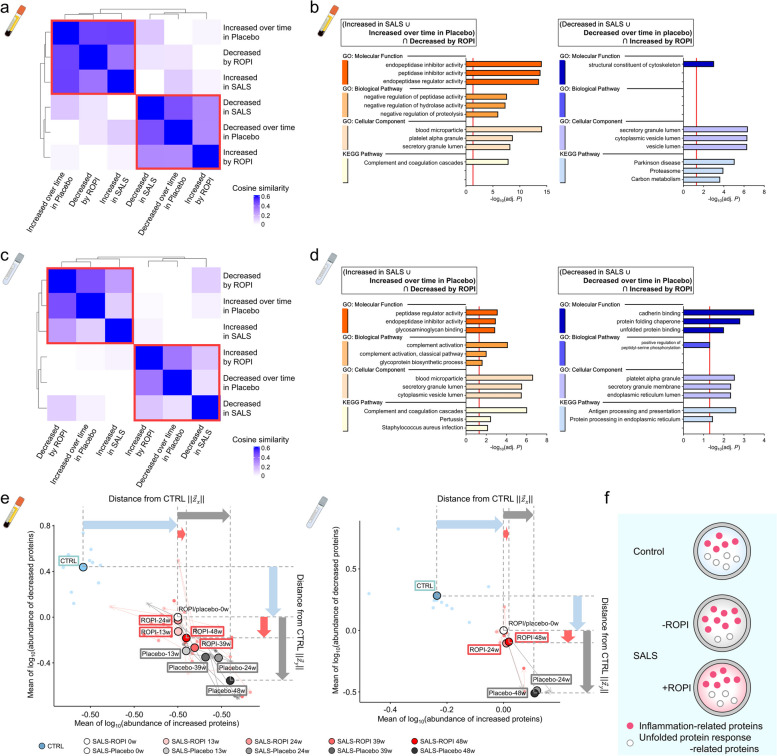
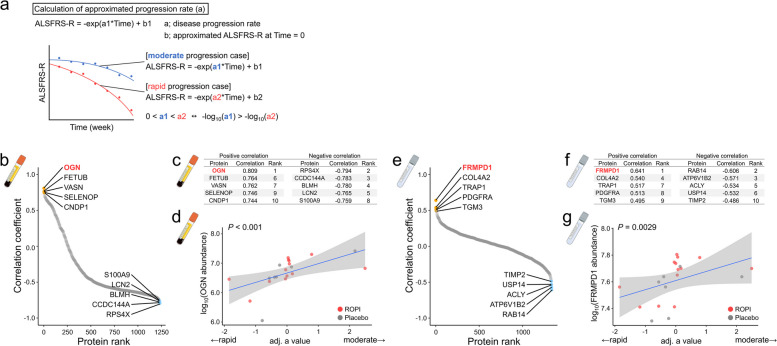
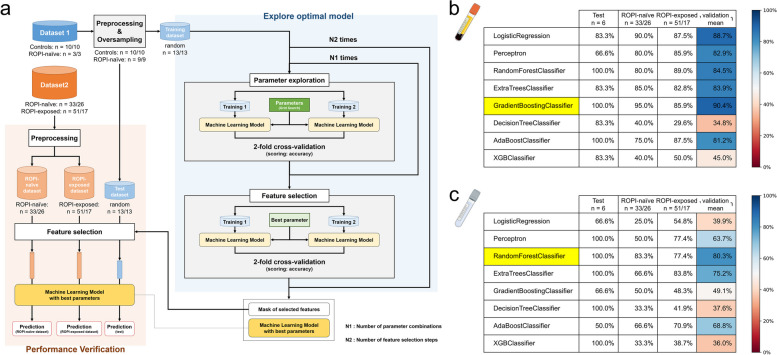
Results: The findings revealed notable disparities yet high congruity in sEVs and cEVs protein profiles concerning disease status, time and ROPI administration. In SALS, both sEVs and cEVs presented elevated levels of inflammation-related proteins but reduced levels associated with unfolded protein response (UPR). These results mirrored the longitudinal changes after disease onset and correlated with the revised ALS Functional Rating Scale (ALSFRS-R) at sampling time, suggesting a link to the onset and progression of SALS. ROPI appeared to counteract these changes, attenuating inflammation-related protein levels and boosting those tied to UPR in SALS, proposing an anti-ALS impact on EV protein profiles. Reverse translational research using iPasts indicated that these changes may partly reflect the DRD2-dependent neuroinflammatory inhibitory effects of ROPI. We have also identified biomarkers that predict diagnosis and disease progression by machine learning-driven biomarker search.

Conclusions: Despite the limited sample size, this study pioneers in reporting time-series proteomic alterations in serum and CSF EVs from SALS patients, offering comprehensive insights into SALS pathogenesis, ROPI-induced changes, and potential prognostic and diagnostic biomarkers.

Keywords: Amyotrophic lateral sclerosis (ALS); Astrocytes; Blood; Cerebrospinal fluid (CSF); Extracellular vesicle; Induced pluripotent stem cells (iPSCs); Motor neurons; Proteomics; Time-series.


Conflict of interest statement

HO reports grants and personal fees from K Pharma, Inc. during the conduct of the study; personal fees from Sanbio Co. Ltd., outside the submitted work. In addition, HO has a patent on a therapeutic agent for amyotrophic lateral sclerosis and composition for treatment licensed to K Pharma, Inc. The other authors have declared that no conflict of interest exists.

Figures

Fig. 1
Fig. 1
Protein profiles of sEVs and cEVs differ between controls and SALS patients. a Overview of the ROPALS trial and timing of serum and CSF sampling. b Scheme of the study: EVs were extracted from serum and CSF collected from controls (n = 10, point-in-time collection, from the NCNP Biobank) and SALS patients (n = 20, longitudinal collection) participating in the ROPALS trial and subjected to comprehensive quantitative proteomic analysis using Orbitrap Fusion Lumos mass spectrometer. c Comparison of protein profiles in sEVs and cEVs derived from controls or SALS patients. The Venn diagram shows a comparison of proteins within sEVs and cEVs detected in all samples (using samples from both controls and SALS patients). Bar graphs show the KEGG pathway analysis results for proteins specifically identified in sEVs and cEVs. d UMAP analysis result for all EVs, sEVs and cEVs. e Correlation plots and Pearson’s correlation analysis results for proteins detected in both sEVs and cEVs with respect to their average level in sEVs and cEVs. Each point represents a single protein. f Correlation analysis results of protein profiles detected in both sEVs and cEVs collected from the same subject at the same time. Each point represents the correlation coefficient comparing the content of each protein in sEVs and cEVs collected from the same subject at the same time (Dunnett's test, controls-0w: adj. P = 0.0497, controls-24w: adj. P = 0.0129, controls-48w: adj. P = 0.0129, mean ± s.d.)
Fig. 2
Fig. 2
Comparative analysis of protein profiles of EVs in controls and SALS patients. a, c Volcano plots showing comparisons of proteins within EVs in serum and CSF samples from controls and ROPI-naive SALS patients (sEVs: a, cEVs: c). Comparisons were made for proteins detected in all samples from controls and ROPI-naive SALS patients. Comparisons between controls and SALS patients were performed using Student’s t test on log10-transformed data and corrected for the P value using Storey's method. b, d GO (BP, CC, MF) and KEGG pathway analysis results for DAPs (controls vs SALS patients) in sEVs and cEVs (sEVs: b, cEVs: d). e Left: Comparison of DAPs (samples from controls vs samples from SALS patients) in sEVs and cEVs. Right: Lists of proteins commonly decreased/increased in sEVs and cEVs in SALS patients compared with those in controls and their GO (BP) and KEGG pathway clustering analysis results. Letter colors indicate groups (orange: regulation of complement coagulation, blue: polymerization regulation of actin, green: unfolded protein processing, black: other). f Schematic representation of disease progression modeling methods and aALSFRS-R calculation. g Pearson correlation analysis between the mean levels of each protein belonging to the regulation of complement coagulation, polymerization regulation of actin, and unfolded protein processing groups and the aALSFRS-R at the time of sampling. The size of the circles represents the correlation coefficient
Fig. 3
Fig. 3
Changes in protein profiles of EVs by ROPI administration. a, e Rank plot showing Cohen's d comparing the log2(fold change) in the ROPI group and placebo group for each patient and each protein in sEVs or cEVs at week 0 and 24 (sEVs: A, cEVs: E). es-DAPs were identified by Cohen’s d using Student’s t test with a cut-off value of ± 0.5. b, f GO (BP, CC, MF) and KEGG pathway analysis results (sEVs: b, cEVs: f) for es-DAPs (placebo 0–24w vs ROPI 0–24w). c, g Venn diagram comparing es-DAPs (Placebo 0–24w vs ROPI 0–24w) and DAPs (control samples vs SALS patient samples) in sEVs and cEVs (sEVs: c, cEVs: g). d, h GO (BP, CC, MF) and KEGG pathway analysis results (sEVs: d, cEVs: h) for the protein groups that were increased/decreased in SALS patient samples and with ROPI treatment
Fig. 4
Fig. 4
Changes in proteins within EVs over time in SALS patients. a Scheme of time-series analysis using a clustering approach to examine protein changes in sEVs and cEVs over time in SALS patients who participated in the ROPALS trial and had samples available up to 48w. b, d Plots showing log2(fold change) changes in each protein from each sampling time from 0w in patients in the placebo and ROPI groups (sEVs: b, cEVs: d). Clustering analysis (Ward's method, k = 3) of the differential changes in proteins within EVs from 0w to each sampling time in the placebo group classified proteins into three groups according to the change in each protein over time: increased (sEVs: n = 298, b left, red; cEVs: n = 260, d left, red), relatively unchanged (sEVs: n = 297; b, left, gray, cEVs: n = 1073, d, left, gray), and decreased (sEVs: n = 466, b left, blue, cEVs: n = 51, d left, blue). After clustering, changes over time in the ROPI group of proteins belonging to each clustering group were plotted (sEVs: b right; cEVs: d right). Statistical analysis was performed by two-way ANOVA followed by Bonferroni’s multiple-comparisons test. c, e GO (BP, CC, MF) and KEGG pathway analysis (cEVs: c, sEVs: e) for increased and decreased protein groups based on the log2(fold change) clustering results of proteins in EVs in the placebo group. *** indicates statistical significance at P < 0.001
Fig. 5
Fig. 5
Comparison of DAPs, es-DAPs, and protein variation over time. a, c Heatmaps (sEVs: a, cEVs: c) showing cosine similarity analysis results for DAPs (control samples vs SALS patient samples), es-DAPs (placebo 0–24w vs ROPI 024w), and proteins that fluctuated over time. b, d Bar graphs showing GO (BP, CC, MF) and KEGG pathway results for proteins that increased/decreased in SALS patients or increased/decreased over time and that were decreased/increased by ROPI (sEVs: b, cEVs: d). e Scatter plots showing differences from 0w for protein levels that increased in SALS patients or increased over time on the vertical axis and differences from 0w for protein levels that decreased in SALS patients or decreased over time on the horizontal axis (sEVs: left, cEVs: right). Light-colored points indicate each sample, and arrows indicate trends over time. Black-bordered point show the mean for each group. The control plot is the difference between the mean protein content at 0w for each patient and the mean. f Schematic representation of protein composition and ROPI-induced changes in control and SALS EVs
Fig. 6
Fig. 6
Reverse translational research results: ROPI delivery to iPasts and iPSC-MNs. a, e The results of PCA of iPast and iPSC-MN transcriptomes with and without ROPI treatment (red; ( +) ROPI, gray; ( −) ROPI). b, f Dopamine receptor expression in iPasts and iPSC-MNs with and without ROPI treatment. c, g Volcano plots showing changes in iPasts and iPSC-MNs with and without ROPI treatment. d, h Heatmaps showing the expression levels of DEGs identified in the comparative analysis of iPasts and iPSC-MNs with and without ROPI treatment. i Schematic representation of DRD2 expression and ROPI-induced expression changes in iPasts and iPSC-MNs
Fig. 7
Fig. 7
Biomarker search using proteins within EVs to identify clinical indicators of SALS. a Approximation equations were applied to the ALSFRS-R trends of 20 SALS patients enrolled in the ROPALS trial to calculate the aALSFRS-R. In the left figure, the middle line plot shows the measured ALSFRS-R and the predicted ALSFRS-R (aALSFRS-R) of the patients, and the right table shows the predicted results. b, e Rank plots (sEVs: b, cEVs: e) showing the correlation analysis results of the amount of each protein in sEVs or cEVs at 0w and the subsequent rate of adaptation progression (normalized a value). Colors indicate the top five positive and negative proteins. c and f Tables of the top five positive and negative proteins (cEVs: c, sEVs: f). d, g Scatter plots showing the proteins with the highest prediction accuracy compared with the different indices (cEVs: d, sEVs: g)
Fig. 8
Fig. 8
Exploration of diagnostic biomarkers using machine learning methods and generation of machine learning-based classifiers. a Schematic of the learning framework for a limited sample size and unbalanced datasets. This framework consists of three steps: oversampling, parameter searches, and feature selection. b, c Tables and heatmaps showing the accuracy of the trained models according to protein composition (sEVs: b and cEVs: c). The test dataset contains an equal number of samples from controls and SALS patients (ROPI-naive). The ROPI-naive dataset consists of samples collected from SALS patients before they received ROPI, and the ROPI-exposed dataset consists of samples taken from SALS patients after they received ROPI. Accuracy is shown by %, and the average accuracy for the ROPI-naive and ROPI-exposed datasets is shown in the heatmap

References

    1. Chiò A, Logroscino G, Hardiman O, Swingler R, Mitchell D, Beghi E, et al. Prognostic factors in ALS: a critical review. Amyotroph Lateral Scler. 2009;10:310–323. doi: 10.3109/17482960802566824. - DOI - PMC - PubMed
    1. Masrori P, Van Damme P. Amyotrophic lateral sclerosis: a clinical review. Eur J Neurol. 2020;27:1918–1929. doi: 10.1111/ene.14393. - DOI - PMC - PubMed
    1. Zaborowski MP, Balaj L, Breakefield XO, Lai CP. Extracellular vesicles: composition, biological relevance, and methods of study. Bioscience. 2015;65:783–797. doi: 10.1093/biosci/biv084. - DOI - PMC - PubMed
    1. Doyle LM, Wang MZ. Overview of extracellular vesicles, their origin, composition, purpose, and methods for exosome isolation and analysis. Cells. 2019;8:727. doi: 10.3390/cells8070727. - DOI - PMC - PubMed
    1. Barbo M, Ravnik-Glavač M. Extracellular vesicles as potential biomarkers in amyotrophic lateral sclerosis. Genes (Basel) 2023;14:325. doi: 10.3390/genes14020325. - DOI - PMC - PubMed