

Modeling Habitat Suitability of Snow Leopards in Yanchiwan National Reserve, China
- PMID: 38998049
- PMCID: PMC11240653
- DOI: 10.3390/ani14131938
Modeling Habitat Suitability of Snow Leopards in Yanchiwan National Reserve, China
Abstract
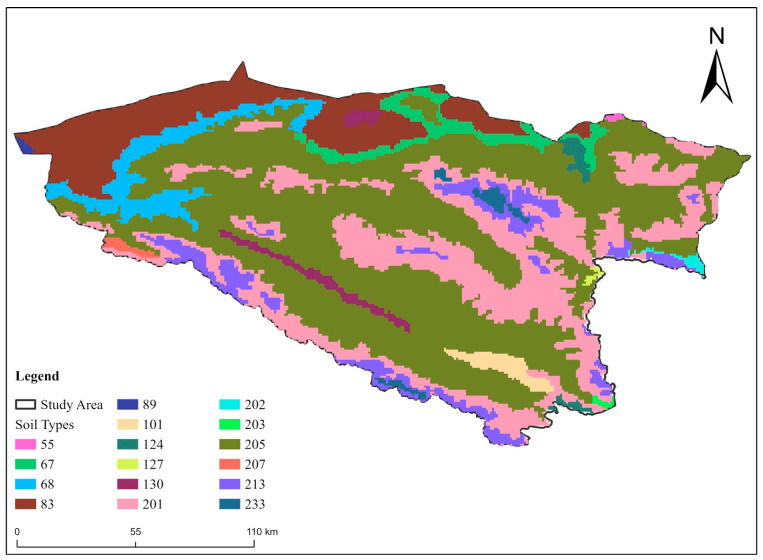
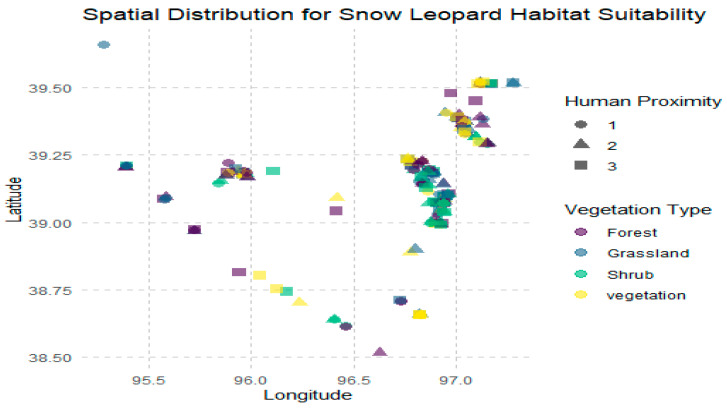
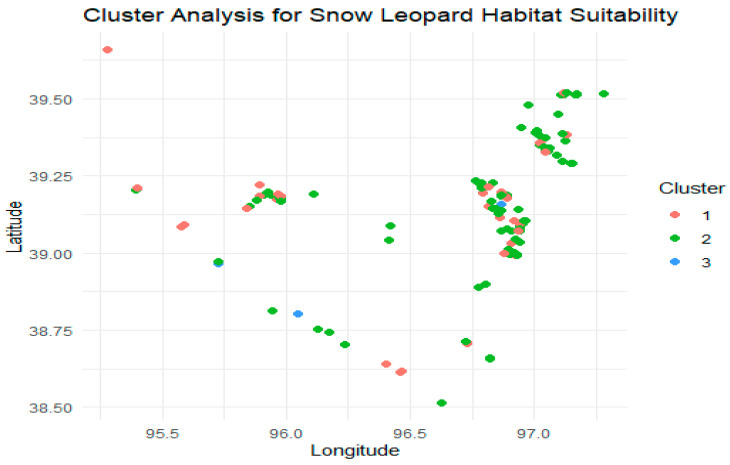
Snow leopards (Panthera uncia) are elusive predators inhabiting high-altitude and mountainous rugged habitats. The current study was conducted in the Yanchiwan National Nature Reserve, Gansu Province, China, to assess the habitat suitability of snow leopards and identify key environmental factors inducing their distribution. Field data collected between 2019 and 2022 through scat sampling and camera trapping techniques provided insights into snow leopard habitat preferences. Spatial distribution and cluster analyses show distinct hotspots of high habitat suitability, mostly concentrated near mountainous landscapes. While altitude remains a critical determinant, with places above 3300 m showing increased habitat suitability, other factors such as soil type, human footprint, forest cover, prey availability, and human disturbance also play important roles. These variables influence ecological dynamics and are required to assess and manage snow leopard habitats. The MaxEnt model has helped us to better grasp these issues, particularly the enormous impact of human activities on habitat suitability. The current study highlights the importance of altitude in determining snow leopard habitat preferences and distribution patterns in the reserve. Furthermore, the study underscores the significance of considering elevation in conservation planning and management strategies for snow leopards, particularly in mountainous regions. By combining complete environmental data with innovative modeling tools, this study not only improves local conservation efforts but also serves as a model for similar wildlife conservation initiatives around the world. By understanding the environmental factors driving snow leopard distribution, conservation efforts can be more efficiently directed to ensure the long-term survival of this endangered species. This study provides valuable insights for evidence-based conservation efforts to safeguard the habitats of snow leopards amidst emerging anthropogenic pressure and environmental fluctuations.
Keywords: Yanchiwan National Nature Reserve; environmental impact; maximum entropy modeling; snow leopard; species conservation.
Conflict of interest statement
Author Peng Xiaoxu was employed by the company Zhejiang Huadong Forestry Engineering Consulting and Design Corporation. The remaining authors declare that the research was conducted in the absence of any commercial or financial relationships that could be construed as a potential conflict of interest.
Figures


Similar articles
-
Assessment of habitat suitability of the snow leopard (Panthera uncia) in Qomolangma National Nature Reserve based on MaxEnt modeling.Zool Res. 2018 Nov 18;39(6):373-386. doi: 10.24272/j.issn.2095-8137.2018.057. Epub 2018 May 24. Zool Res. 2018. PMID: 29872029 Free PMC article.
-
Role of Tibetan Buddhist monasteries in snow leopard conservation.Conserv Biol. 2014 Feb;28(1):87-94. doi: 10.1111/cobi.12135. Epub 2013 Aug 30. Conserv Biol. 2014. PMID: 23992599
-
Habitat suitability of four threatened Himalayan species: Asiatic black bear, common leopard, musk deer, and snow leopard.PeerJ. 2023 Sep 25;11:e16085. doi: 10.7717/peerj.16085. eCollection 2023. PeerJ. 2023. PMID: 37780372 Free PMC article.
-
A spotlight on snow leopard conservation in China.Integr Zool. 2016 Jul;11(4):308-21. doi: 10.1111/1749-4877.12204. Integr Zool. 2016. PMID: 27135283 Review.
-
Prey preferences of the snow leopard (Panthera uncia): regional diet specificity holds global significance for conservation.PLoS One. 2014 Feb 12;9(2):e88349. doi: 10.1371/journal.pone.0088349. eCollection 2014. PLoS One. 2014. PMID: 24533080 Free PMC article. Review.
Cited by
-
Snow Leopard habitat vulnerability assessment under climate change and connectivity corridor in Xinjiang Uygur autonomous region, China.Sci Rep. 2025 Apr 25;15(1):14583. doi: 10.1038/s41598-025-98909-w. Sci Rep. 2025. PMID: 40281209 Free PMC article.
-
Predicting the Impact of Climate Change on the Distribution of North China Leopards (Panthera pardus japonensis) in Gansu Province Using MaxEnt Modeling.Biology (Basel). 2025 Jan 26;14(2):126. doi: 10.3390/biology14020126. Biology (Basel). 2025. PMID: 40001894 Free PMC article.
References
-
- Jackson R.M., Roe J.D., Wangchuk R., Hunter D.O. Surveying Snow Leopard Populations with Emphasis on Camera Trapping: A Handbook. Snow Leopard Conservancy; Sonoma, CA, USA: 2005. p. 73.
-
- Fox J.L. Snow leopard conservation in the wild—A comprehensive perspective on a low density and highly fragmented population; Proceedings of the 7th International Snow Leopard Symposium; Xining, China. 25–30 July 1992.
-
- Jiang Z. Snow leopard. J. Zool. 1994;41:128.
-
- Wen P., Chen X., Wei Y., Yang Z., Dai Q. Habitat suitability evaluation of ungulate protected animals in Baishuihe National Reserve based on MaxEnt model. Sichuan For. Sci. Technol. 2021;42:70–75.
-
- Qiao M., Shi X., Cheng Y., Hu Q., Li W., Zhang H. Prediction of suitable habitat for snow leopard (Panthera uncia) in Wolong National Nature Reserve based on MaxEnt model. Sichuan For. Sci. Technol. 2017;38:1–4+16.
Grants and funding
LinkOut - more resources
Full Text Sources
