. 2024 Jul 5;17(13):3328.
doi: 10.3390/ma17133328.

A Methodology for Shielding-Gas Selection in Wire Arc Additive Manufacturing with Stainless Steel

Affiliations

A Methodology for Shielding-Gas Selection in Wire Arc Additive Manufacturing with Stainless Steel

Felipe Ribeiro Teixeira et al. Materials (Basel). .

Abstract

The main objective of this work was to propose and evaluate a methodology for shielding-gas selection in additive manufacturing assisted by wire arc additive manufacturing (WAAM) with an austenitic stainless steel as feedstock. To validate the proposed methodology, the impact of multi-component gases was valued using three different Ar-based blends recommended as shielding gas for GMA (gas metal arc) of the target material, using CMT (cold metal transfer) as the process version. This assessment considered features that potentially affect the building of the case study of thin walls, such as metal transfer regularity, deposition time, and geometrical and metallurgical characteristics. Different settings of wire-feed speeds were conceived to maintain a similar mean current (first constraint for comparison's sake) among the three gas blends. This approach implied different mean wire-feed speeds and simultaneously forced a change in the deposition speed to maintain the same amount of material deposited per unit of length (second comparison constraint). The composition of the gases affects the operational performance of the shielding gases. It was concluded that by following this methodology, shielding-gas selection decision-making is possible based on the perceived characteristics of the different commercial blends.

Keywords: arc-based AM; austenitic stainless steel; metal transfer index; shielding gas; thin wall; δ-ferrite.


Conflict of interest statement

Authors Fernando Matos Scotti and Erwan Siewert were employed by the company Linde GmbH. The remaining authors declare that the research was conducted in the absence of any commercial or financial relationships that could be construed as a potential conflict of interest.

Figures
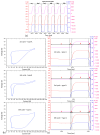
Figure 5
Figure 5
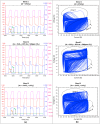
(a) Oscillograms of current (I), voltage (U), and power (P) sampling six CMT cycles; (b) Three voltage × current cyclograms out of the 1st, 3rd, and 6th cycles, respectively; and (c) the oscillograms corresponding to each type of cyclogram identified (A, B, and C), where 1 to 4 are feature regions identified in Figure 4.
Figure 1
Figure 1
(a) Supplementary shielding-gas nozzles coupled to the welding torch, also emphasising the substrate and fixture during the wall building-up; the layer top surface appearance, (b) without and (c) with the use of the additional shielding.
Figure 2
Figure 2
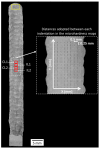
Positions of micrographic analyses (red solid-line squares), δ-ferrite quantification (small white dashed-line rectangle), and hardness map (large white dashed-line rectangle); the microhardness measurement region is magnified to show the distances adopted between each indentation.
Figure 3
Figure 3
Wall deposition with Blend 1 (Ar + 2%CO2), WFSset= 4.9 m/min; DSset = 35 cm/min, CA = −30 and CD = −4): (a) Current (I), voltage (U), and power (P) oscillograms; (b) cyclogram of voltage × current.
Figure 4
Figure 4
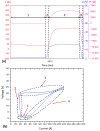
(a) Oscillograms of current (I), voltage (U), and power (P) for a typical CMT cycle; (b) respective voltage × current cyclogram, with the feature regions (1 to 4) that characterise the U and I traces.
Figure 6
Figure 6
(a) Oscillograms of current (I), voltage (U), and power (P), where the brown arrows indicate the arcing-time (tarc) semi-period, and the green arrows indicate the short-circuiting time (tsc) semi-period; (b) cyclograms of the 15th layer sampling.
Figure 7
Figure 7
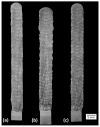
Surface finish (after cleaning with a steel brush) of the walls, using as shielding gases: (a) Blend 1 (Ar + 2%CO2); (b) Blend 2 (Ar + 2%H2 + 20%He + 500 ppm CO2); and (c) Blend 3 (Ar + 1%CO2 + 1%H2).
Figure 8
Figure 8
Geometric characteristics of the main experiments: (a) effective wall width; (b) external wall width; (c) surface waviness; and (d) layer height (standard deviations for surface waviness and layer height were smaller than the resolution of the measurement instruments detailed in Section 2.3.3).
Figure 9
Figure 9
Total deposition times (TDt) for different layer lengths (triangular, circular, and diamond markers consider lengths of 200, 1000, and 5000 mm, respectively) using Blend 1 (Ar + 2%CO2), represented by black continuous lines, Blend 2 (Ar + 2%H2 + 20%He + 500 ppm CO2) by blue dotted lines, and Blend 3 (Ar + 1%CO2 + 1%H2) by orange dashed and dotted lines.
Figure 10
Figure 10
Cross-section macrograph of the walls: (a) Blend 1 (Ar + 2%CO2); (b) Blend 2 (Ar + 2%H2 + 20%He + 500 ppm CO2); and (c) Blend 3 (Ar + 1%CO2 + 1%H2).
Figure 11
Figure 11
Microhardness maps of the walls: (a) Blend 1 (Ar + 2%CO2); (b) Blend 2 (Ar + 2%H2 + 20%He + 500 ppm CO2); and (c) Blend 3 (Ar + 1%CO2 + 1%H2) (the black dots represent the indentation positions).
Figure 12
Figure 12
Schaeffler’s constitutional diagram showing the position of the intercept between Creq and Nieq of the wire composition (Table 3).
Figure 13
Figure 13
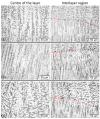
Microstructures (500× magnification and etched with aqua regia) of the walls, using as shielding gas: (a) Blend 1 (Ar + 2%CO2); (b) Blend 2 (Ar + 2%H2 + 20%He + 500 ppm CO2); (c) Blend 3 (Ar + 1%CO2 + 1%H2) (see positions of them in Figure 2).
Figure 14
Figure 14
Fe–Cr–Ni pseudo-binary diagram, considering 63% (by weight) Fe and Creq = 22% and Nieq = 13%.
Figure 15
Figure 15
Ferrite content measured using a Feritscope along the centre of the cross-sections and in the last deposited layer (see referred positions in Figure 2).

References

    1. Norrish J. Advanced Welding Processes—Technologies and Process Control. 1st ed. Woodhead Publishing Limited; Cambridge, UK: 2006. pp. 58–73.
    1. Nobrega G., Souza M.S., Rodríguez-Martín M., Rodríguez-Gonzálvez P., Ribeiro J. Parametric Optimization of the GMAW Welding Process in Thin Thickness of Austenitic Stainless Steel by Taguchi Method. Appl. Sci. 2021;11:8742. doi: 10.3390/app11188742. - DOI
    1. Tasalloti H., Kah P., Martikainen J. Effects of welding wire and torch weaving on GMAW of S355MC and AISI 304L dissimilar welds. Int. J. Adv. Manuf. Technol. 2014;71:197–205. doi: 10.1007/s00170-013-5484-x. - DOI
    1. Scotti A. Mapping transfer modes for stainless steel gas metal arc welding. Sci. Technol. Weld. Join. 2000;5:227–234. doi: 10.1179/136217100101538254. - DOI
    1. Hertel M., Niese J., Rose S., Häßler M., Füssel U., Uhrlandt D. Experimental and numerical investigations into the influence of the shielding gas composition on the GMA spray arc process. Weld. Cut. 2015;14:234–241.

LinkOut - more resources