. 2024 Jun 23;29(13):2988.
doi: 10.3390/molecules29132988.

Development of FluoAHRL: A Novel Synthetic Fluorescent Compound That Activates AHR and Potentiates Anti-Inflammatory T Regulatory Cells

Affiliations

Development of FluoAHRL: A Novel Synthetic Fluorescent Compound That Activates AHR and Potentiates Anti-Inflammatory T Regulatory Cells

Natalija Jonić et al. Molecules. .

Abstract

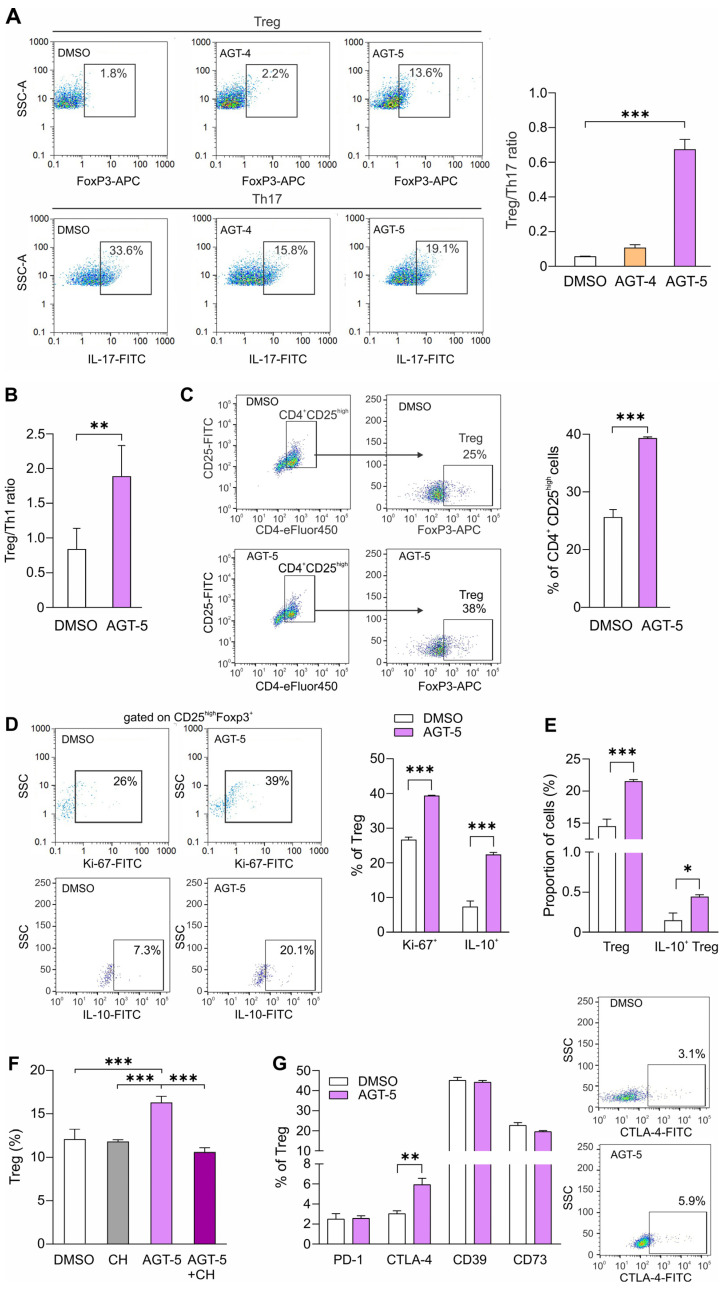
Aryl Hydrocarbon Receptor (AHR) ligands, upon binding, induce distinct gene expression profiles orchestrated by the AHR, leading to a spectrum of pro- or anti-inflammatory effects. In this study, we designed, synthesized and evaluated three indole-containing potential AHR ligands (FluoAHRL: AGT-4, AGT-5 and AGT-6). All synthesized compounds were shown to emit fluorescence in the near-infrared. Their AHR agonist activity was first predicted using in silico docking studies, and then confirmed using AHR luciferase reporter cell lines. FluoAHRLs were tested in vitro using mouse peritoneal macrophages and T lymphocytes to assess their immunomodulatory properties. We then focused on AGT-5, as it illustrated the predominant anti-inflammatory effects. Notably, AGT-5 demonstrated the ability to foster anti-inflammatory regulatory T cells (Treg) while suppressing pro-inflammatory T helper (Th)17 cells in vitro. AGT-5 actively induced Treg differentiation from naïve CD4+ cells, and promoted Treg proliferation, cytotoxic T-lymphocyte-associated antigen 4 (CTLA-4) expression and interleukin-10 (IL-10) production. The increase in IL-10 correlated with an upregulation of Signal Transducer and Activator of Transcription 3 (STAT3) expression. Importantly, the Treg-inducing effect of AGT-5 was also observed in human tonsil cells in vitro. AGT-5 showed no toxicity when applied to zebrafish embryos and was therefore considered safe for animal studies. Following oral administration to C57BL/6 mice, AGT-5 significantly upregulated Treg while downregulating pro-inflammatory Th1 cells in the mesenteric lymph nodes. Due to its fluorescent properties, AGT-5 could be visualized both in vitro (during uptake by macrophages) and ex vivo (within the lamina propria of the small intestine). These findings make AGT-5 a promising candidate for further exploration in the treatment of inflammatory and autoimmune diseases.

Keywords: Aryl Hydrocarbon Receptor (AHR); CYP1A1; T regulatory cell (Treg); inflammation.


Conflict of interest statement

The authors declare no conflicts of interest.

Figures

Figure 1
Figure 1
(A) Known AHR ligands. (B) Synthesis of the three novel fluorescent AHR ligands AGT-4, AGT-5 and AGT-6, based on resorcinol, indole-3-carbinol and methyl yellow scaffolds. Reagents and solvents: (i) NaH, EtOAc, THF, −5 °C, 15 min; (ii) Conc. HCl, MeOH, RT, 15 h; (iii) malononitrile, Ac2O, reflux, 15 h; in condensation reactions, the conditions are: corresponding benzaldehyde, piperidine, MeCN, reflux, 12 h. (C) Absorption spectra and (D) fluorescence spectra of compounds AGT-4, AGT-5, AGT-6 (10 µM), in dimethyl sulfoxide (DMSO), at 37 °C (step 2, ExBw: 5, EmBw: 5).
Figure 2
Figure 2
Docking poses of AGT-4, AGT-5 and AGT-6 in the PAS-B domain of AHR (pdbid: 7ZUB). The ligands are colored green, the interacting amino acids within 5Å are depicted in purple, and the protein is illustrated with grey ribbons.
Figure 3
Figure 3
AHR modulation by newly synthesized molecules FluoAHRLs (AGT-5, AGT-4 and AGT-6). AHR luciferase reporter cell lines and AHR-dependent gene (CYP1A1) expression analysis were used to evaluate AHR activation after the treatment with the putative FluoAHRL, AGT-5, AGT-4 and AGT-6. FICZ was used as a positive control. Measurement of luciferase activity served as a readout for AHR activation and values were normalized to the results obtained from DMSO-treated cells. (A) Luciferase activity in THP-1 cells after 4 h of treatment. (B) Luciferase activity in Caco-2 cells after 4 h of treatment. (C) Luciferase activity in Caco-2 cells after 24 h of treatment. (D) CYP1A1 mRNA expression in Caco-2 cells was measured by qRT-PCR after 1 h, 2 h, 4 h or 24 h of treatment, normalized to the expression of GAPDH and then normalized to the values obtained in DMSO-treated cells at indicated time points. * p < 0.05, ** p < 0.01, *** p < 0.001, **** p < 0.0001 was considered as a statistically significant difference between AHR ligand-treated cells and DMSO-treated cells.
Figure 4
Figure 4
AHR modulation and its impact on macrophage polarization. The effect of FluoAHRL on peritoneal macrophage Cyp1a1 mRNA expression and differentiation. Cyp1a1 mRNA expression (normalized to the expression of β-actin and then normalized to the values obtained in DMSO-treated cells) (A) or protein expression (B) in mouse peritoneal macrophages 4 h after the exposure to FluoAHRL (1.5 µM), DMSO or I3S (1.5 µM). Representative blots are shown. Merged bright-field and fluorescence confocal microscope images of CYP1A1 (stained green) in DMSO- (C) and AGT-5-treated (red) (D) peritoneal macrophages after 24 h of culture (orig. magnification 63×). CYP1A1 expression was determined by analyzing fluorescence intensity with Leica LAS AF lite 3.3.0 software (E). Fluorescence images of DMSO- (F) or AGT-5-treated (G) macrophages and merged bright-field and fluorescence confocal microscope image (H) of AHR (stained green) and AGT-5 (red) in the peritoneal macrophages after 24 h of culture. Signals from AGT-5 (red) (I) and AHR (green) (J) signals were merged (orange) (K). (L) Peritoneal cells were treated with 1.5 µM of FluoAHRL or DMSO, and M1 (F4/80+CD40+) and M2 (F4/80+CD206+) macrophage phenotypes were detected by flow cytometry after 24 h of culture. Representative dot plots are shown below the graph. * p < 0.05, ** p < 0.01, *** p < 0.001 was considered as a statistically significant difference between values obtained from FluoAHRL-treated cells and DMSO-treated cells.
Figure 5
Figure 5
The impact of AGT-4 and AGT-5 on T cell differentiation. Purified CD4+ cells were stimulated with anti-CD3 and anti-CD28 antibodies and exposed to FluoAHRL (1.5 µM) or DMSO for 48 h, after which Th17 cells (IL-17+) and Treg (FoxP3+) were detected on the flow cytometer and presented as Treg/Th17 ratio (A). CD4+ were exposed to anti-CD3 and anti-CD28 antibodies and treated with AGT-5 (1.5 µM) or DMSO for 48 h, and Th1 (IFN-γ+) and Treg (CD25highFoxP3+) profiles were evaluated and presented as Treg/Th1 ratio (B). Naïve CD4+CD25- cells were stimulated with AGT-5 for 48 h only in the presence of the anti-CD3 antibody, after which the Treg proportion (C), their proliferation (Ki-67+) and IL-10 production (D) were evaluated (representative dot plots on the right-hand side). Sorted CD4+CD25high were treated with AGT-5 for 48 h in the presence of the “complete” stimulation cocktail and the proportions of Treg (CD4+CD25highFoxP3+) and IL-10+ Treg were determined by flow cytometry (E) (representative dot plots on the right-hand side). CD4+CD25 cells were stimulated by anti-CD3 and anti-CD28 antibody and treated with AGT-5 (1.5 µM) in the presence or absence of AHR inhibitor CH-223191 (CH, 1.5 µM) and the proportion of Treg was determined (CD4+CD25highFoxP3+) (F). Sorted CD4+CD25high were treated with AGT-5 for 48 h in the presence of the “complete” stimulation cocktail and the proportions of Treg expressing PD-1, CTLA-4, CD39 and CD73 were ascertained (G). Representative dot plots for CTLA-4+ Treg are shown. * p < 0.05, ** p < 0.01, *** p < 0.001 was considered as a statistically significant difference between AGT-5-treated cells and DMSO-treated cells, or between AGT-5+CH-223191-treated cells and AGT-5-treated cells.
Figure 6
Figure 6
AGT-5 impact on T cell signaling. CD4+ were exposed to anti-CD3 and anti-CD28 antibodies and treated with AGT-5 or DMSO for 24 h. STAT3 protein expression (relative to β-actin) and pSTAT3/STAT3 ratio were determined by western blot. Representative blots are shown (4 samples for DMSO and 4 samples for AGT-5; the well in between contains spillover from adjacent wells). * p < 0.05 was considered as a statistically significant difference between AGT-5-treated cells and DMSO-treated cells.
Figure 7
Figure 7
AGT-5 impact on human Treg differentiation and proliferation. Human tonsillar cells were cultured in the presence of increasing concentrations of AGT-5 or DMSO and evaluated for the Treg proportion (B) and proliferating (CFSE+) Treg (C) with flow cytometry after 48 h of cultivation. Representative dot plots (for 0.75 µM dose of AGT-5) are shown (A). * p < 0.05, ** p < 0.01, *** p < 0.001 was considered as a statistically significant difference between AGT-5-treated cells and DMSO-treated cells.
Figure 8
Figure 8
Toxicity assessment of AGT-5 and I3S in zebrafish. The survival/teratogenicity (A) and morphology (B) of zebrafish embryos exposed to different doses of the selected compounds (5, 25, 50, 100 and 150 µM) at 120 h post fertilization (hpf) are shown. In contrast to AGT-5 treatment, due to I3S exposure, live embryos suffered from severe pericardial edema (black arrow), hepatotoxicity (liver necrosis—outlined area; non-resorbed egg yolk—black asterisk), nephrotoxicity (dashed arrow), as well as malformation of the head (bracket), jaw (arrowhead) and eyes (white asterisk).
Figure 9
Figure 9
AGT-5 in vivo elicited responses. Administration of AGT-5 to healthy C57BL/6 mice. AGT-5 (10 mg/kg bw) or DMSO were administered orally for five days (A). Confocal microscopy images of small intestine sections of DMSO-treated (B) and AGT-5-treated animals (C) (the distribution of AGT-5 is indicated by white arrows). Th1, Th17 and Treg were determined in the mesenteric lymph nodes after oral AGT-5 administration (D) and also presented as Treg/Th1 and Treg/Th17 ratio (E). The proportion of CYP1A1+ cells within Treg (F). The representative dot plots show CYP1A1+FoxP3+ cells that are already gated on CD4+CD25high. * p < 0.05, ** p < 0.01 was considered as a statistically significant difference between AGT-5-treated mice and DMSO-treated mice.

Similar articles

Cited by

References

    1. Rothhammer V., Quintana F.J. The aryl hydrocarbon receptor: An environmental sensor integrating immune responses in health and disease. Nat. Rev. Immunol. 2019;19:184–197. doi: 10.1038/s41577-019-0125-8. - DOI - PubMed
    1. Stockinger B., Di Meglio P., Gialitakis M., Duarte J.H. The aryl hydrocarbon receptor: Multitasking in the immune system. Annu. Rev. Immunol. 2014;32:403–432. doi: 10.1146/annurev-immunol-032713-120245. - DOI - PubMed
    1. Stockinger B., Shah K., Wincent E. AHR in the intestinal microenvironment: Safeguarding barrier function. Nat. Rev. Gastroenterol. Hepatol. 2021;18:559–570. doi: 10.1038/s41575-021-00430-8. - DOI - PMC - PubMed
    1. Marshall N.B., Kerkvliet N.I. Dioxin and immune regulation: Emerging role of aryl hydrocarbon receptor in the generation of regulatory T cells. Ann. N. Y. Acad. Sci. 2010;1183:25–37. doi: 10.1111/j.1749-6632.2009.05125.x. - DOI - PMC - PubMed
    1. Cannon A.S., Nagarkatti P.S., Nagarkatti M. Targeting AhR as a Novel Therapeutic Modality against Inflammatory Diseases. Int. J. Mol. Sci. 2021;23:288. doi: 10.3390/ijms23010288. - DOI - PMC - PubMed

LinkOut - more resources