. 2024 Jun 27;13(13):1784.
doi: 10.3390/plants13131784.

Identification of PgRg1-3 Gene for Ginsenoside Rg1 Biosynthesis as Revealed by Combining Genome-Wide Association Study and Gene Co-Expression Network Analysis of Jilin Ginseng Core Collection

Affiliations

Identification of PgRg1-3 Gene for Ginsenoside Rg1 Biosynthesis as Revealed by Combining Genome-Wide Association Study and Gene Co-Expression Network Analysis of Jilin Ginseng Core Collection

Sizhang Liu et al. Plants (Basel). .

Abstract

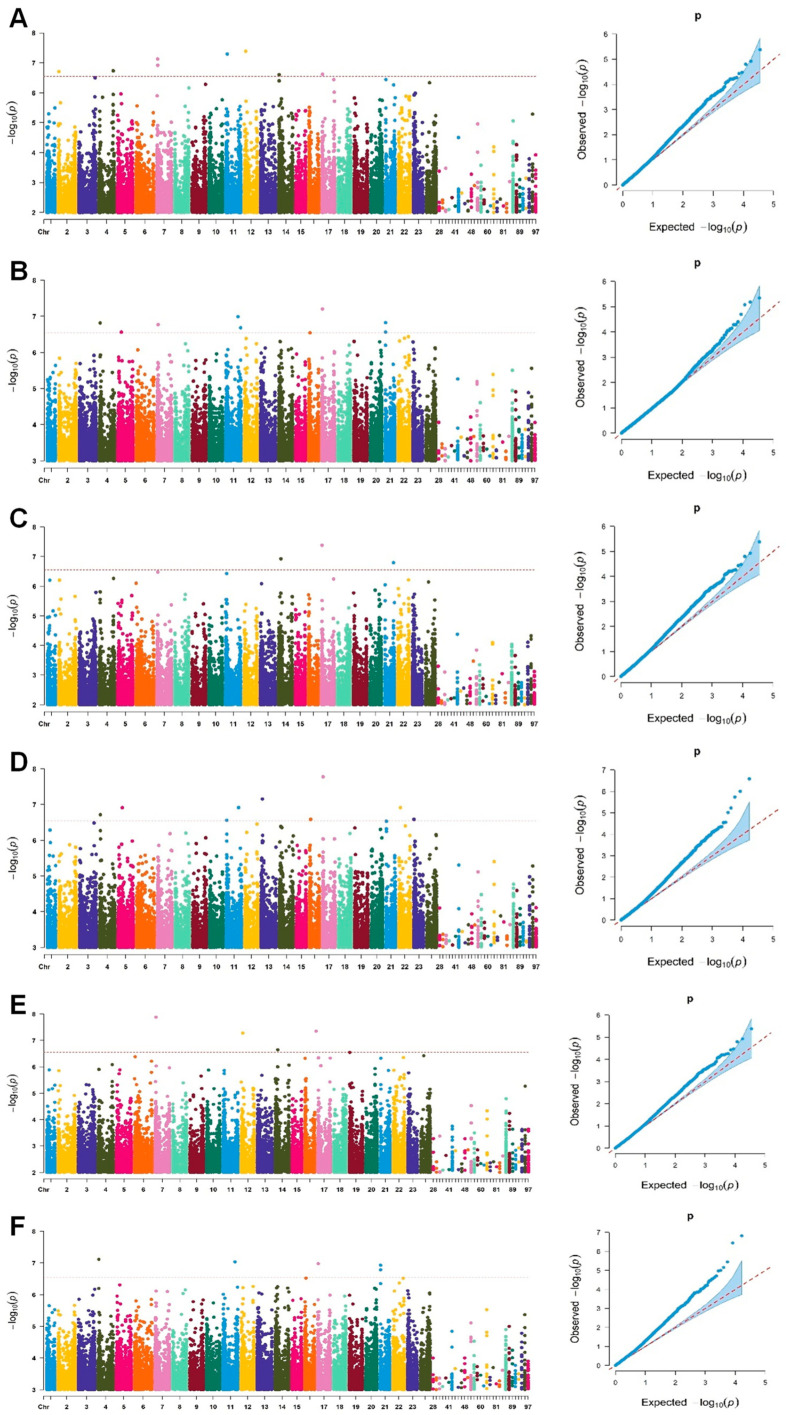
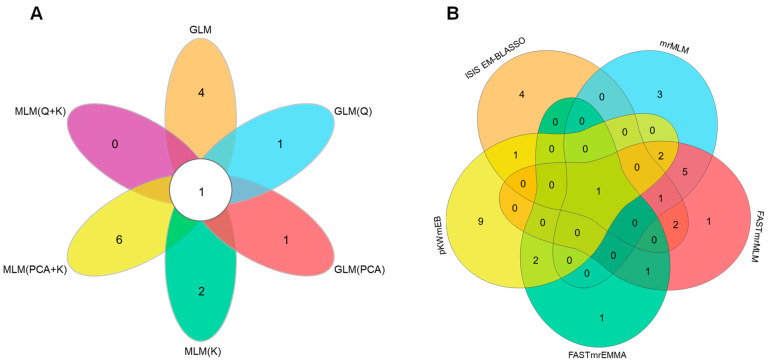
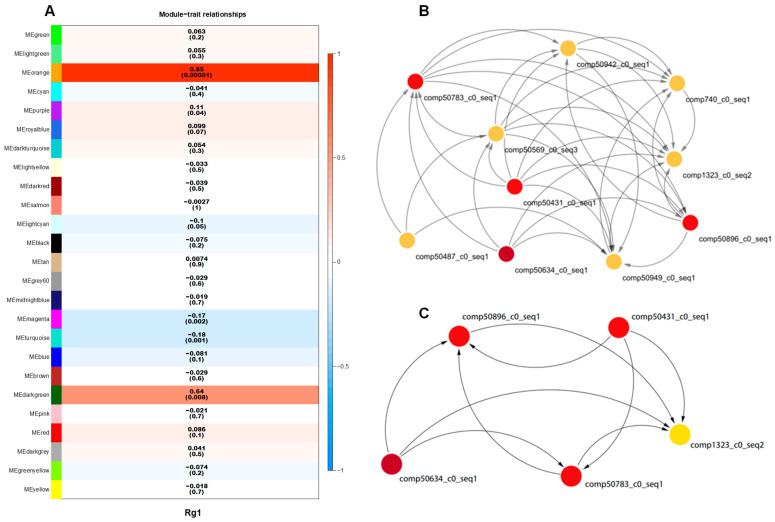
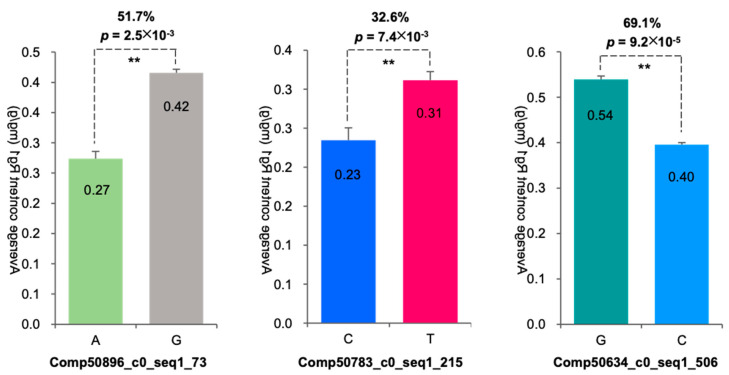
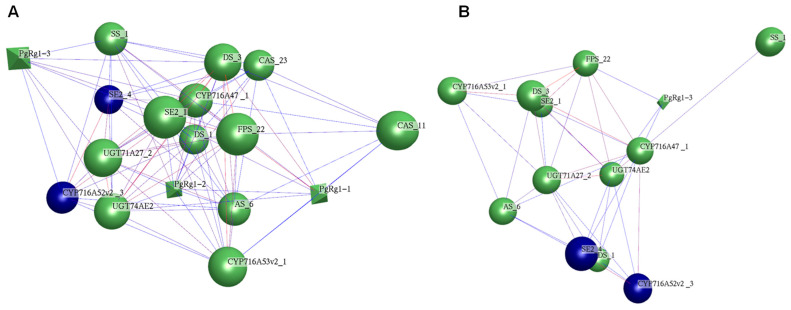
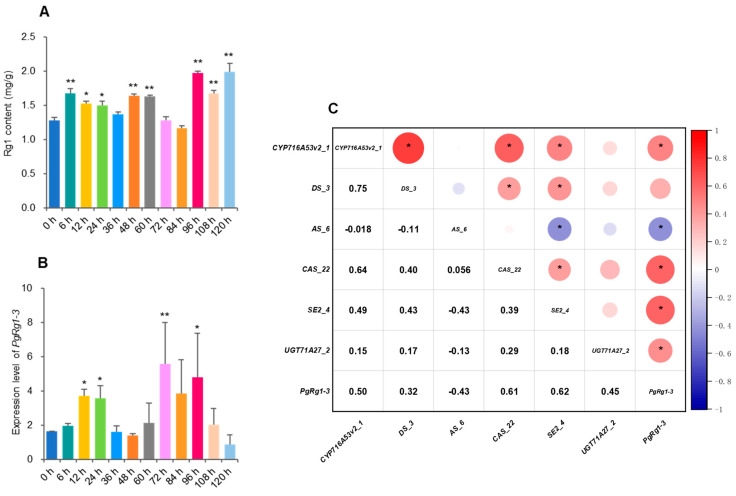
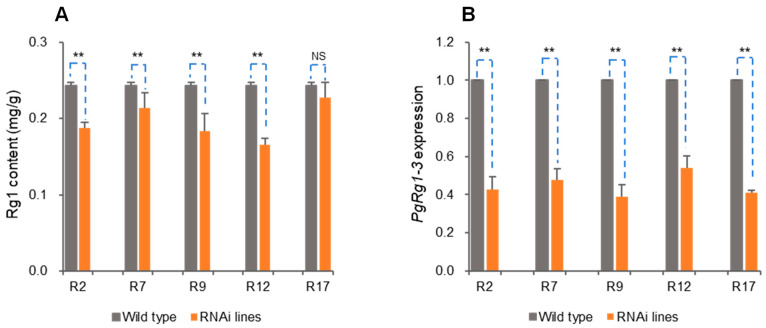
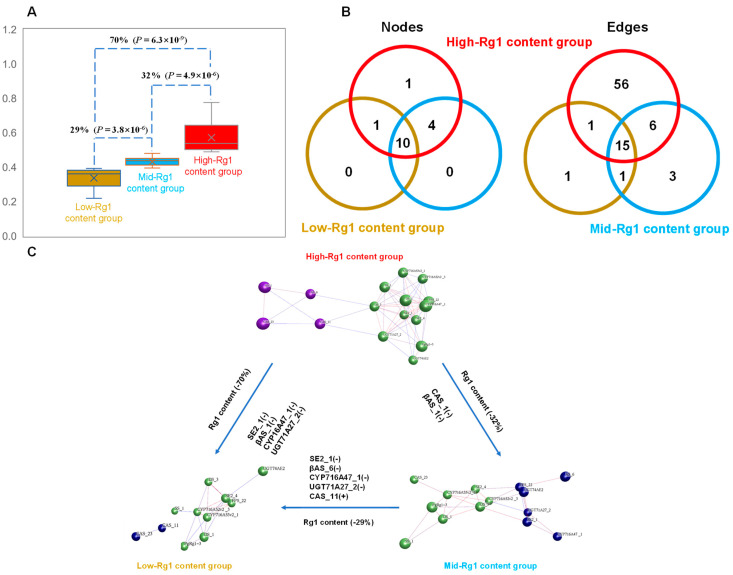
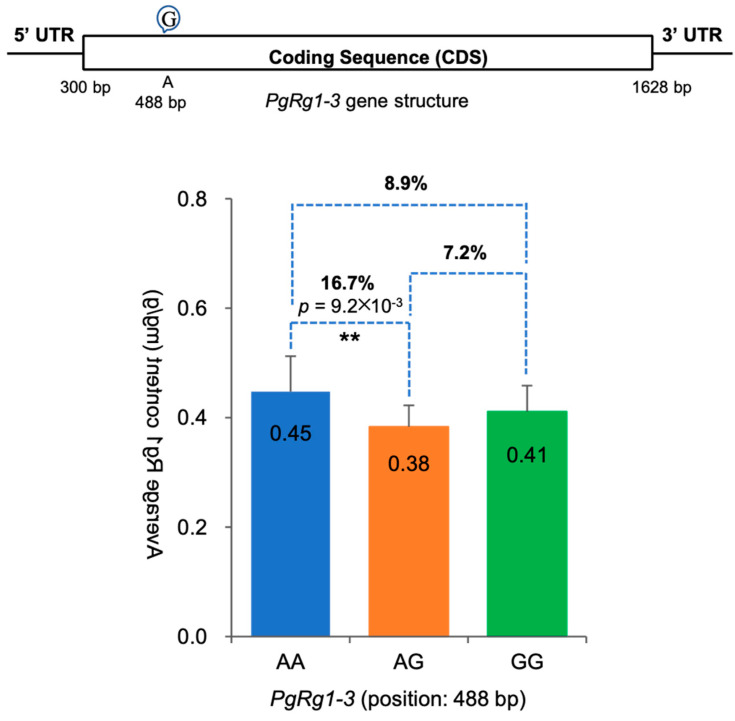
Ginseng, an important medicinal plant, is characterized by its main active component, ginsenosides. Among more than 40 ginsenosides, Rg1 is one of the ginsenosides used for measuring the quality of ginseng. Therefore, the identification and characterization of genes for Rg1 biosynthesis are important to elucidate the molecular basis of Rg1 biosynthesis. In this study, we utilized 39,327 SNPs and the corresponding Rg1 content from 344 core ginseng cultivars from Jilin Province. We conducted a genome-wide association study (GWAS) combining weighted gene co-expression network analysis (WGCNA), SNP-Rg1 content association analysis, and gene co-expression network analysis; three candidate Rg1 genes (PgRg1-1, PgRg1-2, and PgRg1-3) and one crucial candidate gene (PgRg1-3) were identified. Functional validation of PgRg1-3 was performed using methyl jasmonate (MeJA) regulation and RNAi, confirming that this gene regulates Rg1 biosynthesis. The spatial-temporal expression patterns of the PgRg1-3 gene and known key enzyme genes involved in ginsenoside biosynthesis differ. Furthermore, variations in their networks have a significant impact on Rg1 biosynthesis. This study established an accurate and efficient method for identifying candidate genes, cloned a novel gene controlling Rg1 biosynthesis, and identified 73 SNPs significantly associated with Rg1 content. This provides genetic resources and effective tools for further exploring the molecular mechanisms of Rg1 biosynthesis and molecular breeding.

Keywords: Rg1 biosynthesis genes; genetic effect; genome-wide association study; ginseng; ginsenoside Rg1; weighted gene co-expression network analysis.


Conflict of interest statement

The authors declare no conflicts of interest.

Figures

Figure 1
Figure 1
Manhattan plots of –Log10(p) vs. chromosomal position of SNP markers associated with ginsenoside Rg1 content and quantile–quantile (QQ) plots in a Jilin ginseng core collection using six single-locus models, (A) GLM, (B) GLM(Q), (C) GLM(PCA), (D) MLM(K), (E) MLM(Q + K), and (F) MLM(PCA + K). A red horizontal dashed line indicates the significant threshold –Log10(p) = 2.54 × 10⁻⁷ from Bonferroni correction method. The x-axis shows chromosomes and contigs.
Figure 2
Figure 2
Two QTNs were consistently identified, with one by all six single-locus models (A) and the other by all five multiple-locus models (B).
Figure 3
Figure 3
Module–trait association, orange module gene expression network, and identification of hub genes. (A) Module–trait association. Each row corresponds to a module gene and the column to Rg1 content. The numbers of each row indicate correlation coefficient (r) in the top and the p-value in parenthesis. (B) Network of Rg1 biosynthesis candidate genes with the highest r = 0.85 in orange module. The nodes show genes and the edges show the interactions between two genes. (C) Genes with top-5 degree were considered as hub genes.
Figure 4
Figure 4
Impacts of the SNP mutations of three Rg1 candidate genes on Rg1 contents in roots of four-year-old plants of 344 cultivars in the ginseng core collection. The mutation of each candidate gene is shown as the name and the position of the mutation. The impact of each mutation is shown as a percentage of the p-value (** for a two-tailed significance of p < 0.01). For details, see Supplementary Table S4.
Figure 5
Figure 5
Co-expression network of three Rg1 candidate genes and 15 key enzyme gene transcripts involved in ginsenoside biosynthesis in the four-year-old roots of 344 cultivars of the ginseng core collection. (A) Co-expression network of 18 genes was constructed at p ≤ 0.05. The rhombs (nodes) represent Rg1 candidate genes, the balls (nodes) represent key enzyme genes for ginsenoside biosynthesis, and the lines (edges) represent interactions between genes. The network consists of all three Rg1 candidate genes and 14 ginsenoside biosynthesis genes except ß-AS_1, and two clusters are shown by different colors. (B) At p ≤ 1 × 10⁻⁶, only the PgRg1-3 was in the co-expression network with key enzyme genes involved in ginsenoside biosynthesis, thus this gene is named the Rg1 key candidate gene for validation of its biological function.
Figure 6
Figure 6
Ginseng adventitious roots treated with MeJA from 6 h to 120 h, relative to the control roots not treated with MeJA (0 h). (A) Rg1 content variations in the adventitious roots treated with MeJA, relative to the control roots. (B) The expression variation of PgRg1-3 candidate gene in the adventitious roots treated with MeJA, relative to the control roots. (C) Correlation of PgRg1-3 candidate gene and key enzyme genes involved in ginsenoside biosynthesis after MeJA induced ginseng adventitious roots. The “*” and “**” asterisks indicate the difference between MeJA treated and control roots is significant at p ≤ 0.05 and 0.01, respectively. The remaining MeJA treated roots not labelled with asterisk are not significantly different from the control roots.
Figure 7
Figure 7
Functional validation of PgRg1-3 in Rg1 biosynthesis with RNAi genetic transformation. (A) Rg1 contents in transgenic lines and WT control determined by HPLC. (B) Expression of PgRg1-3 in transgenic lines and WT control determined by qPCR. The difference in Rg1 content or PgRg1-3 expression between transgenic lines and WT control was conducted by t-test, with “**” for significance at p ≤ 0.01 and “NS” for non-significance.
Figure 8
Figure 8
Effect of co-expression network variation of PgRg1-3 and 15 key enzyme gene transcripts for ginsenoside biosynthesis on Rg1 content among cultivar groups with high-, mid-, and low-Rg1 content. (A) Variation in Rg1 content among cultivar groups. The percentage represents Rg1 content variation between two groups and the p-value represents significant differences in Rg1 content between two groups. (B) Effect of variation of the gene nodes and the gene interaction edges in the network on Rg1 content. High-Rg1-content group is shown by red color, mid-Rg1-content group by brown color, and low-Rg1-content group by blue color. (C) Effect of number and type of genes and edges among the networks in high-, mid-, and low-Rg1-content groups.
Figure 9
Figure 9
The structure of the PgRg1-3 gene and the negative over-dominant effect of its SNP mutation at position 488 bp on Rg1 content in the 344 cultivars of the Jilin ginseng core collection. The genotypes of SNP mutations are shown in the x-axis. The number in the bar presents Rg1 content mean in a genotype and the percentage shows the impact of SNP mutation on Rg1 content. “**” for significance level of p ≤ 0.01.

Similar articles

Cited by

References

    1. Kim K.H., Lee D., Lee H.L., Kim C.E., Jung K., Kang K.S. Beneficial effects of Panax ginseng for the treatment and prevention of neurodegenerative diseases: Past findings and future directions. J. Ginseng Res. 2018;42:239–247. doi: 10.1016/j.jgr.2017.03.011. - DOI - PMC - PubMed
    1. Mancuso C., Santangelo R. Panax ginseng and Panax quinquefolius: From pharmacology to toxicology. Food Chem. Toxicol. 2017;107:362–372. doi: 10.1016/j.fct.2017.07.019. - DOI - PMC - PubMed
    1. Taik-Koo Y. Brief introduction of Panax ginseng C.A. Meyer. J. Korean Med. Sci. 2001;16:S3–S5. - PMC - PubMed
    1. Nam M.H., Kim S.I., Liu J.R., Yang D.C., Lim Y.P., Kwon K.H., Park Y.M. Proteomic analysis of Korean ginseng (Panax ginseng C.A. Meyer) J. Chromatogr. B. 2005;815:147–155. doi: 10.1016/j.jchromb.2004.10.063. - DOI - PubMed
    1. Fuzzati N. Analysis methods of ginsenosides. J. Chromatogr. B. 2004;812:119–133. doi: 10.1016/S1570-0232(04)00645-2. - DOI - PubMed

LinkOut - more resources